| Param | Original file | Final file |
|---|---|---|
| Filename | modeM0/AS1C09_011T05_9000006474_52313cztM0_level2.fits | modeM0/AS1C09_011T05_9000006474_52313cztM0_level2_quad_clean.evt |
| Size (bytes) | 1,108,650,240 | 71,173,440 |
| Size | 1.0 GB | 67.9 MB |
| Events in quadrant A | 4,085,239 | 668,579 |
| Events in quadrant B | 4,996,190 | 715,398 |
| Events in quadrant C | 15,315,364 | 121,808 |
| Events in quadrant D | 16,079,276 | 143,126 |
| Mode M0 | |||
|---|---|---|---|
| Quadrant | BADHDUFLAG | Total packets | Discarded packets |
| A | 0 | 17172 | 0 |
| B | 0 | 19891 | 0 |
| C | 0 | 50483 | 0 |
| D | 0 | 52725 | 0 |
| Mode SS | |||
|---|---|---|---|
| Quadrant | BADHDUFLAG | Total packets | Discarded packets |
| A | 0 | 144 | 0 |
| B | 0 | 144 | 0 |
| C | 0 | 144 | 0 |
| D | 0 | 144 | 0 |
| Quadrant | Total seconds | Saturated seconds | Saturation percentage |
|---|---|---|---|
| A | 7268 | 151 | 2.077600% |
| B | 7268 | 135 | 1.857457% |
| C | 7268 | 6129 | 84.328564% |
| D | 7269 | 5841 | 80.354932% |
Noise dominated data is calculated using 1-second bins in cleaned event files. If a bin has >2000 counts, and if more than 50% of those come from <1% of pixels, then it is considered to be noise-dominated and hence unusable.
| Quadrant | # 1 sec bins | Bins with >0 counts | Bins with >2000 counts | High rate bins dominated by noise | Noise dominated (total time) | Noise dominated (detector-on time) | Marked lightcurve |
|---|---|---|---|---|---|---|---|
| A | 7268 | 7268 | 135 | 135 | 1.86% | 1.86% | 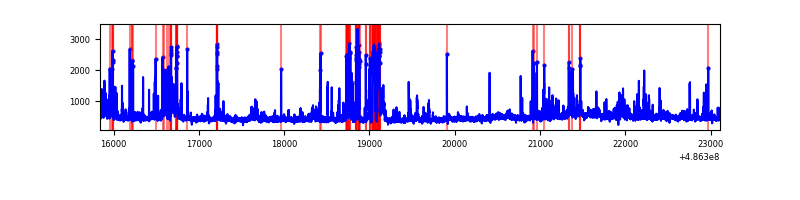 |
| B | 7268 | 7268 | 76 | 76 | 1.05% | 1.05% | 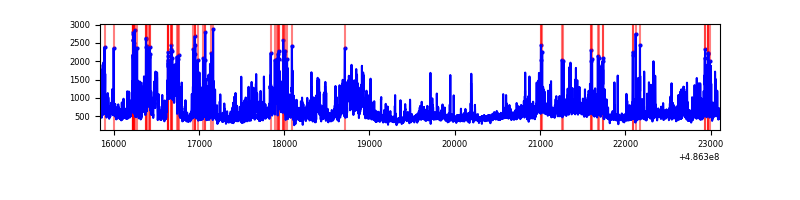 |
| C | 7267 | 7267 | 4897 | 4897 | 67.39% | 67.39% | 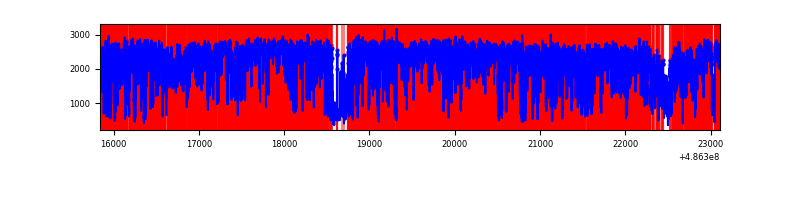 |
| D | 7268 | 7268 | 5692 | 5692 | 78.32% | 78.32% | 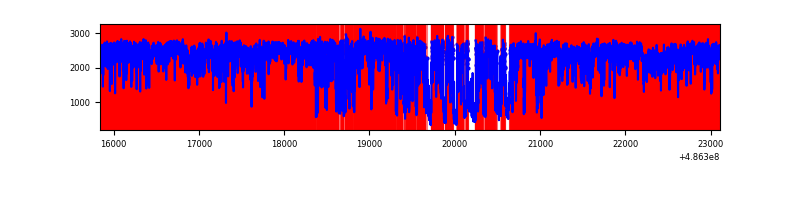 |
Top three noisy pixels from each quadrant. If the there are fewer than three noisy pixels in the level2.evt file, extra rows are filled as -1
| Pixel properties | Quadrant properties | ||||||
|---|---|---|---|---|---|---|---|
| Quadrant | DetID | PixID | Counts | Sigma | Mean | Median | Sigma |
| A | 15 | 174 | 335326 | 1765.57 | 752 | 732 | 189.5 |
| A | 4 | 249 | 245704 | 1292.66 | 752 | 732 | 189.5 |
| A | 12 | 80 | 86954 | 454.97 | 752 | 732 | 189.5 |
| B | 10 | 254 | 738290 | 4667.77 | 740 | 715 | 158.0 |
| B | 4 | 171 | 380562 | 2403.88 | 740 | 715 | 158.0 |
| B | 0 | 216 | 340919 | 2153.0 | 740 | 715 | 158.0 |
| C | 15 | 178 | 5948203 | 73170.64 | 290 | 288 | 81.3 |
| C | 0 | 161 | 3433476 | 42234.73 | 290 | 288 | 81.3 |
| C | 15 | 224 | 2954183 | 36338.51 | 290 | 288 | 81.3 |
| D | 15 | 93 | 11380883 | 108092.35 | 363 | 345 | 105.3 |
| D | 12 | 2 | 892692 | 8475.51 | 363 | 345 | 105.3 |
| D | 8 | 176 | 700509 | 6650.16 | 363 | 345 | 105.3 |
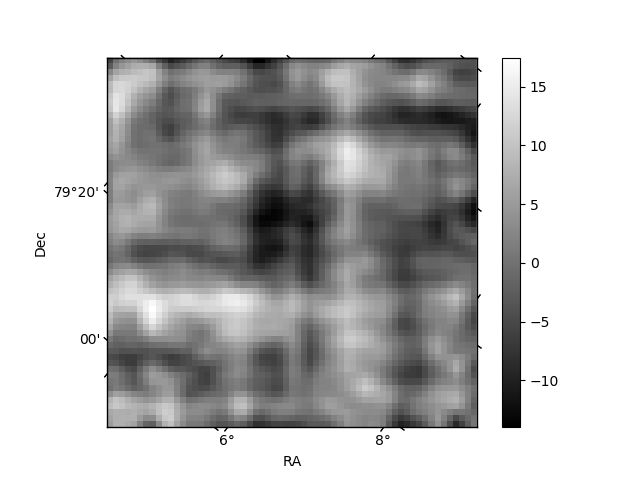
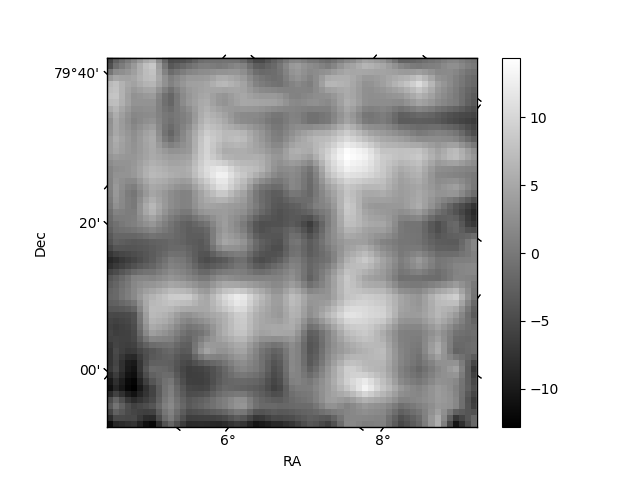
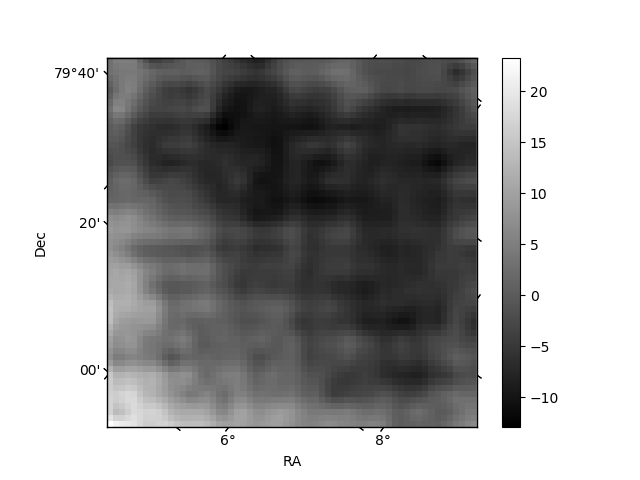
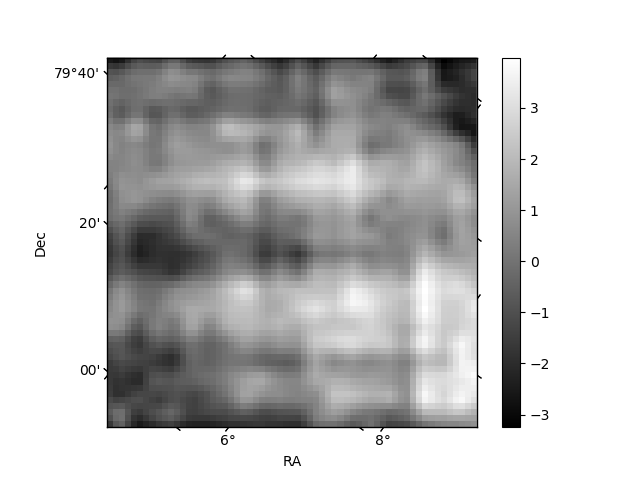
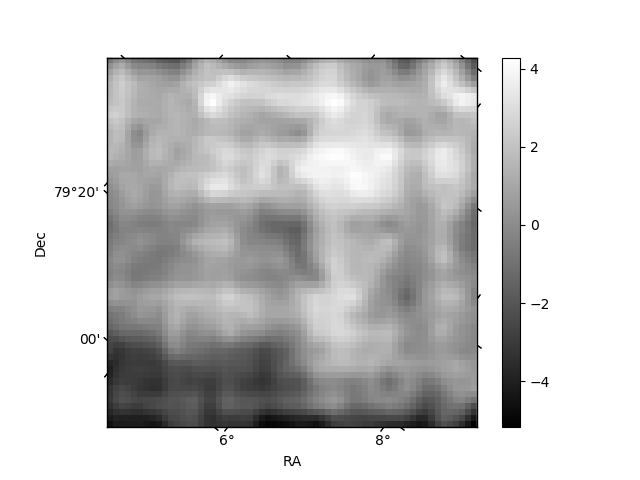
Histogram calculated using DETX and DETY for each event in the final _common_clean file
| Quadrant A | 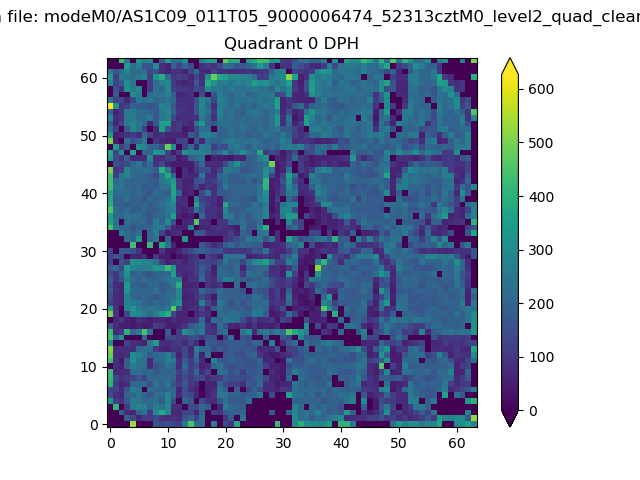 |
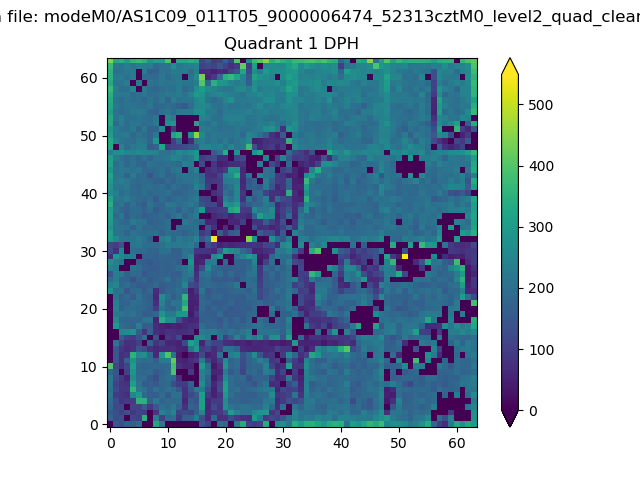 |
Quadrant B |
|---|---|---|---|
| Quadrant D | 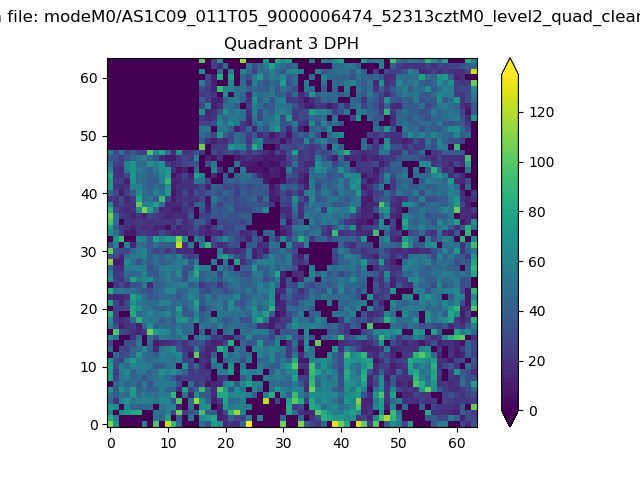 |
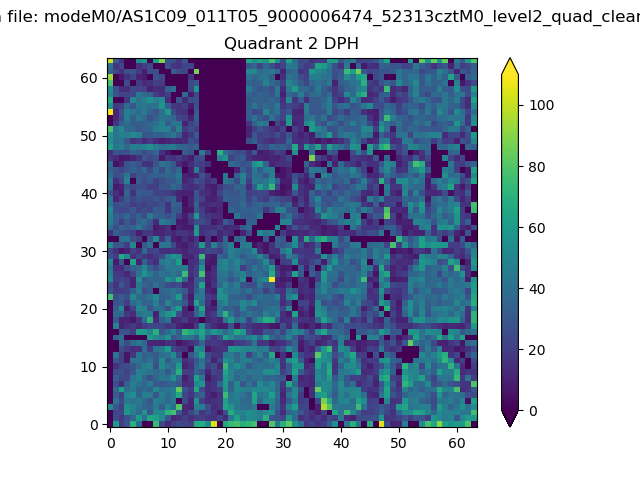 |
Quadrant C |
| Plot type | Count rate plots | Images |
|---|---|---|
| Comparison with Poisson distribution Blue bars denote a histogram of data divided into 1 sec bins. Red curve is a Poisson curve with rate = median count rate of data. |
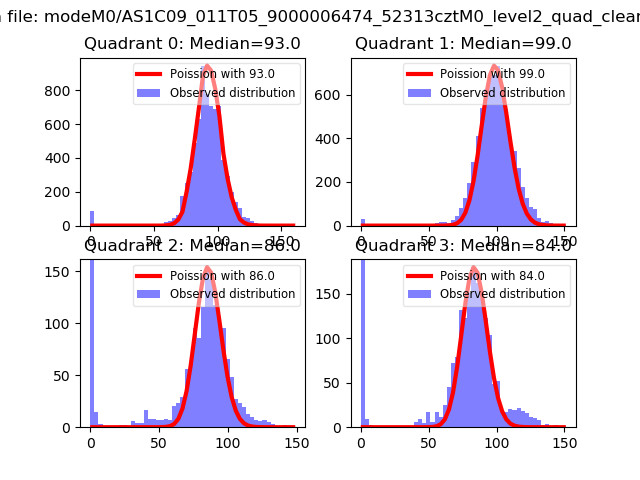 |
 |
| Quadrant-wise count rates Data is divided into 100 sec bins |
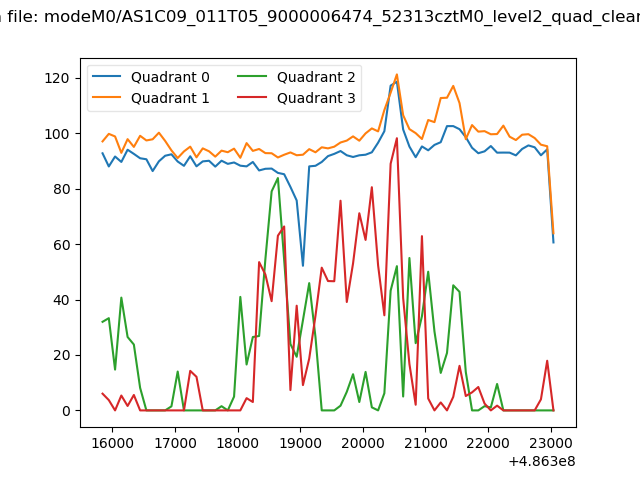 |
|
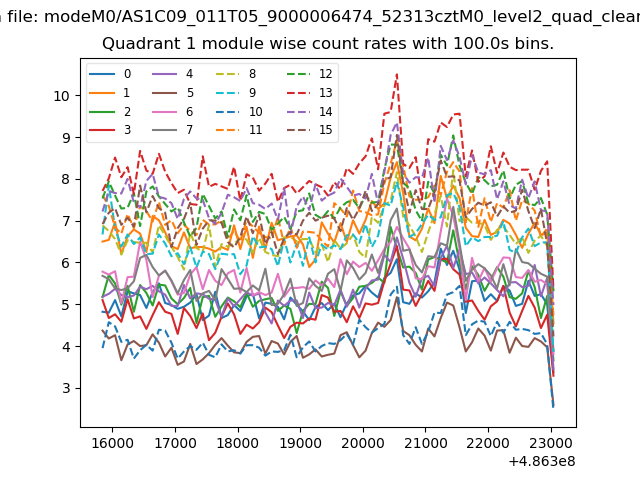
| Module-wise count rates for Quadrant A Data is divided into 100 sec bins |
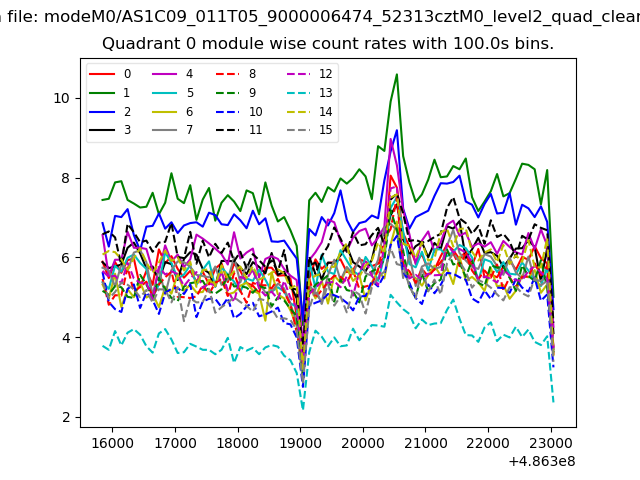 |
 |
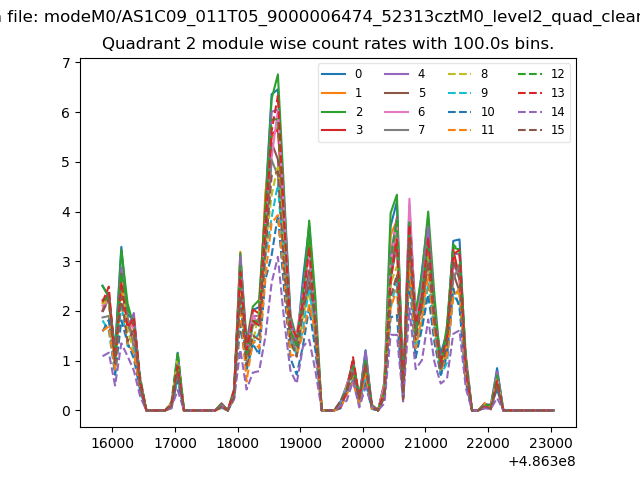
| Module-wise count rates for Quadrant B Data is divided into 100 sec bins |
 |
 |
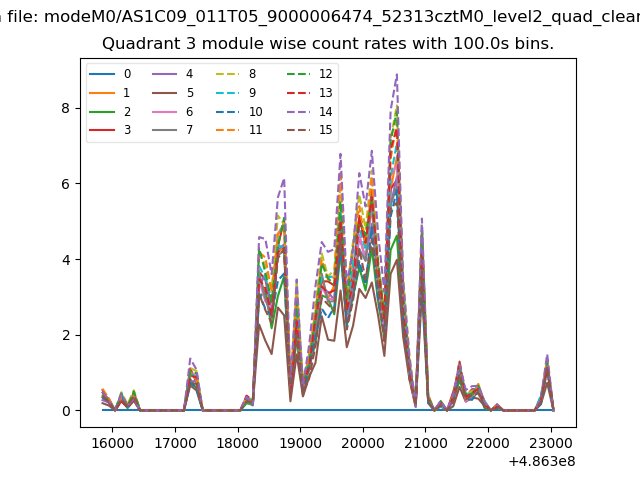
| Module-wise count rates for Quadrant C Data is divided into 100 sec bins |
 |
 |
| Module-wise count rates for Quadrant D Data is divided into 100 sec bins |
 |
 |
| Parameter | Plot |
|---|---|
| CZT HV Monitor | 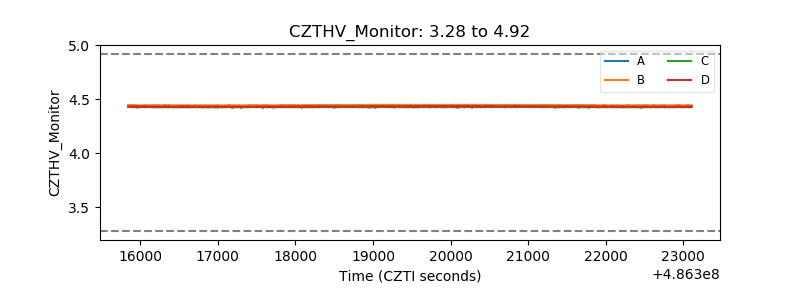 |
| D_VDD | 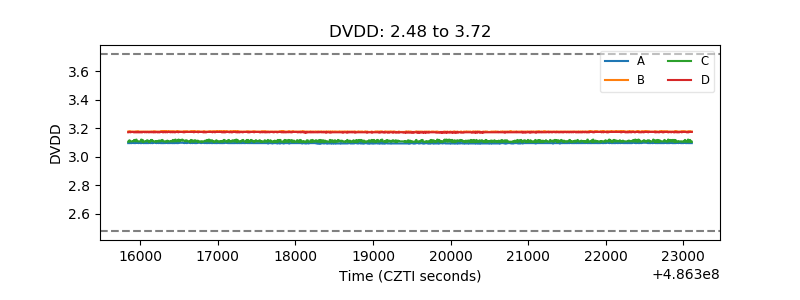 |
| Temperature 1 | 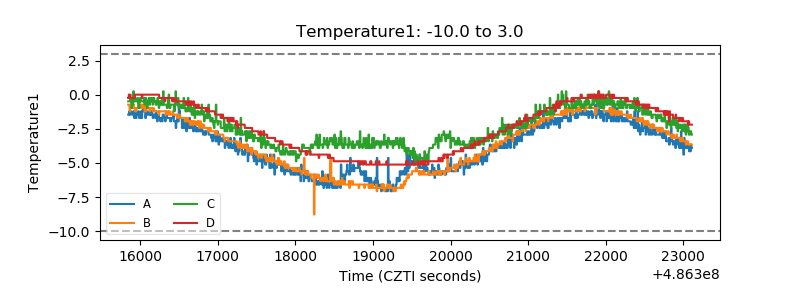 |
| Veto HV Monitor | 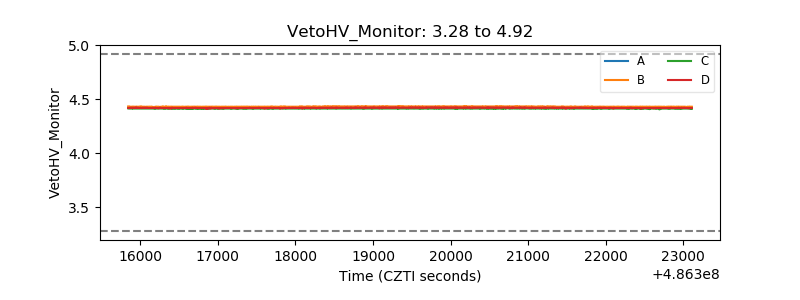 |
| Veto LLD | 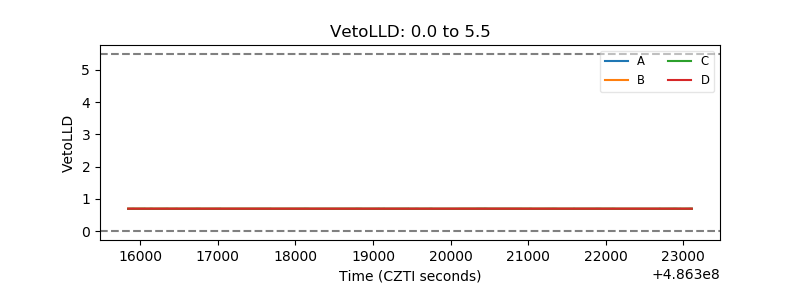 |
| Alpha Counter | 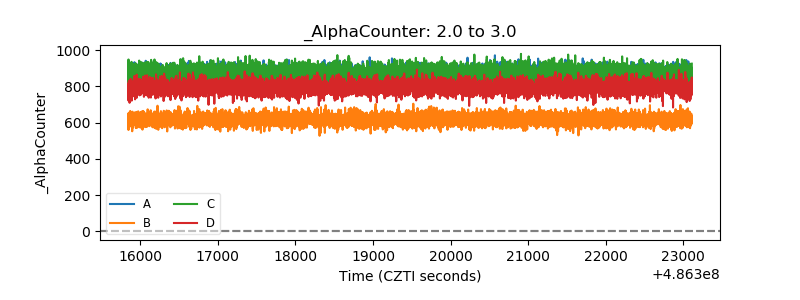 |
| _CPM_Rate | 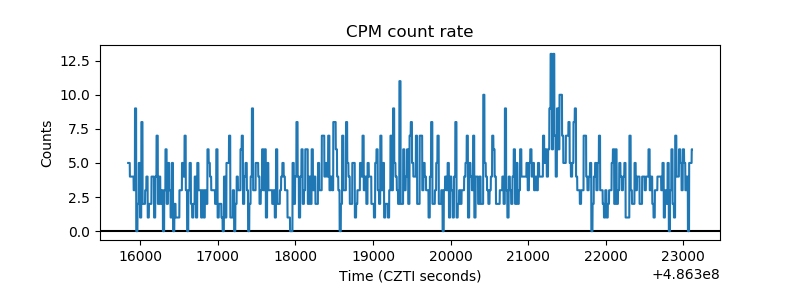 |
| CZT Counter | 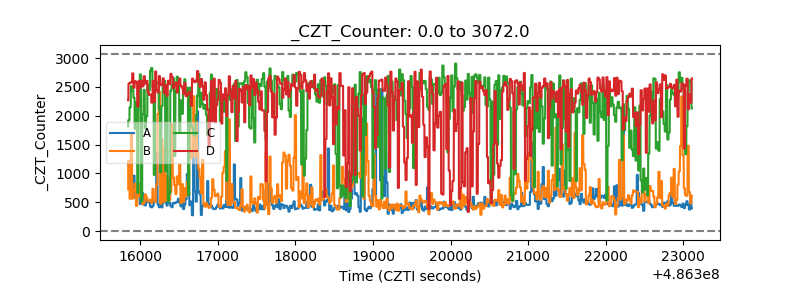 |
| +2.5 Volts monitor | 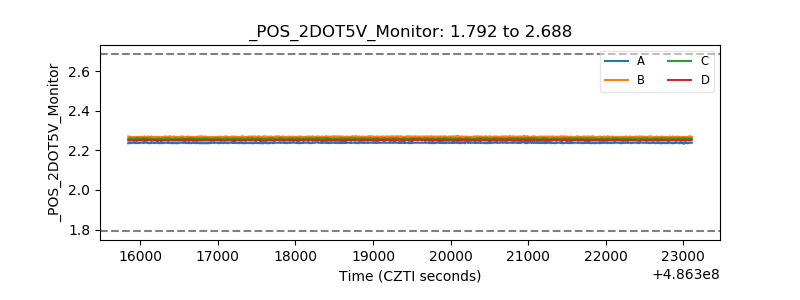 |
| +5 Volts monitor |  |
| _ROLL_ROT | 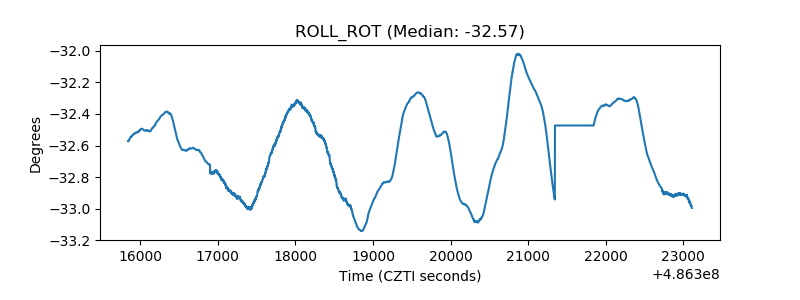 |
| _Roll_DEC | 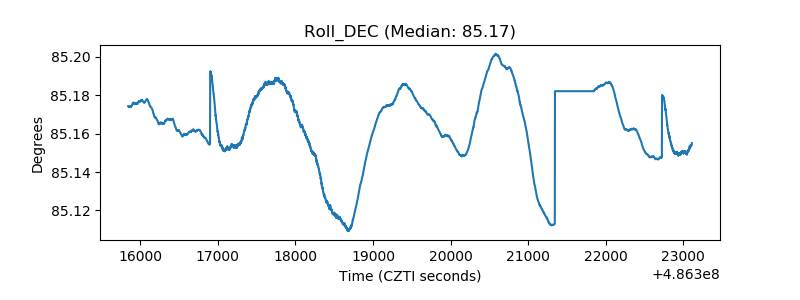 |
| _Roll_RA | 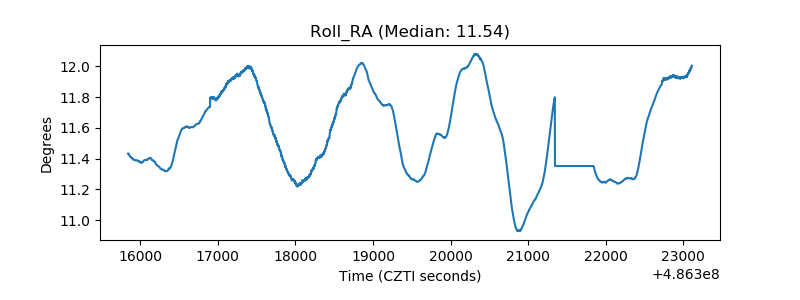 |
| Veto Counter | 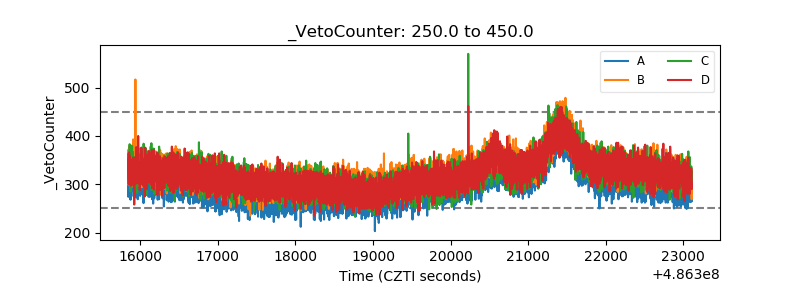 |