| Param | Original file | Final file |
|---|---|---|
| Filename | modeM0/AS1C09_011T05_9000006474_52314cztM0_level2.fits | modeM0/AS1C09_011T05_9000006474_52314cztM0_level2_quad_clean.evt |
| Size (bytes) | 1,125,152,640 | 79,672,320 |
| Size | 1.0 GB | 76.0 MB |
| Events in quadrant A | 5,186,204 | 701,106 |
| Events in quadrant B | 4,961,142 | 752,847 |
| Events in quadrant C | 14,047,132 | 252,122 |
| Events in quadrant D | 16,862,320 | 172,971 |
| Mode M0 | |||
|---|---|---|---|
| Quadrant | BADHDUFLAG | Total packets | Discarded packets |
| A | 0 | 20771 | 0 |
| B | 0 | 20161 | 0 |
| C | 0 | 47011 | 0 |
| D | 0 | 55266 | 1 |
| Mode SS | |||
|---|---|---|---|
| Quadrant | BADHDUFLAG | Total packets | Discarded packets |
| A | 0 | 152 | 0 |
| B | 0 | 152 | 0 |
| C | 0 | 152 | 0 |
| D | 0 | 152 | 0 |
| Quadrant | Total seconds | Saturated seconds | Saturation percentage |
|---|---|---|---|
| A | 7664 | 334 | 4.358038% |
| B | 7664 | 265 | 3.457724% |
| C | 7664 | 5161 | 67.340814% |
| D | 7663 | 5945 | 77.580582% |
Noise dominated data is calculated using 1-second bins in cleaned event files. If a bin has >2000 counts, and if more than 50% of those come from <1% of pixels, then it is considered to be noise-dominated and hence unusable.
| Quadrant | # 1 sec bins | Bins with >0 counts | Bins with >2000 counts | High rate bins dominated by noise | Noise dominated (total time) | Noise dominated (detector-on time) | Marked lightcurve |
|---|---|---|---|---|---|---|---|
| A | 7664 | 7664 | 308 | 308 | 4.02% | 4.02% | 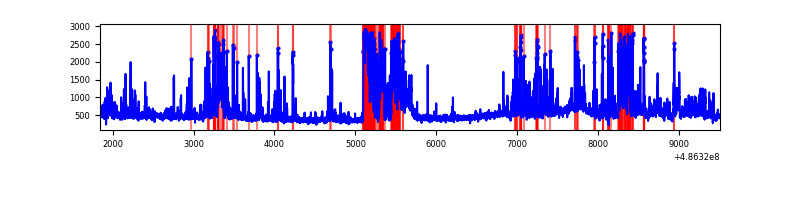 |
| B | 7664 | 7664 | 86 | 86 | 1.12% | 1.12% | 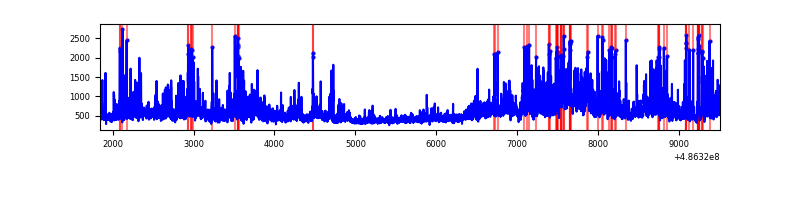 |
| C | 7663 | 7663 | 3836 | 3836 | 50.06% | 50.06% | 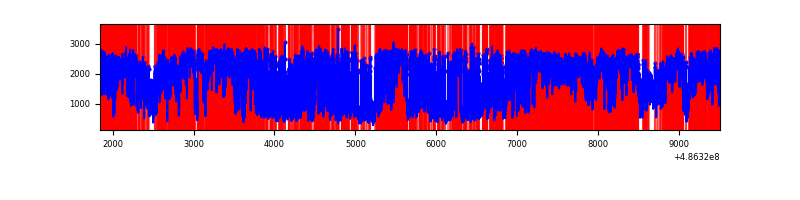 |
| D | 7663 | 7663 | 5761 | 5761 | 75.18% | 75.18% | 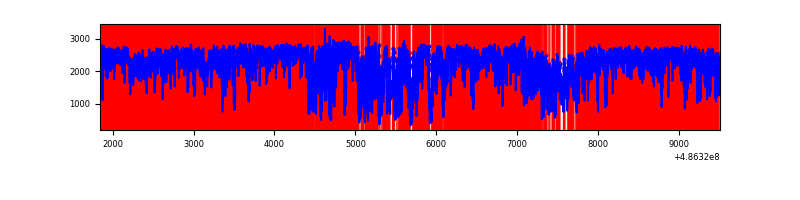 |
Top three noisy pixels from each quadrant. If the there are fewer than three noisy pixels in the level2.evt file, extra rows are filled as -1
| Pixel properties | Quadrant properties | ||||||
|---|---|---|---|---|---|---|---|
| Quadrant | DetID | PixID | Counts | Sigma | Mean | Median | Sigma |
| A | 7 | 206 | 789613 | 3987.44 | 791 | 772 | 197.8 |
| A | 15 | 239 | 194191 | 977.7 | 791 | 772 | 197.8 |
| A | 15 | 250 | 177506 | 893.36 | 791 | 772 | 197.8 |
| B | 4 | 171 | 550753 | 3280.97 | 788 | 763 | 167.6 |
| B | 0 | 216 | 492767 | 2935.05 | 788 | 763 | 167.6 |
| B | 0 | 213 | 278769 | 1658.45 | 788 | 763 | 167.6 |
| C | 15 | 178 | 4437161 | 39617.7 | 396 | 392 | 112.0 |
| C | 0 | 161 | 4034641 | 36023.43 | 396 | 392 | 112.0 |
| C | 15 | 224 | 3314017 | 29588.69 | 396 | 392 | 112.0 |
| D | 15 | 93 | 11792289 | 90916.24 | 442 | 420 | 129.7 |
| D | 12 | 2 | 1407352 | 10847.56 | 442 | 420 | 129.7 |
| D | 8 | 176 | 275349 | 2119.72 | 442 | 420 | 129.7 |
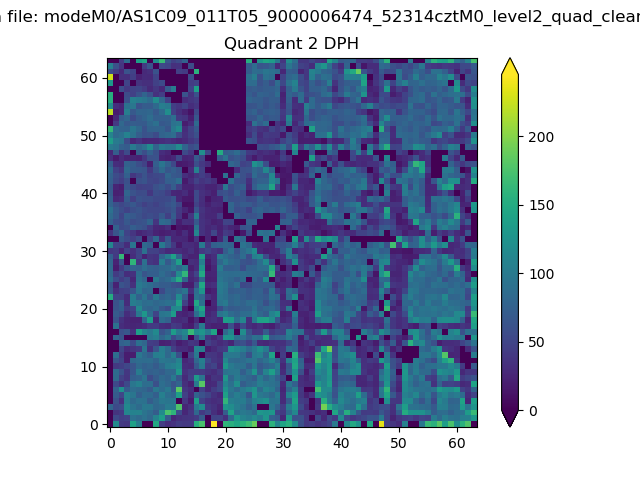
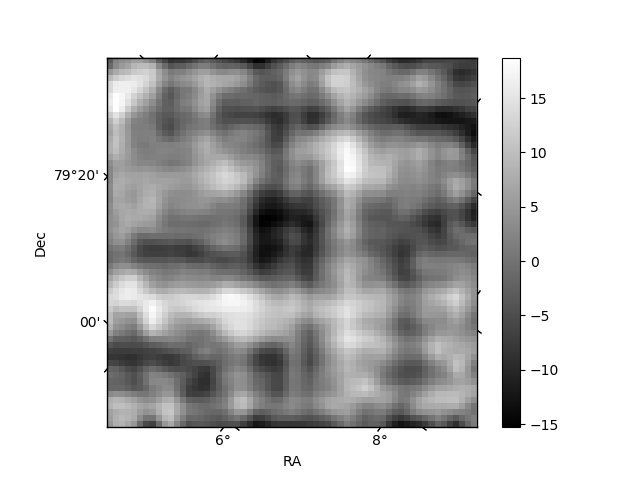
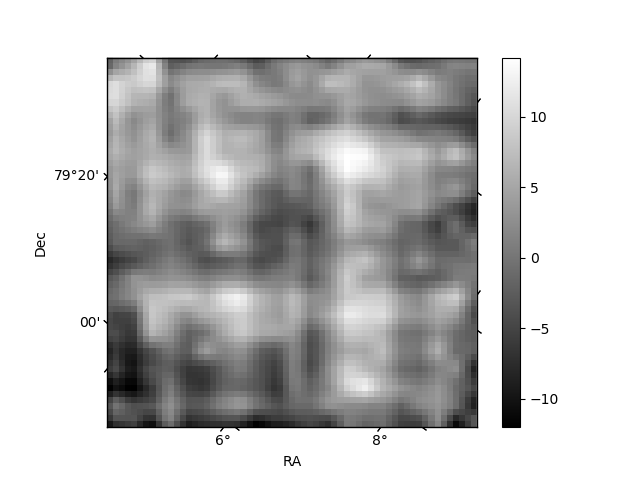
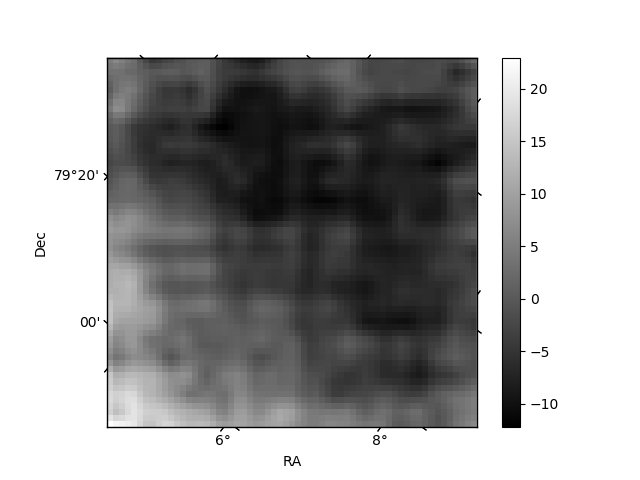
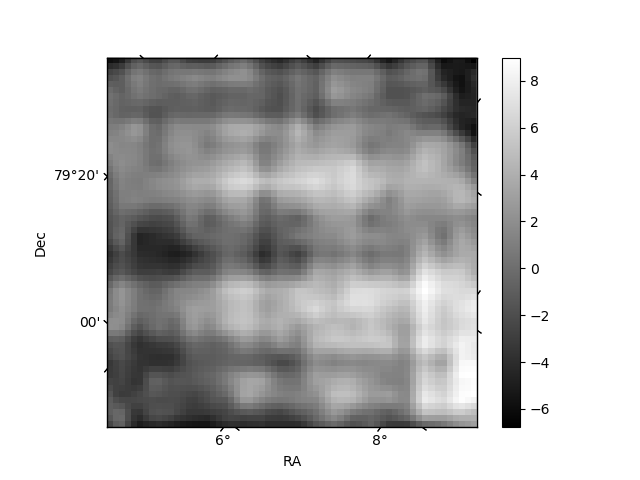
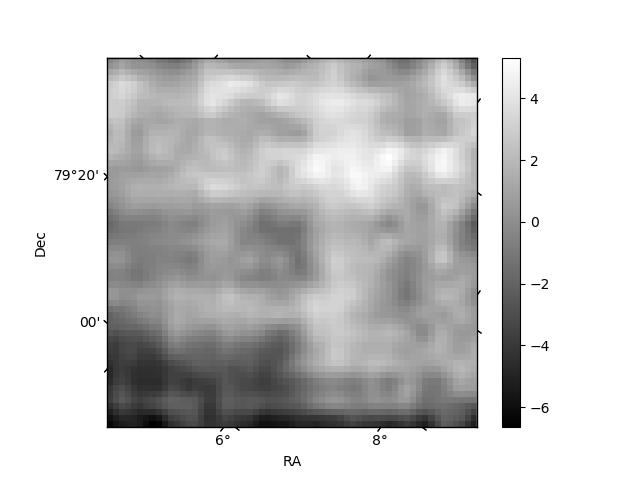
Histogram calculated using DETX and DETY for each event in the final _common_clean file
| Quadrant A | 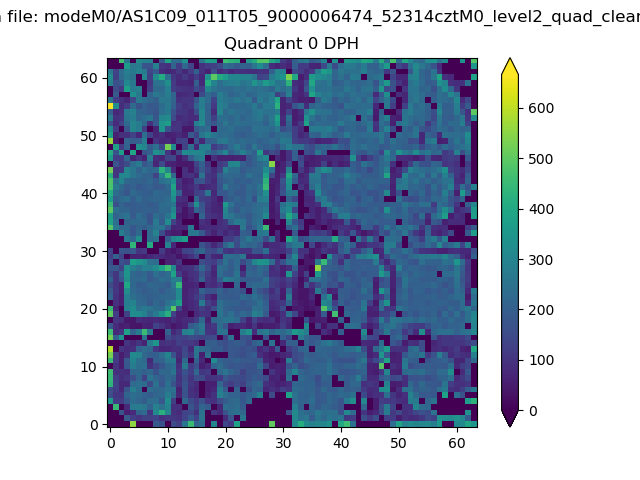 |
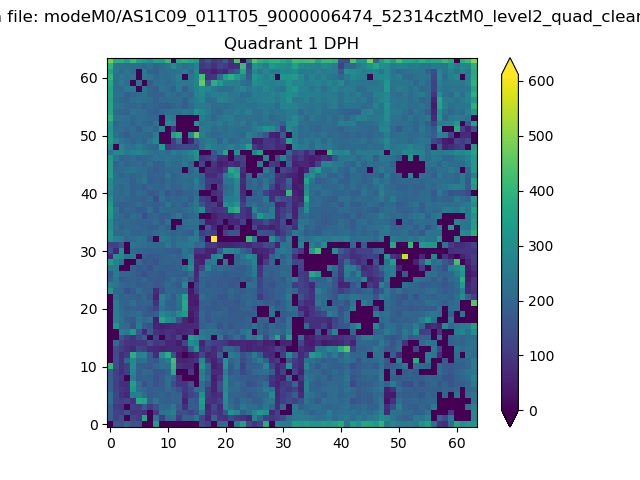 |
Quadrant B |
|---|---|---|---|
| Quadrant D | 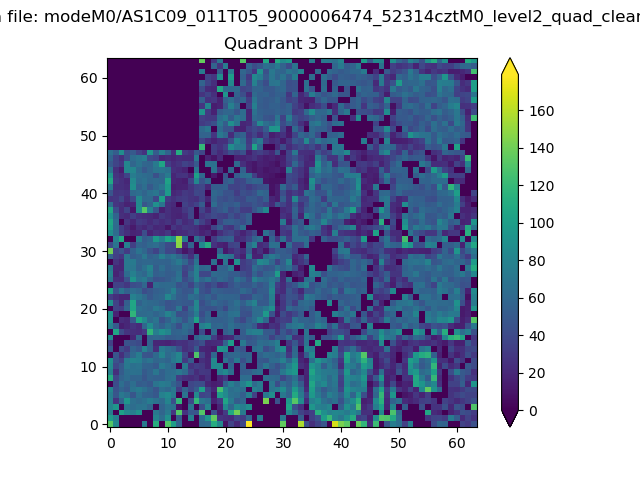 |
 |
Quadrant C |
| Plot type | Count rate plots | Images |
|---|---|---|
| Comparison with Poisson distribution Blue bars denote a histogram of data divided into 1 sec bins. Red curve is a Poisson curve with rate = median count rate of data. |
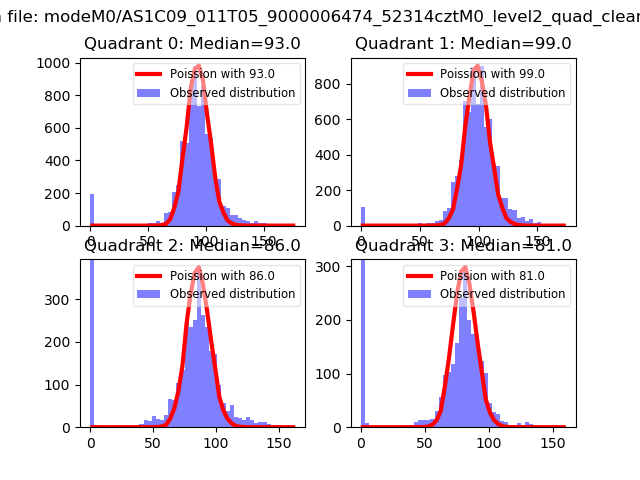 |
 |
| Quadrant-wise count rates Data is divided into 100 sec bins |
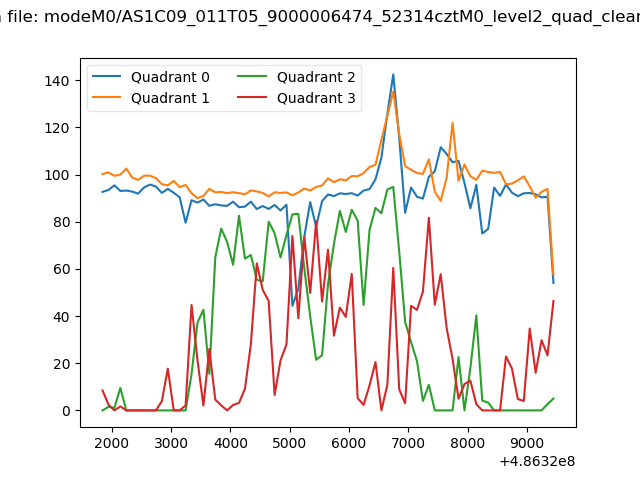 |
|
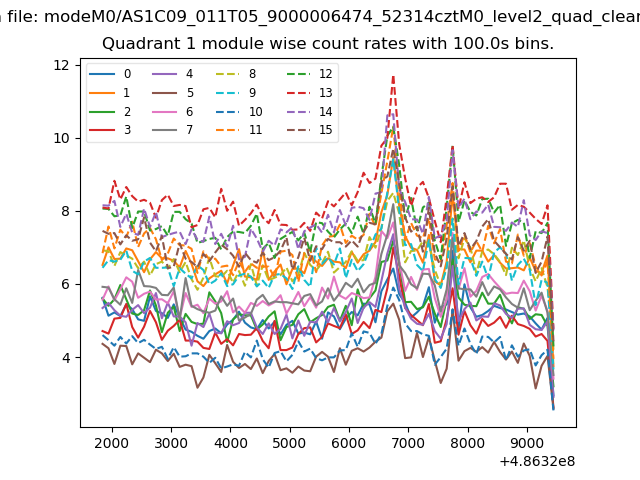
| Module-wise count rates for Quadrant A Data is divided into 100 sec bins |
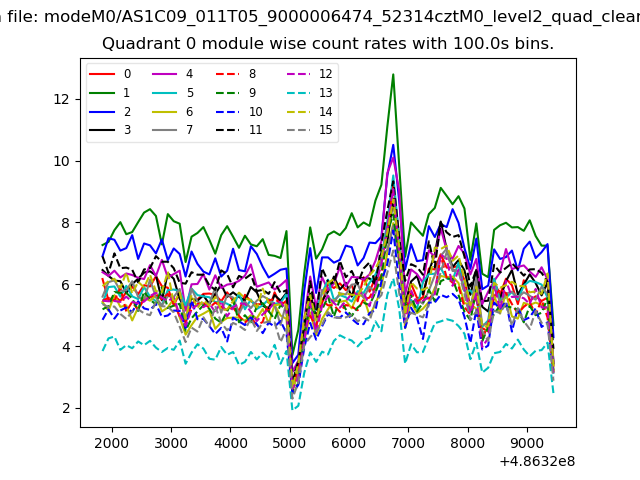 |
 |
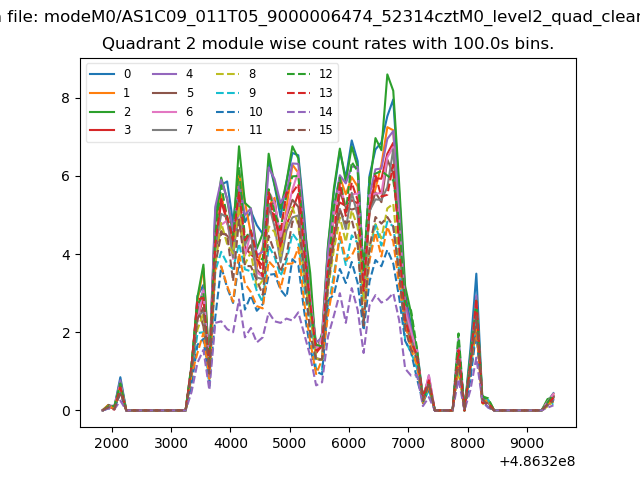
| Module-wise count rates for Quadrant B Data is divided into 100 sec bins |
 |
 |
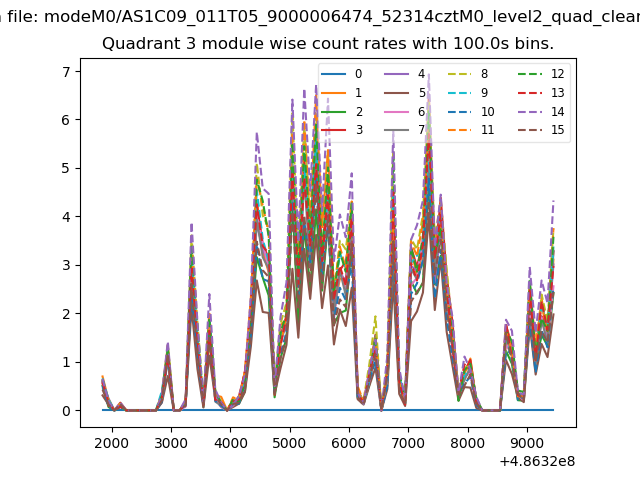
| Module-wise count rates for Quadrant C Data is divided into 100 sec bins |
 |
 |
| Module-wise count rates for Quadrant D Data is divided into 100 sec bins |
 |
 |
| Parameter | Plot |
|---|---|
| CZT HV Monitor | 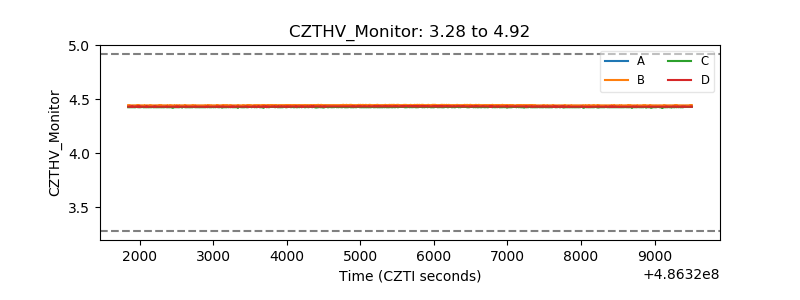 |
| D_VDD | 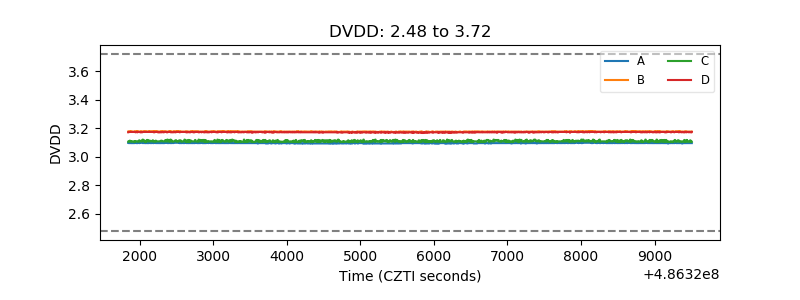 |
| Temperature 1 | 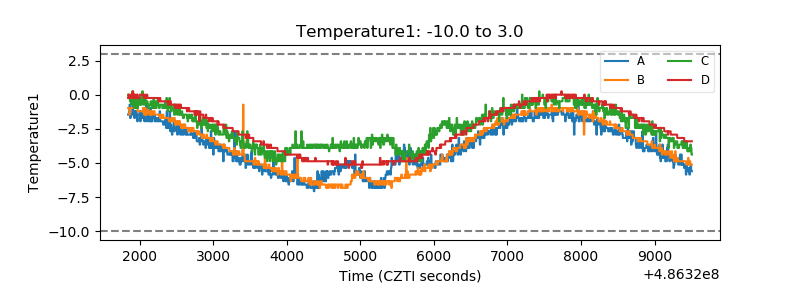 |
| Veto HV Monitor |  |
| Veto LLD | 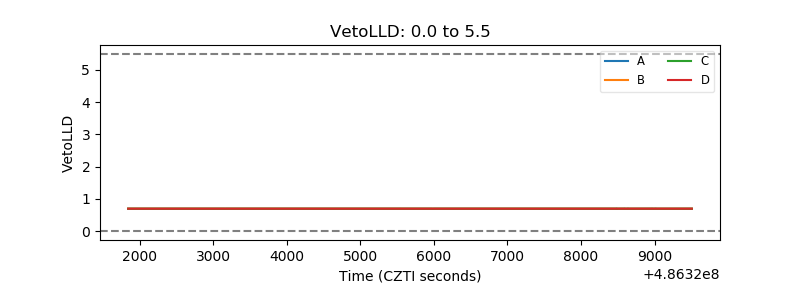 |
| Alpha Counter | 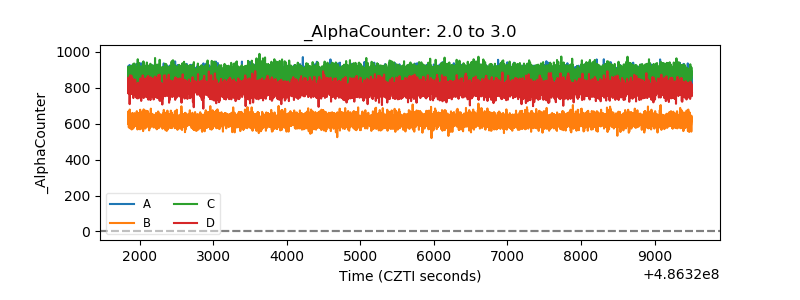 |
| _CPM_Rate | 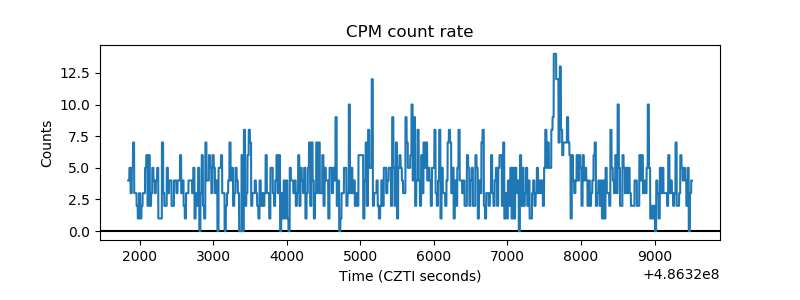 |
| CZT Counter | 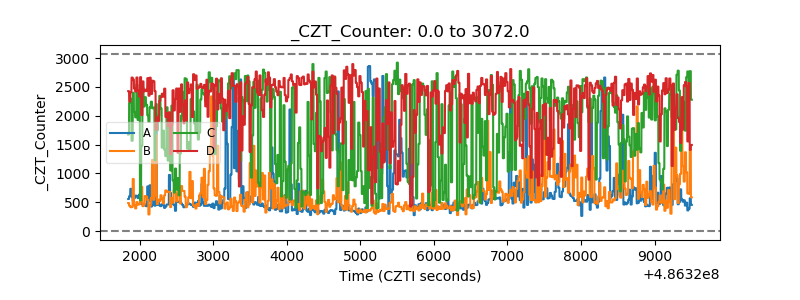 |
| +2.5 Volts monitor |  |
| +5 Volts monitor |  |
| _ROLL_ROT | 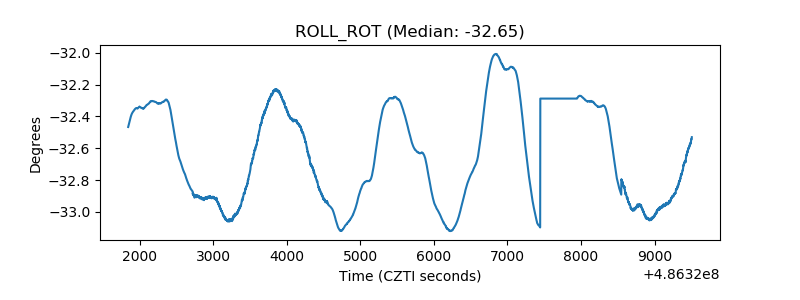 |
| _Roll_DEC | 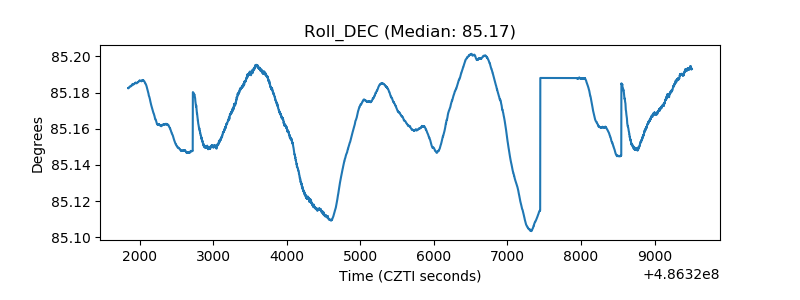 |
| _Roll_RA | 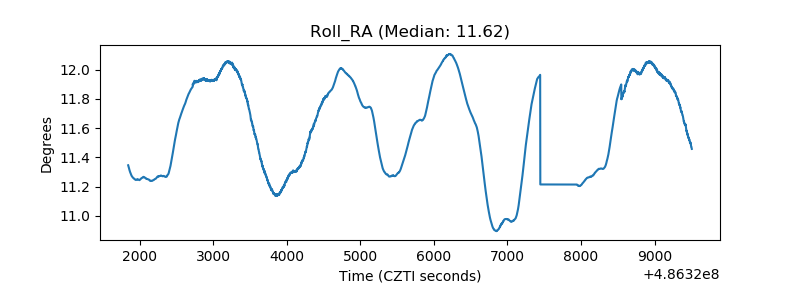 |
| Veto Counter | 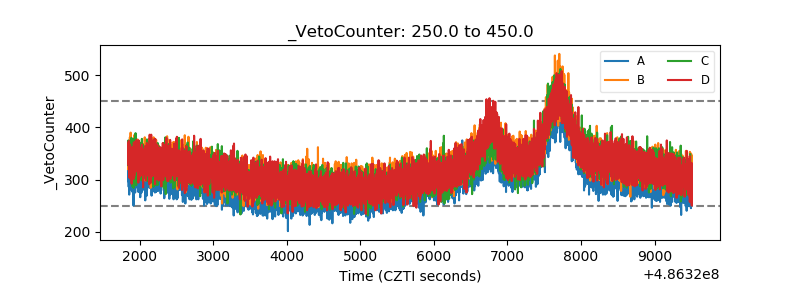 |