| Param | Original file | Final file |
|---|---|---|
| Filename | modeM0/AS1C09_011T05_9000006474_52320cztM0_level2.fits | modeM0/AS1C09_011T05_9000006474_52320cztM0_level2_quad_clean.evt |
| Size (bytes) | 771,937,920 | 77,037,120 |
| Size | 736.2 MB | 73.5 MB |
| Events in quadrant A | 3,500,884 | 604,547 |
| Events in quadrant B | 3,950,575 | 628,306 |
| Events in quadrant C | 10,198,310 | 289,193 |
| Events in quadrant D | 10,438,072 | 371,629 |
| Mode M0 | |||
|---|---|---|---|
| Quadrant | BADHDUFLAG | Total packets | Discarded packets |
| A | 0 | 15158 | 229 |
| B | 0 | 16435 | 286 |
| C | 0 | 35390 | 748 |
| D | 0 | 36097 | 730 |
| Mode SS | |||
|---|---|---|---|
| Quadrant | BADHDUFLAG | Total packets | Discarded packets |
| A | 0 | 128 | 2 |
| B | 0 | 128 | 2 |
| C | 0 | 128 | 2 |
| D | 0 | 128 | 2 |
| Mode M9 | |||
|---|---|---|---|
| Quadrant | BADHDUFLAG | Total packets | Discarded packets |
| A | 0 | 10 | 0 |
| B | 0 | 10 | 0 |
| C | 0 | 10 | 0 |
| D | 0 | 10 | 0 |
| Quadrant | Total seconds | Saturated seconds | Saturation percentage |
|---|---|---|---|
| A | 6296 | 89 | 1.413596% |
| B | 6292 | 152 | 2.415766% |
| C | 6282 | 3281 | 52.228590% |
| D | 6277 | 2284 | 36.386809% |
Noise dominated data is calculated using 1-second bins in cleaned event files. If a bin has >2000 counts, and if more than 50% of those come from <1% of pixels, then it is considered to be noise-dominated and hence unusable.
| Quadrant | # 1 sec bins | Bins with >0 counts | Bins with >2000 counts | High rate bins dominated by noise | Noise dominated (total time) | Noise dominated (detector-on time) | Marked lightcurve |
|---|---|---|---|---|---|---|---|
| A | 7371 | 6309 | 58 | 58 | 0.79% | 0.92% | 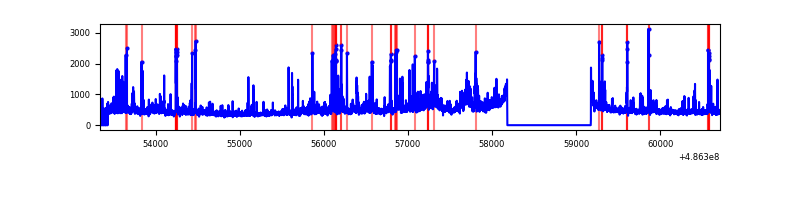 |
| B | 7367 | 6302 | 64 | 64 | 0.87% | 1.02% | 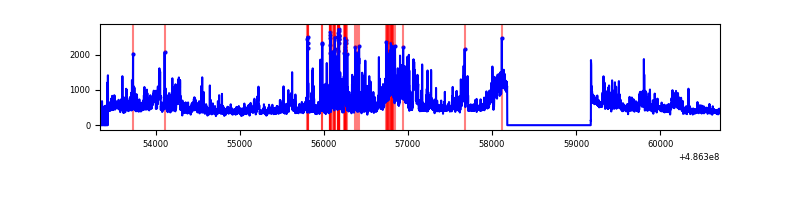 |
| C | 7286 | 6286 | 3059 | 3059 | 41.98% | 48.66% | 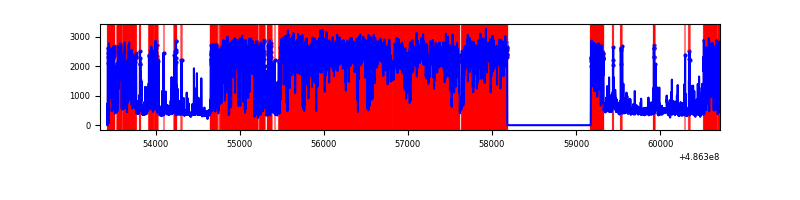 |
| D | 7278 | 6283 | 2426 | 2426 | 33.33% | 38.61% | 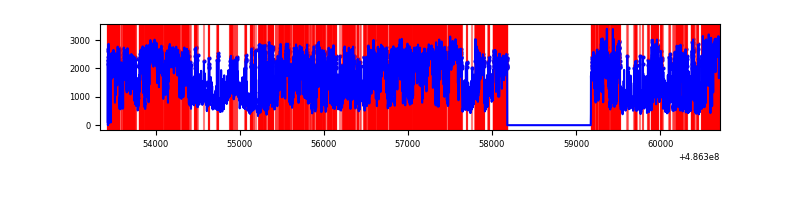 |
Top three noisy pixels from each quadrant. If the there are fewer than three noisy pixels in the level2.evt file, extra rows are filled as -1
| Pixel properties | Quadrant properties | ||||||
|---|---|---|---|---|---|---|---|
| Quadrant | DetID | PixID | Counts | Sigma | Mean | Median | Sigma |
| A | 5 | 240 | 166990 | 1025.03 | 649 | 632 | 162.3 |
| A | 8 | 9 | 160832 | 987.09 | 649 | 632 | 162.3 |
| A | 15 | 174 | 159471 | 978.7 | 649 | 632 | 162.3 |
| B | 7 | 0 | 524057 | 3819.25 | 637 | 613 | 137.1 |
| B | 4 | 171 | 327767 | 2387.04 | 637 | 613 | 137.1 |
| B | 0 | 213 | 179358 | 1304.19 | 637 | 613 | 137.1 |
| C | 15 | 178 | 5705230 | 49784.16 | 404 | 400 | 114.6 |
| C | 15 | 224 | 2099048 | 18314.21 | 404 | 400 | 114.6 |
| C | 5 | 250 | 251209 | 2188.73 | 404 | 400 | 114.6 |
| D | 12 | 17 | 2513525 | 16360.32 | 525 | 501 | 153.6 |
| D | 15 | 93 | 2324807 | 15131.73 | 525 | 501 | 153.6 |
| D | 12 | 2 | 748194 | 4867.64 | 525 | 501 | 153.6 |
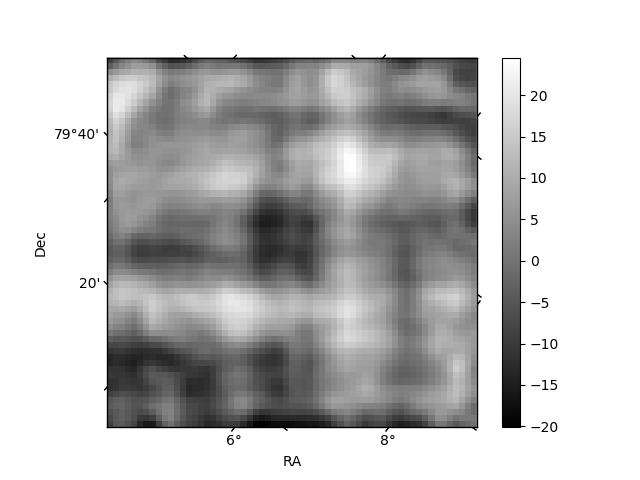
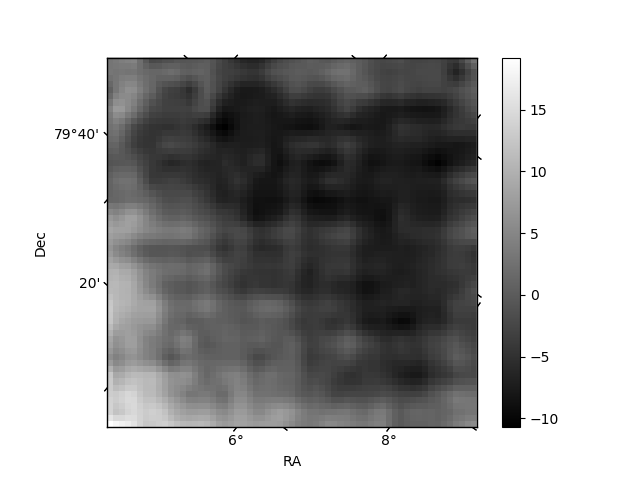
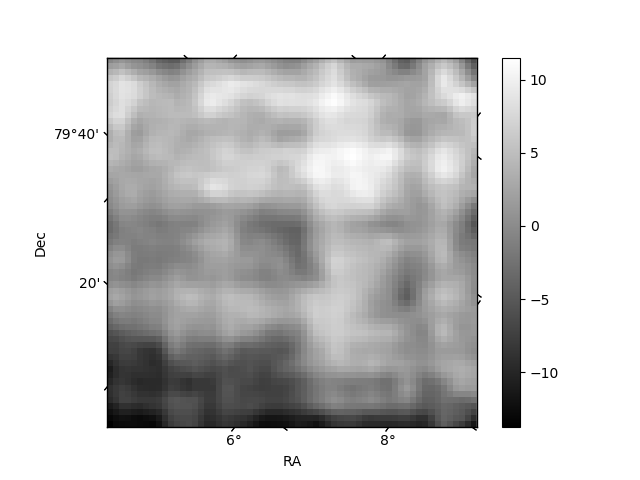
Histogram calculated using DETX and DETY for each event in the final _common_clean file
| Quadrant A | 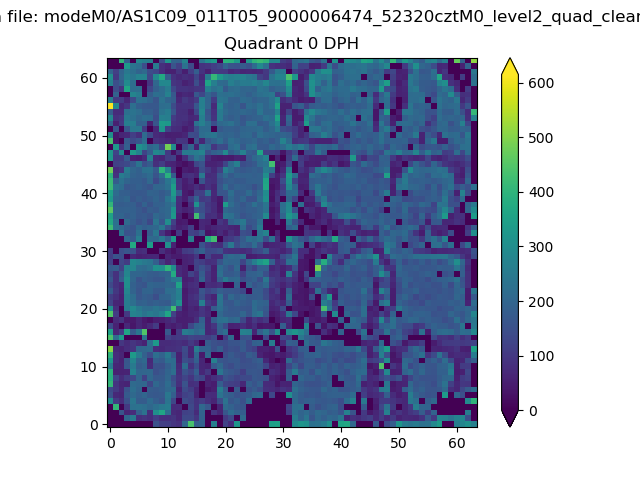 |
 |
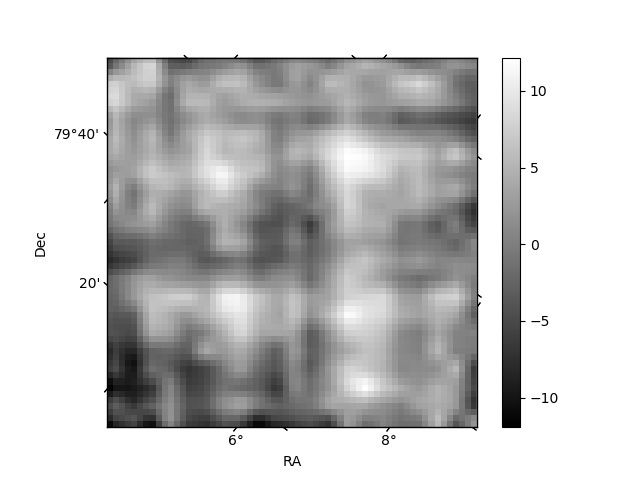
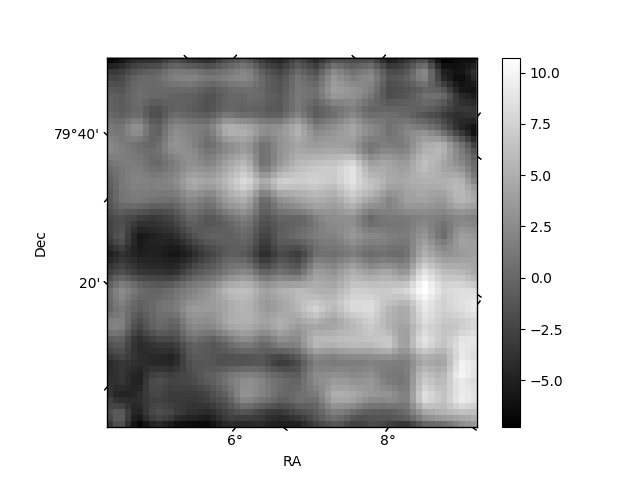
Quadrant B |
|---|---|---|---|
| Quadrant D | 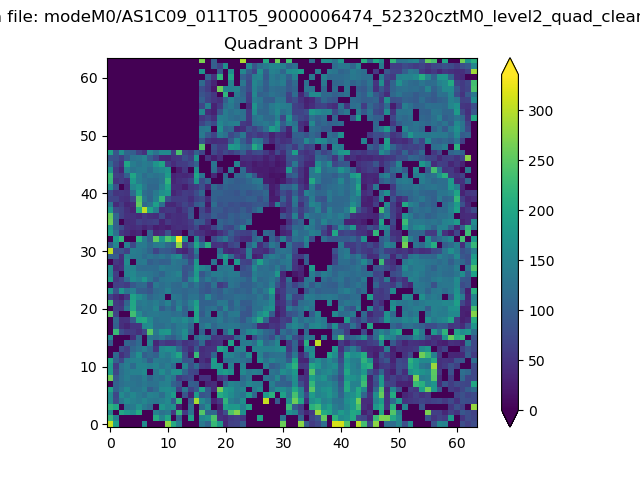 |
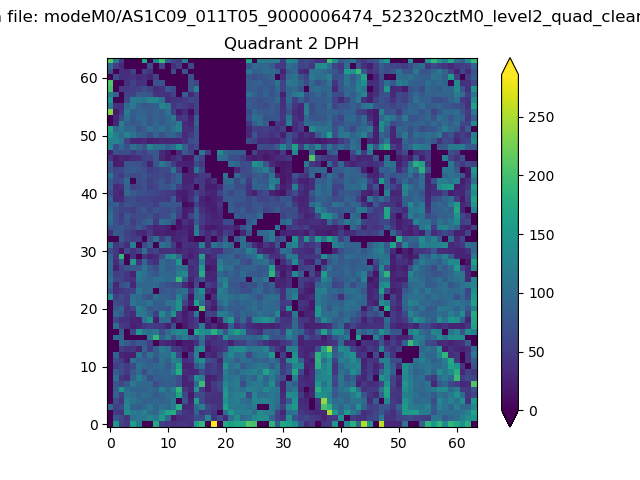 |
Quadrant C |
| Plot type | Count rate plots | Images |
|---|---|---|
| Comparison with Poisson distribution Blue bars denote a histogram of data divided into 1 sec bins. Red curve is a Poisson curve with rate = median count rate of data. |
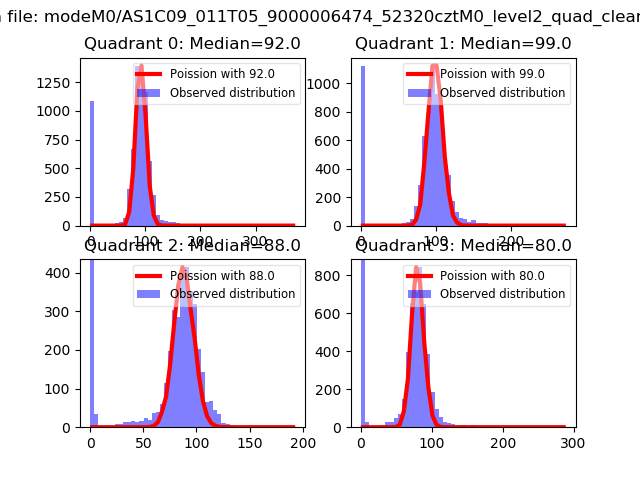 |
 |
| Quadrant-wise count rates Data is divided into 100 sec bins |
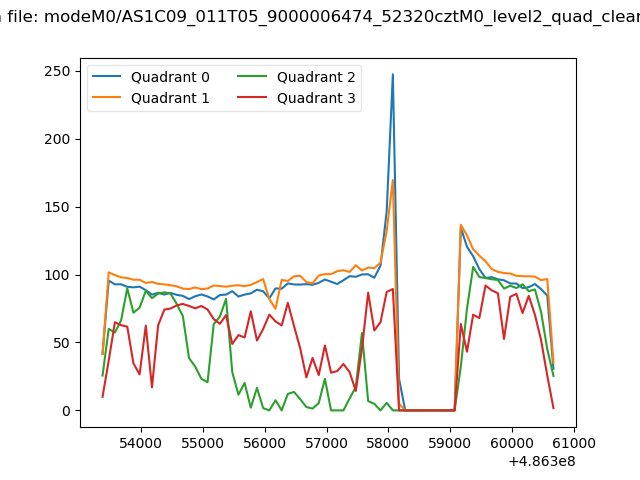 |
|
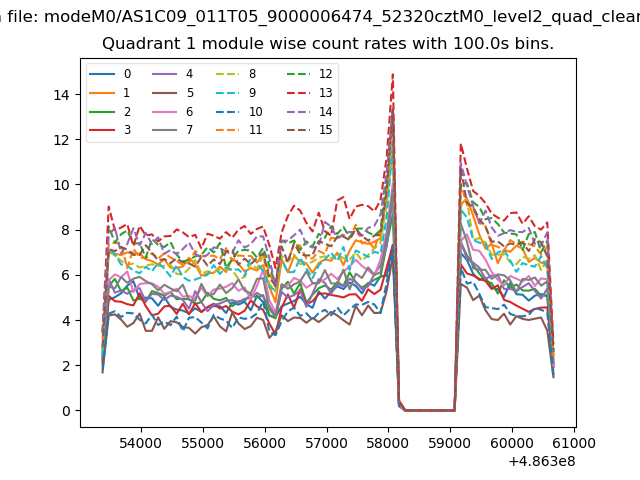
| Module-wise count rates for Quadrant A Data is divided into 100 sec bins |
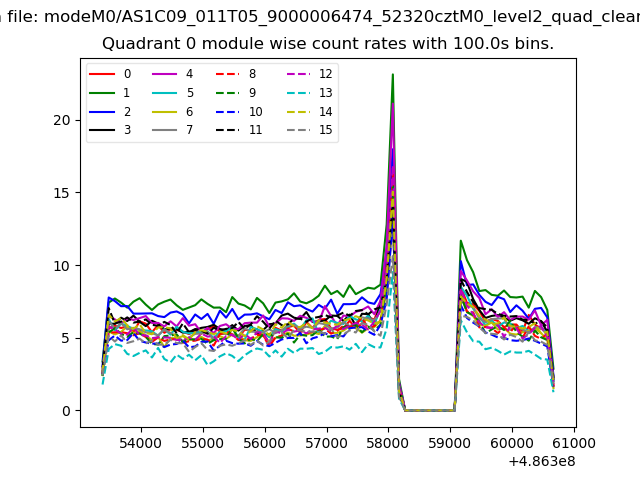 |
 |
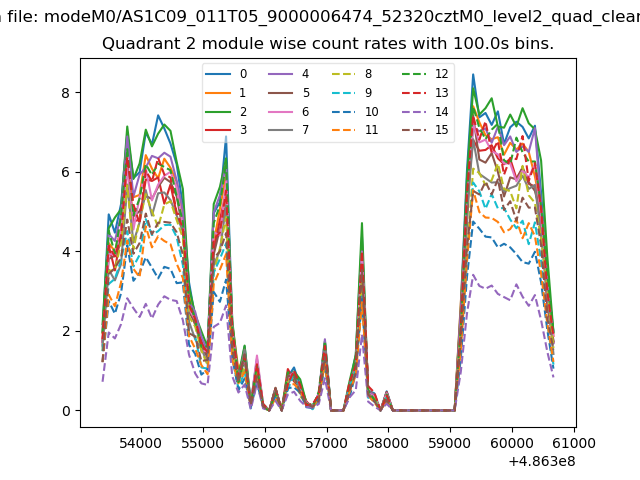
| Module-wise count rates for Quadrant B Data is divided into 100 sec bins |
 |
 |
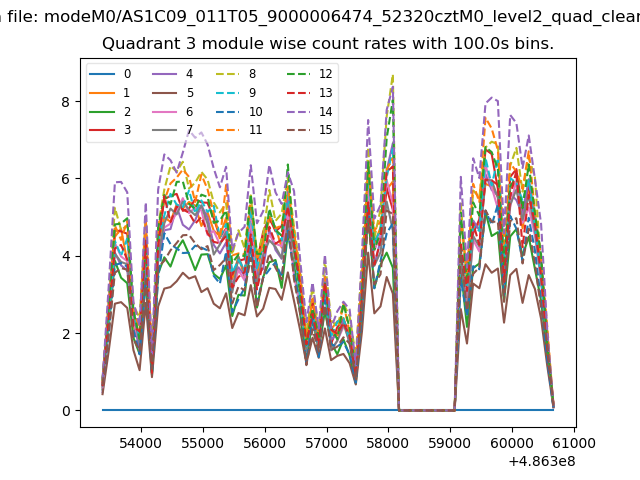
| Module-wise count rates for Quadrant C Data is divided into 100 sec bins |
 |
 |
| Module-wise count rates for Quadrant D Data is divided into 100 sec bins |
 |
 |
| Parameter | Plot |
|---|---|
| CZT HV Monitor | 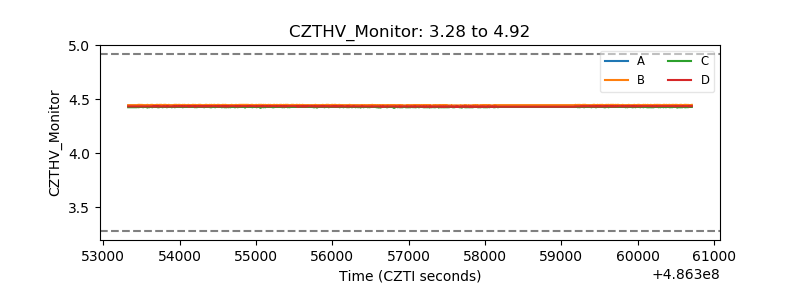 |
| D_VDD | 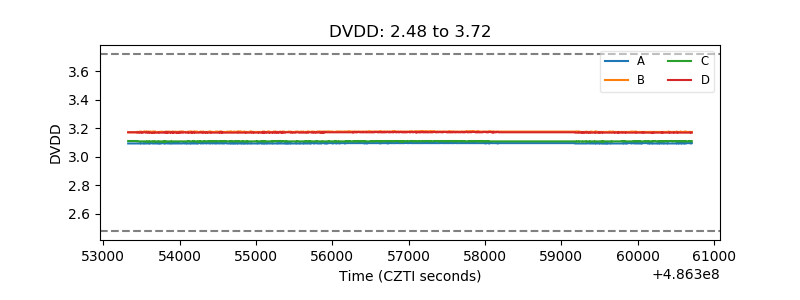 |
| Temperature 1 | 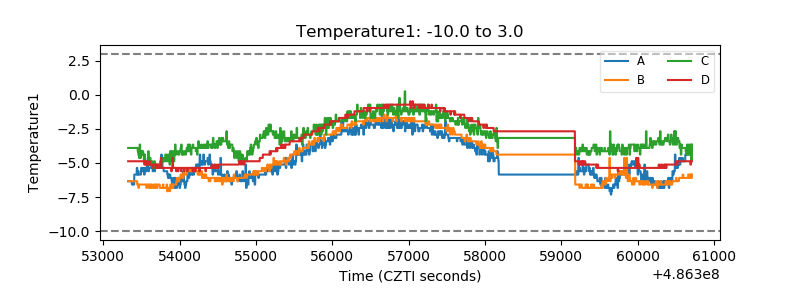 |
| Veto HV Monitor | 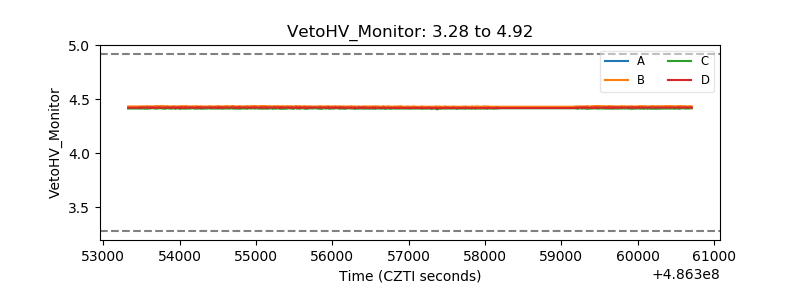 |
| Veto LLD | 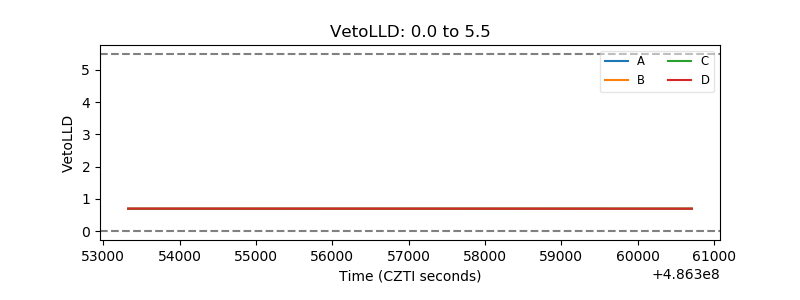 |
| Alpha Counter | 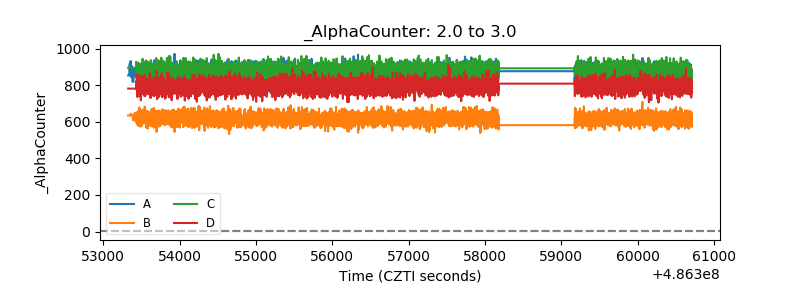 |
| _CPM_Rate | 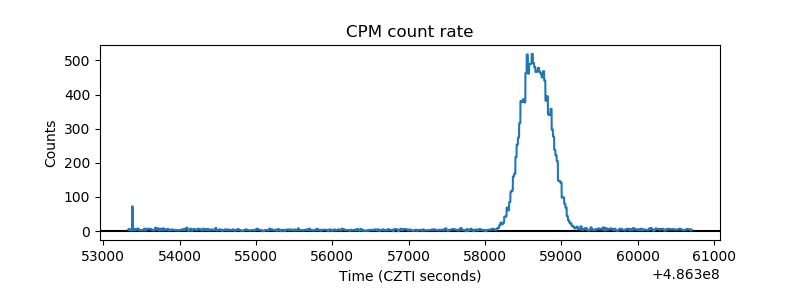 |
| CZT Counter | 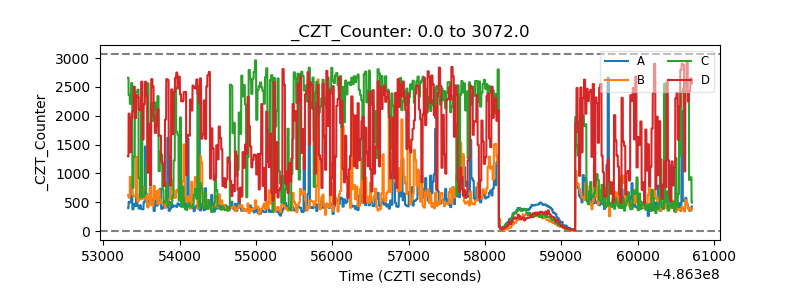 |
| +2.5 Volts monitor | 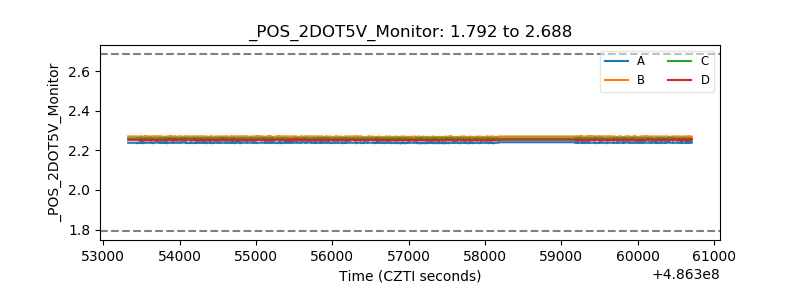 |
| +5 Volts monitor | 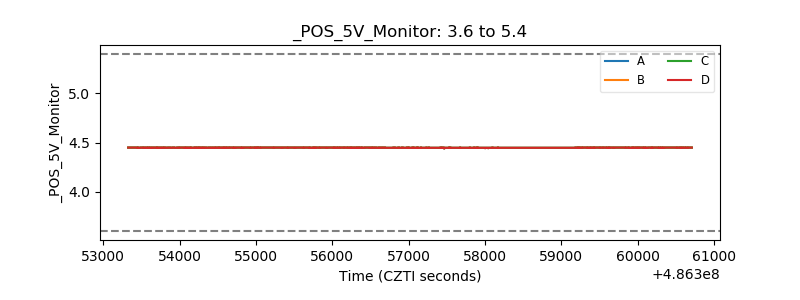 |
| _ROLL_ROT | 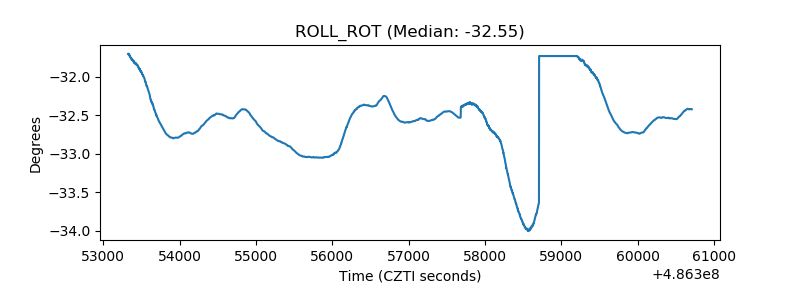 |
| _Roll_DEC | 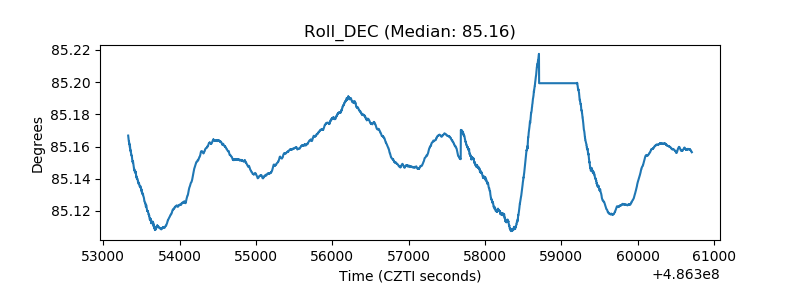 |
| _Roll_RA | 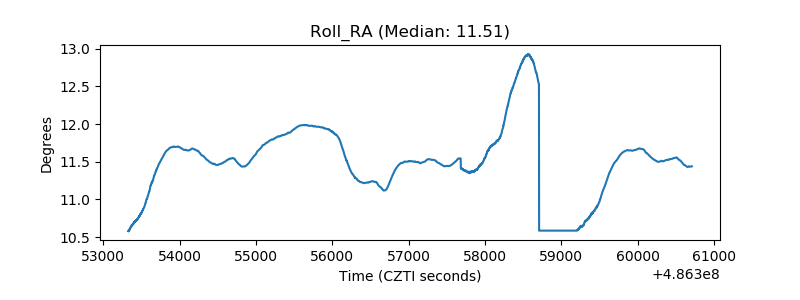 |
| Veto Counter | 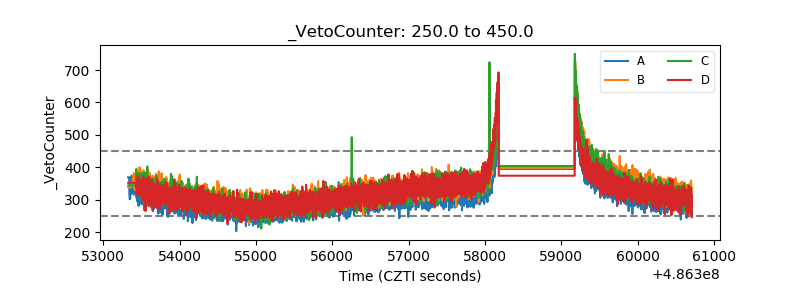 |