| Param | Original file | Final file |
|---|---|---|
| Filename | modeM0/AS1C09_011T05_9000006474_52321cztM0_level2.fits | modeM0/AS1C09_011T05_9000006474_52321cztM0_level2_quad_clean.evt |
| Size (bytes) | 730,088,640 | 87,549,120 |
| Size | 696.3 MB | 83.5 MB |
| Events in quadrant A | 3,402,573 | 634,254 |
| Events in quadrant B | 5,075,067 | 653,050 |
| Events in quadrant C | 7,387,691 | 502,022 |
| Events in quadrant D | 10,650,696 | 401,797 |
| Mode M0 | |||
|---|---|---|---|
| Quadrant | BADHDUFLAG | Total packets | Discarded packets |
| A | 0 | 14651 | 2 |
| B | 0 | 19825 | 2 |
| C | 0 | 26563 | 7 |
| D | 0 | 36228 | 2 |
| Mode SS | |||
|---|---|---|---|
| Quadrant | BADHDUFLAG | Total packets | Discarded packets |
| A | 0 | 136 | 0 |
| B | 0 | 136 | 0 |
| C | 0 | 136 | 0 |
| D | 0 | 136 | 0 |
| Mode M9 | |||
|---|---|---|---|
| Quadrant | BADHDUFLAG | Total packets | Discarded packets |
| A | 0 | 10 | 0 |
| B | 0 | 10 | 0 |
| C | 0 | 10 | 0 |
| D | 0 | 10 | 0 |
| Quadrant | Total seconds | Saturated seconds | Saturation percentage |
|---|---|---|---|
| A | 6581 | 117 | 1.777845% |
| B | 6582 | 404 | 6.137952% |
| C | 6581 | 1464 | 22.245859% |
| D | 6581 | 2328 | 35.374563% |
Noise dominated data is calculated using 1-second bins in cleaned event files. If a bin has >2000 counts, and if more than 50% of those come from <1% of pixels, then it is considered to be noise-dominated and hence unusable.
| Quadrant | # 1 sec bins | Bins with >0 counts | Bins with >2000 counts | High rate bins dominated by noise | Noise dominated (total time) | Noise dominated (detector-on time) | Marked lightcurve |
|---|---|---|---|---|---|---|---|
| A | 7646 | 6582 | 73 | 73 | 0.95% | 1.11% | 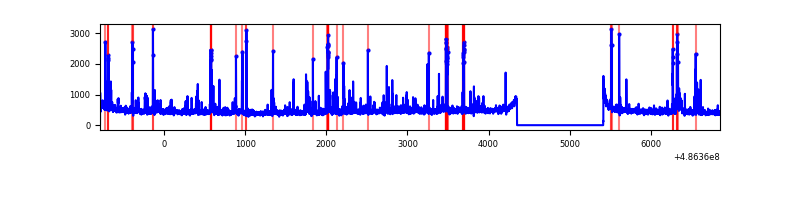 |
| B | 7647 | 6583 | 204 | 204 | 2.67% | 3.10% | 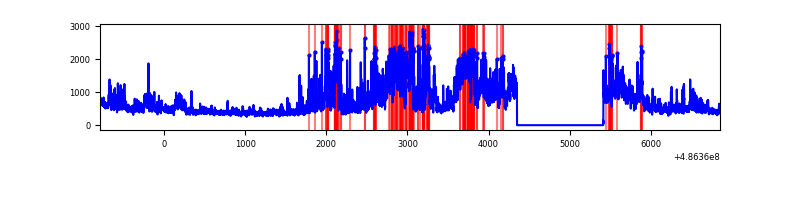 |
| C | 7646 | 6582 | 1378 | 1378 | 18.02% | 20.94% | 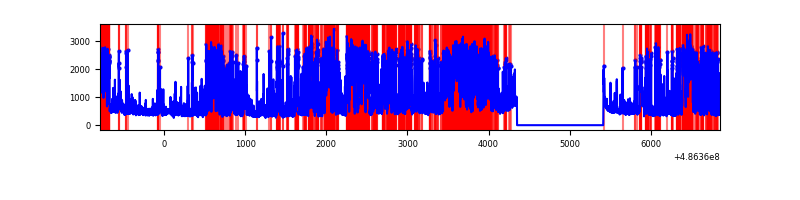 |
| D | 7646 | 6582 | 2464 | 2464 | 32.23% | 37.44% | 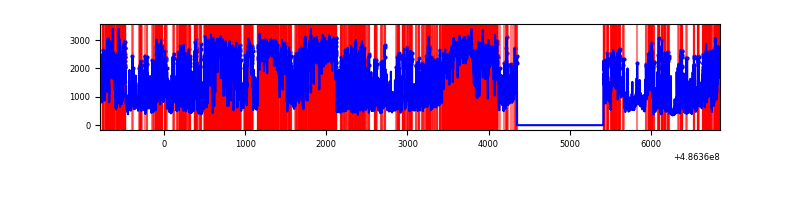 |
Top three noisy pixels from each quadrant. If the there are fewer than three noisy pixels in the level2.evt file, extra rows are filled as -1
| Pixel properties | Quadrant properties | ||||||
|---|---|---|---|---|---|---|---|
| Quadrant | DetID | PixID | Counts | Sigma | Mean | Median | Sigma |
| A | 11 | 3 | 171182 | 990.15 | 689 | 671 | 172.2 |
| A | 4 | 3 | 139707 | 807.37 | 689 | 671 | 172.2 |
| A | 5 | 240 | 82247 | 473.71 | 689 | 671 | 172.2 |
| B | 7 | 0 | 1050647 | 7300.31 | 674 | 653 | 143.8 |
| B | 4 | 171 | 385777 | 2677.66 | 674 | 653 | 143.8 |
| B | 10 | 254 | 249109 | 1727.44 | 674 | 653 | 143.8 |
| C | 15 | 224 | 2970449 | 17598.98 | 601 | 595 | 168.8 |
| C | 9 | 38 | 652328 | 3862.09 | 601 | 595 | 168.8 |
| C | 13 | 3 | 538055 | 3184.92 | 601 | 595 | 168.8 |
| D | 12 | 17 | 2534836 | 15549.32 | 560 | 534 | 163.0 |
| D | 12 | 6 | 1843448 | 11307.28 | 560 | 534 | 163.0 |
| D | 15 | 93 | 1199431 | 7355.89 | 560 | 534 | 163.0 |
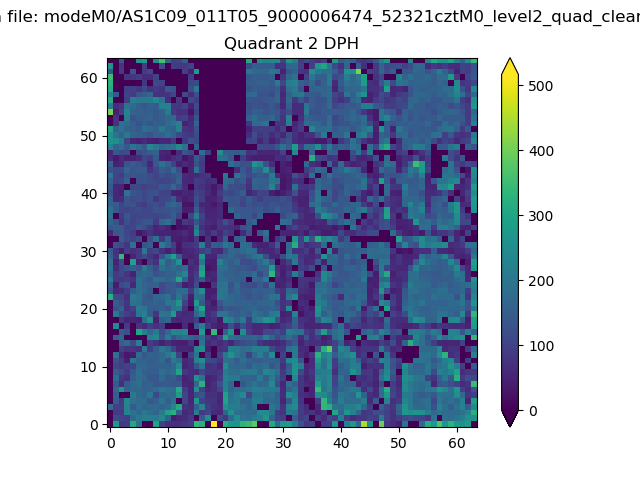
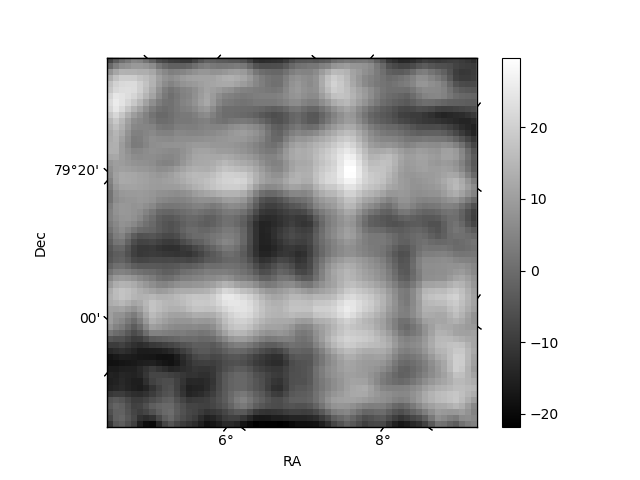
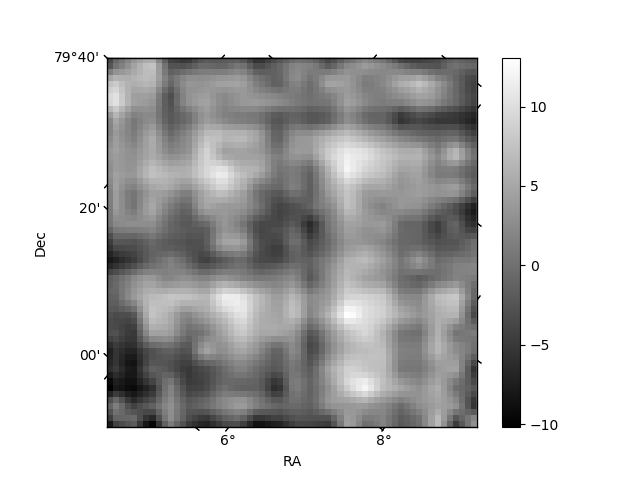
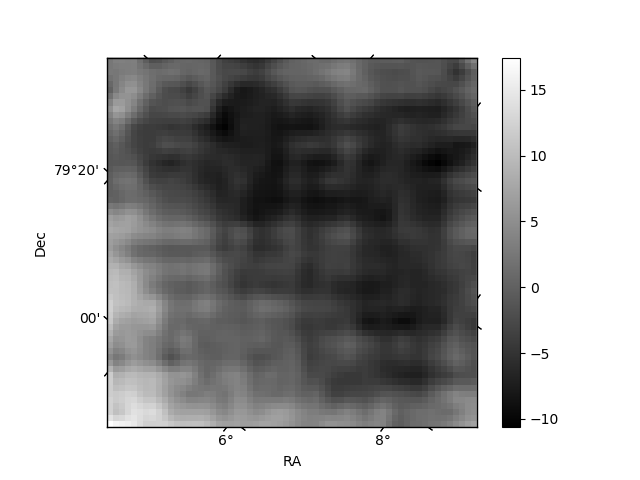
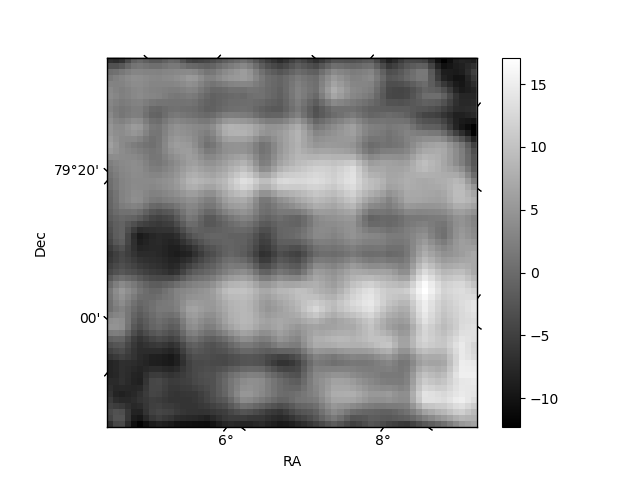
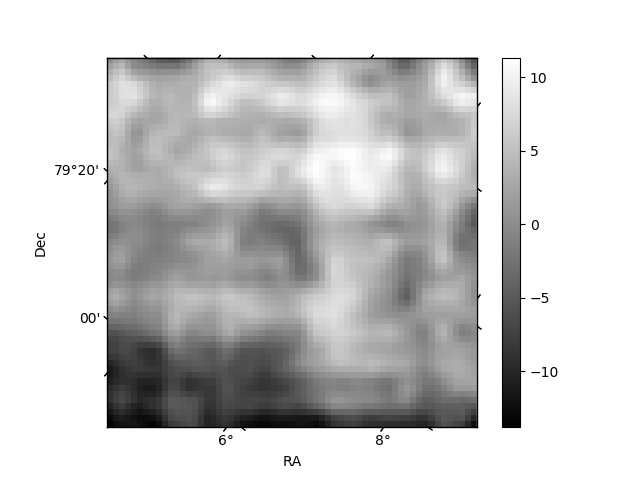
Histogram calculated using DETX and DETY for each event in the final _common_clean file
| Quadrant A | 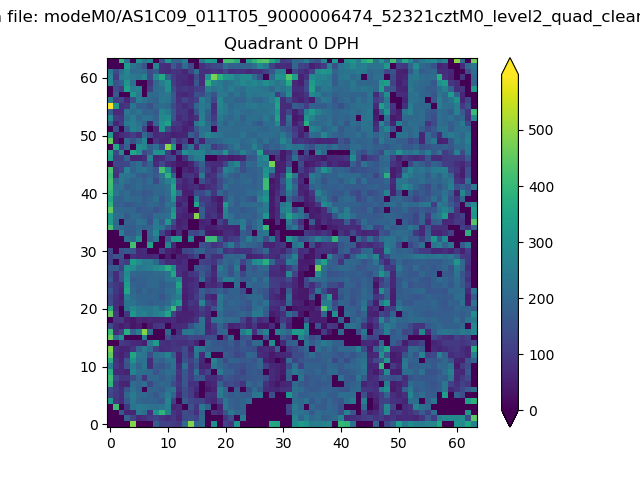 |
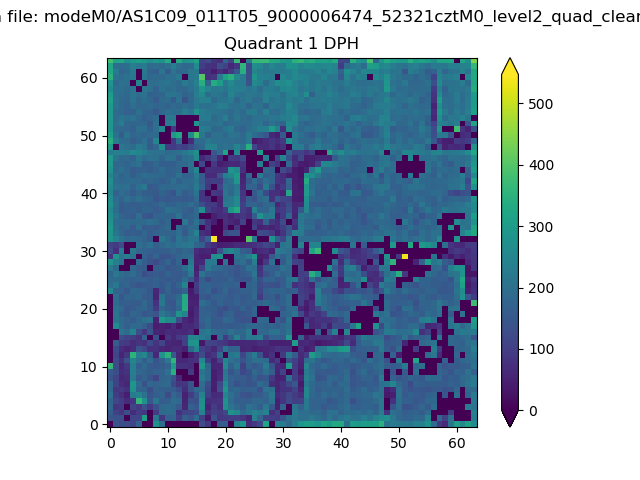 |
Quadrant B |
|---|---|---|---|
| Quadrant D | 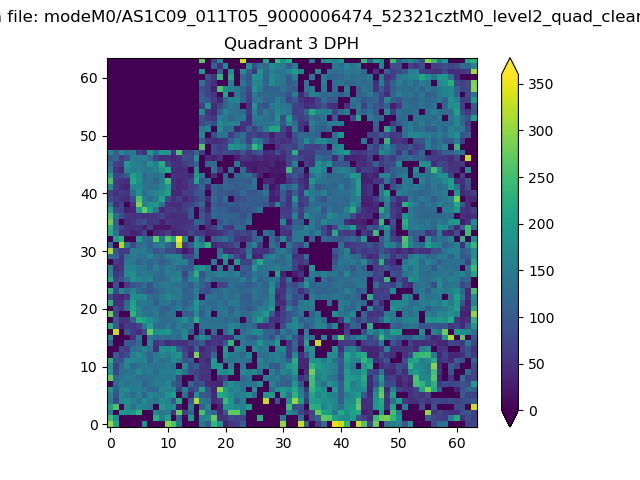 |
 |
Quadrant C |
| Plot type | Count rate plots | Images |
|---|---|---|
| Comparison with Poisson distribution Blue bars denote a histogram of data divided into 1 sec bins. Red curve is a Poisson curve with rate = median count rate of data. |
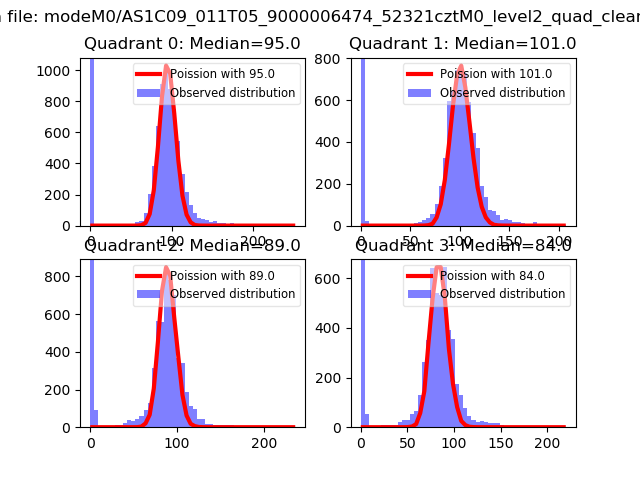 |
 |
| Quadrant-wise count rates Data is divided into 100 sec bins |
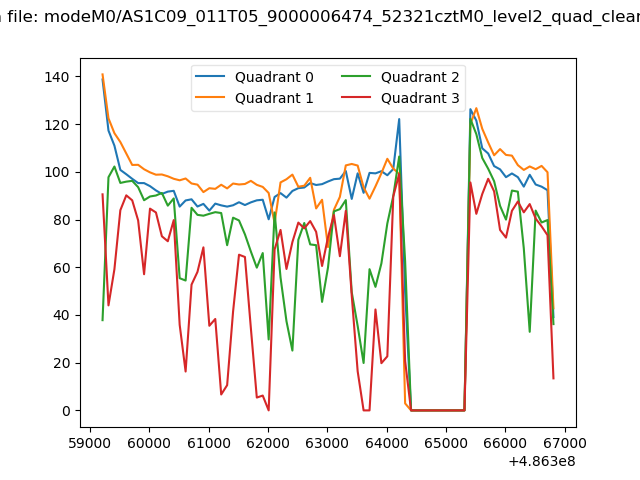 |
|
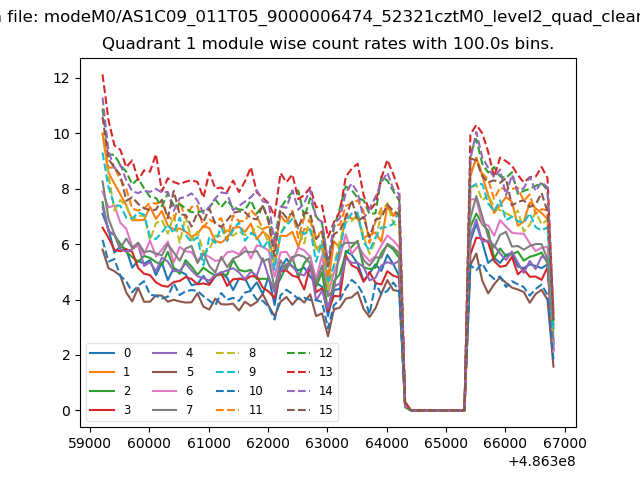
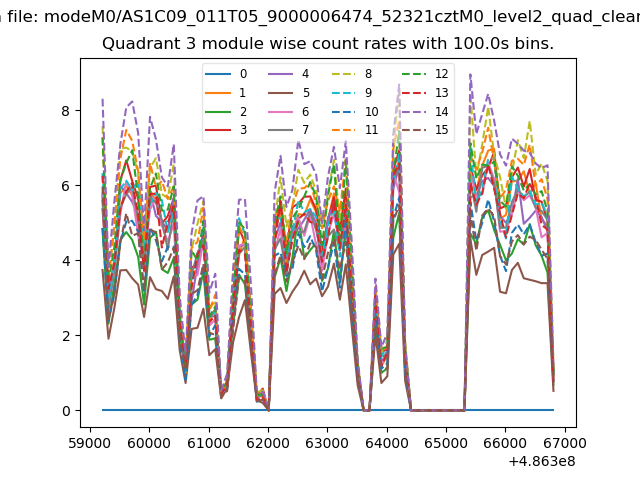
| Module-wise count rates for Quadrant A Data is divided into 100 sec bins |
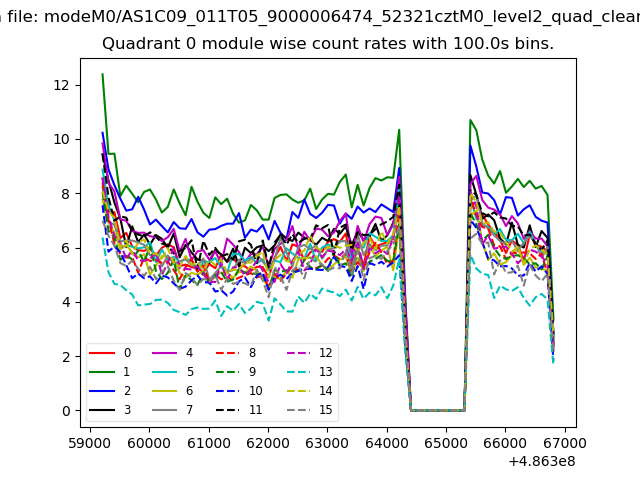 |
 |
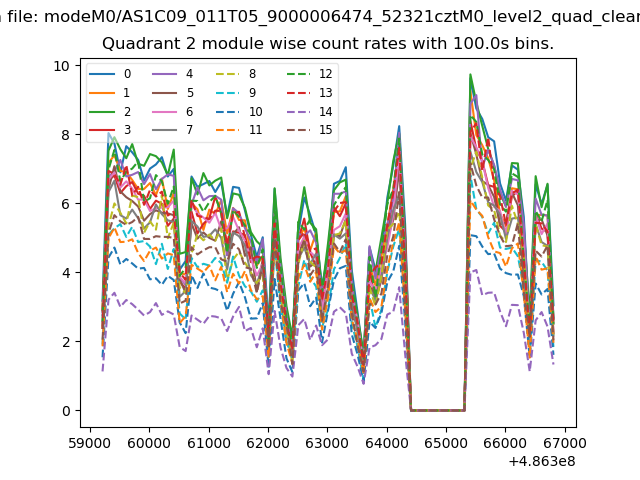
| Module-wise count rates for Quadrant B Data is divided into 100 sec bins |
 |
 |
| Module-wise count rates for Quadrant C Data is divided into 100 sec bins |
 |
 |
| Module-wise count rates for Quadrant D Data is divided into 100 sec bins |
 |
 |
| Parameter | Plot |
|---|---|
| CZT HV Monitor | 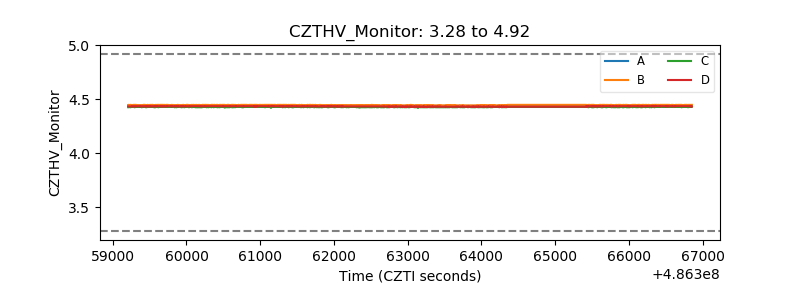 |
| D_VDD | 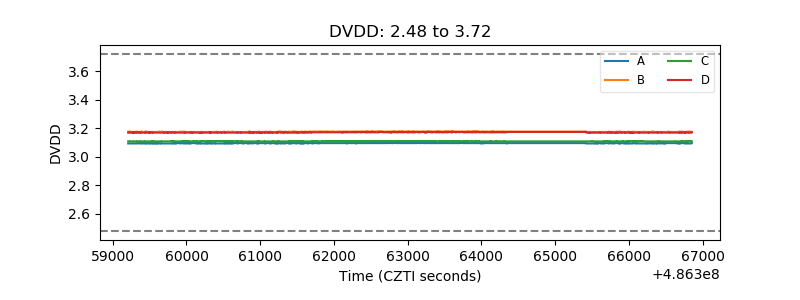 |
| Temperature 1 | 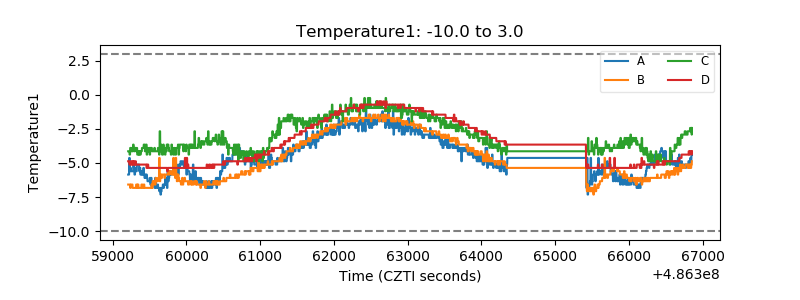 |
| Veto HV Monitor | 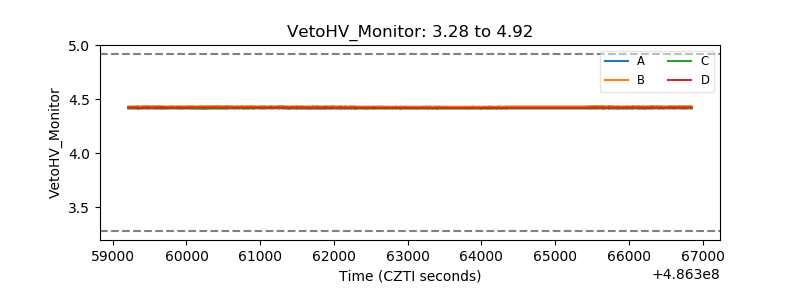 |
| Veto LLD | 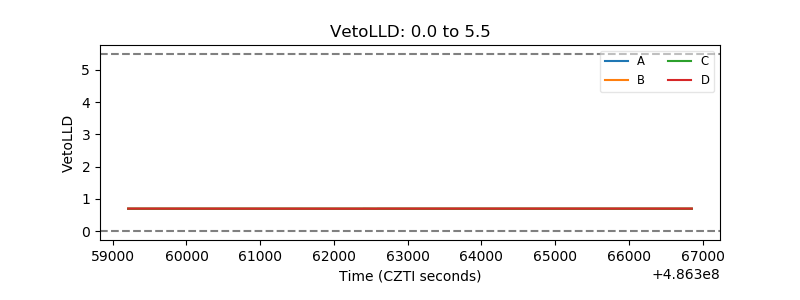 |
| Alpha Counter | 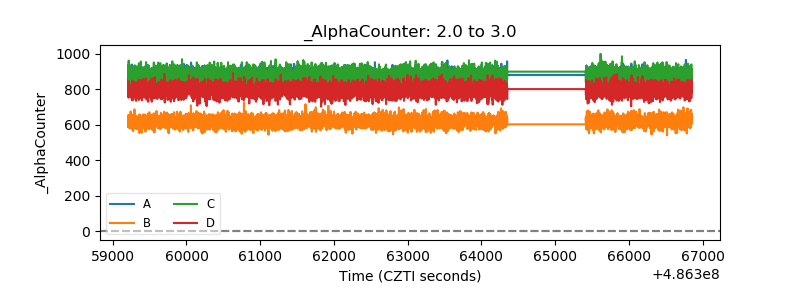 |
| _CPM_Rate | 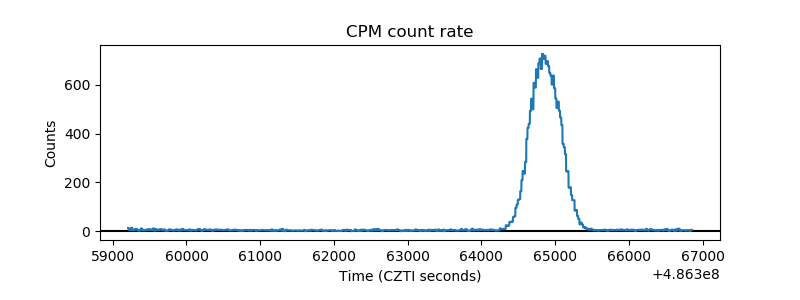 |
| CZT Counter | 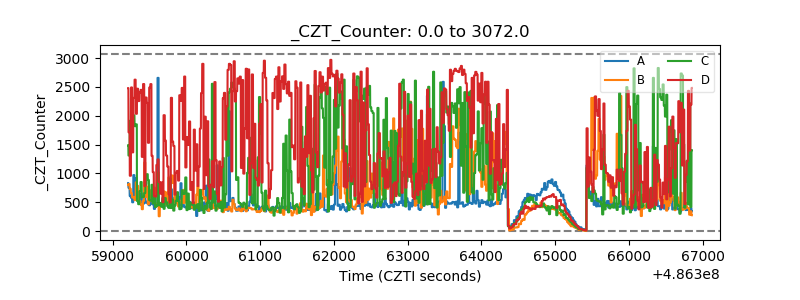 |
| +2.5 Volts monitor |  |
| +5 Volts monitor |  |
| _ROLL_ROT | 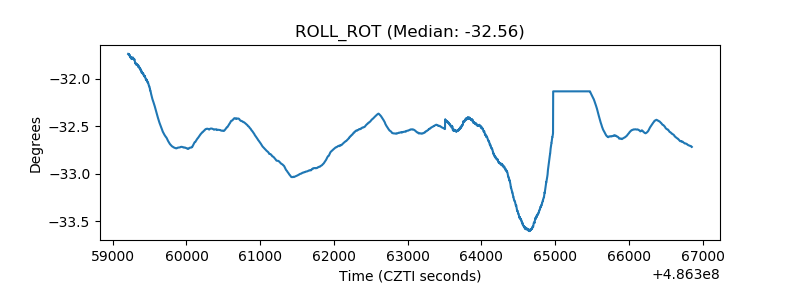 |
| _Roll_DEC | 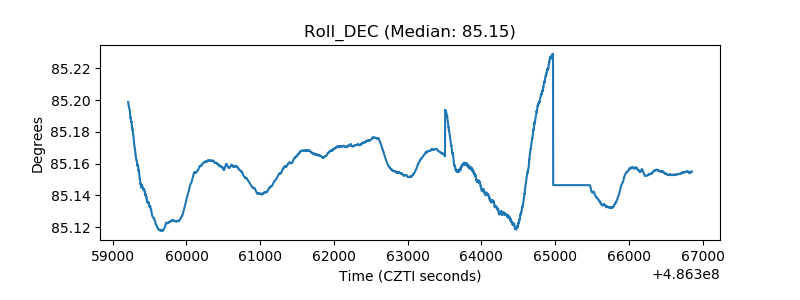 |
| _Roll_RA | 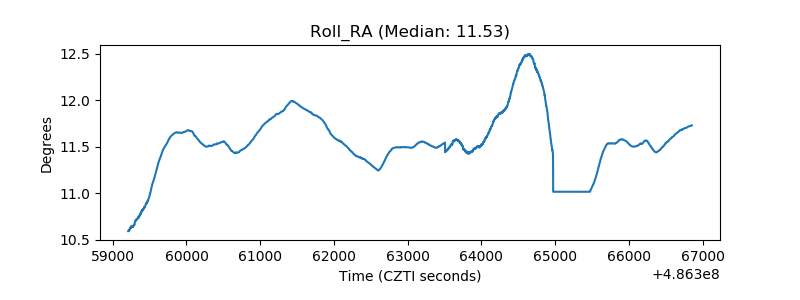 |
| Veto Counter | 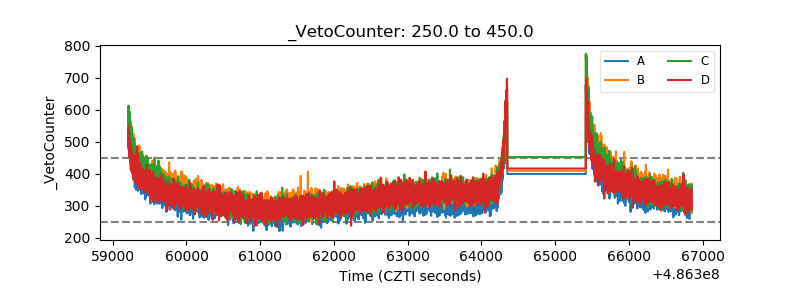 |