| Param | Original file | Final file |
|---|---|---|
| Filename | modeM0/AS1C09_011T05_9000006474_52323cztM0_level2.fits | modeM0/AS1C09_011T05_9000006474_52323cztM0_level2_quad_clean.evt |
| Size (bytes) | 418,728,960 | 55,324,800 |
| Size | 399.3 MB | 52.8 MB |
| Events in quadrant A | 2,222,272 | 393,347 |
| Events in quadrant B | 2,646,286 | 415,845 |
| Events in quadrant C | 5,622,887 | 274,269 |
| Events in quadrant D | 4,689,008 | 301,635 |
| Mode M0 | |||
|---|---|---|---|
| Quadrant | BADHDUFLAG | Total packets | Discarded packets |
| A | 0 | 9816 | 360 |
| B | 0 | 11102 | 337 |
| C | 0 | 20277 | 739 |
| D | 0 | 17383 | 582 |
| Mode SS | |||
|---|---|---|---|
| Quadrant | BADHDUFLAG | Total packets | Discarded packets |
| A | 0 | 86 | 2 |
| B | 0 | 86 | 0 |
| C | 0 | 86 | 2 |
| D | 0 | 86 | 2 |
| Quadrant | Total seconds | Saturated seconds | Saturation percentage |
|---|---|---|---|
| A | 4119 | 81 | 1.966497% |
| B | 4113 | 153 | 3.719912% |
| C | 4094 | 1311 | 32.022472% |
| D | 4097 | 662 | 16.158165% |
Noise dominated data is calculated using 1-second bins in cleaned event files. If a bin has >2000 counts, and if more than 50% of those come from <1% of pixels, then it is considered to be noise-dominated and hence unusable.
| Quadrant | # 1 sec bins | Bins with >0 counts | Bins with >2000 counts | High rate bins dominated by noise | Noise dominated (total time) | Noise dominated (detector-on time) | Marked lightcurve |
|---|---|---|---|---|---|---|---|
| A | 6934 | 4142 | 76 | 76 | 1.10% | 1.83% | 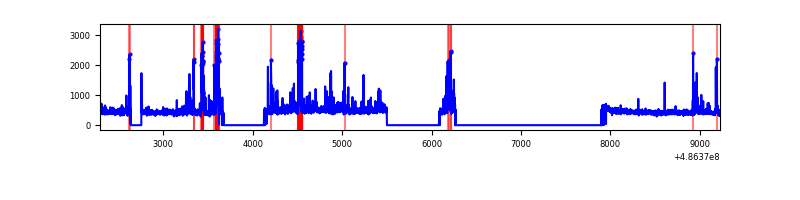 |
| B | 6934 | 4138 | 113 | 113 | 1.63% | 2.73% | 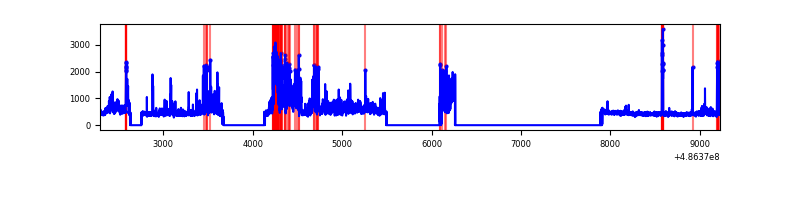 |
| C | 6934 | 4120 | 1217 | 1217 | 17.55% | 29.54% | 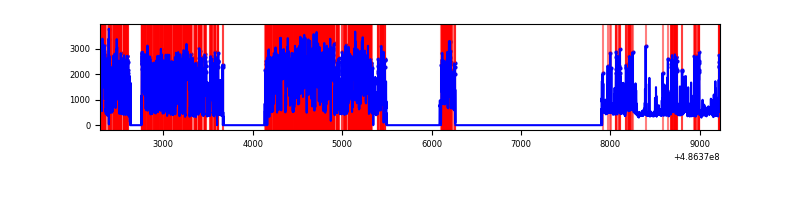 |
| D | 6934 | 4123 | 667 | 667 | 9.62% | 16.18% | 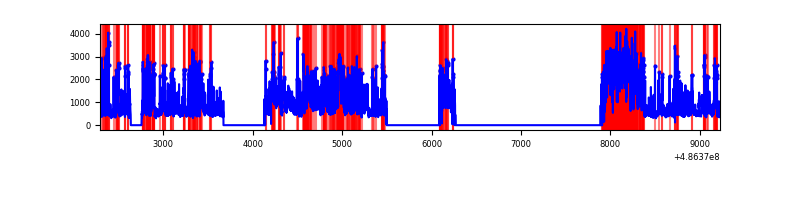 |
Top three noisy pixels from each quadrant. If the there are fewer than three noisy pixels in the level2.evt file, extra rows are filled as -1
| Pixel properties | Quadrant properties | ||||||
|---|---|---|---|---|---|---|---|
| Quadrant | DetID | PixID | Counts | Sigma | Mean | Median | Sigma |
| A | 15 | 239 | 95000 | 904.56 | 423 | 414 | 104.6 |
| A | 11 | 3 | 86088 | 819.33 | 423 | 414 | 104.6 |
| A | 7 | 206 | 76413 | 726.81 | 423 | 414 | 104.6 |
| B | 4 | 171 | 499899 | 5679.54 | 412 | 398 | 87.9 |
| B | 0 | 216 | 222773 | 2528.5 | 412 | 398 | 87.9 |
| B | 0 | 213 | 59120 | 667.69 | 412 | 398 | 87.9 |
| C | 15 | 224 | 3180703 | 33299.97 | 341 | 338 | 95.5 |
| C | 9 | 38 | 402774 | 4213.7 | 341 | 338 | 95.5 |
| C | 15 | 178 | 263037 | 2750.59 | 341 | 338 | 95.5 |
| D | 12 | 2 | 1050229 | 9844.62 | 370 | 352 | 106.6 |
| D | 12 | 17 | 728514 | 6827.92 | 370 | 352 | 106.6 |
| D | 2 | 62 | 275087 | 2576.17 | 370 | 352 | 106.6 |
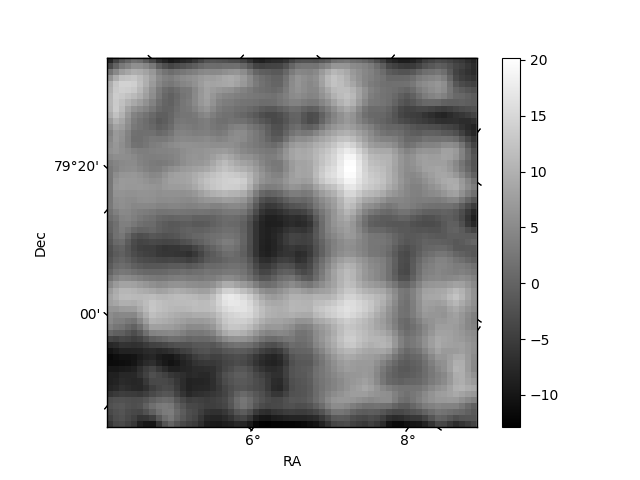
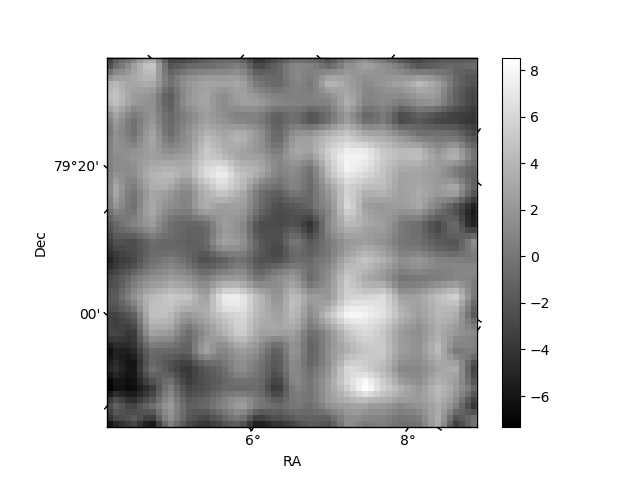
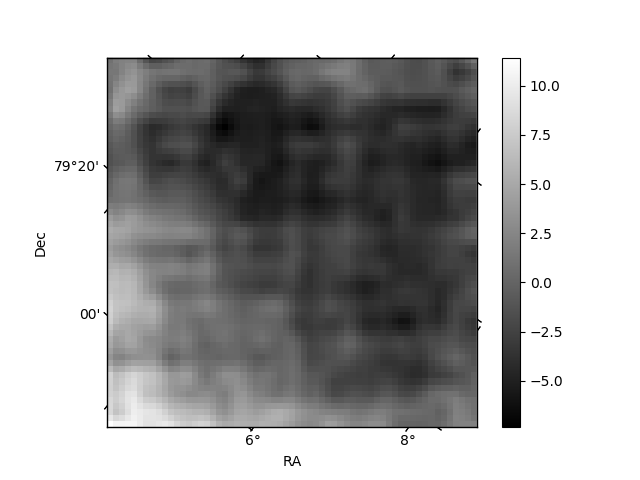
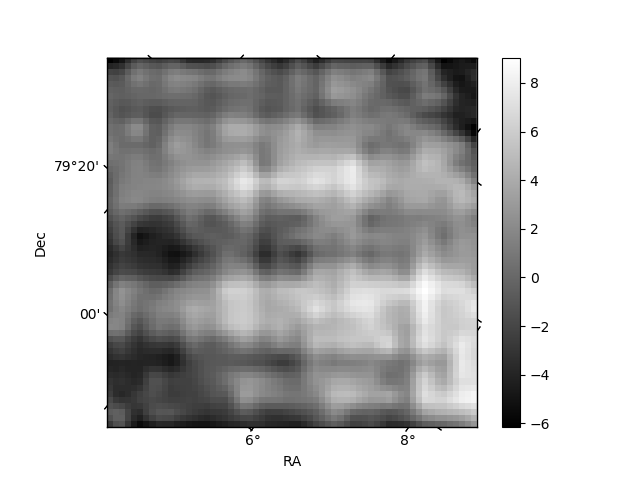
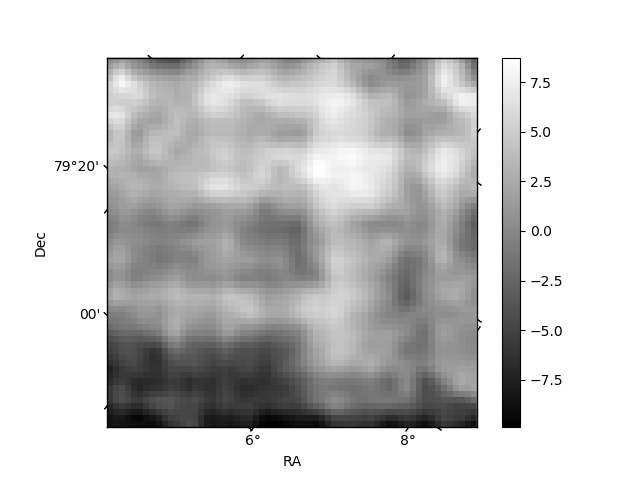
Histogram calculated using DETX and DETY for each event in the final _common_clean file
| Quadrant A | 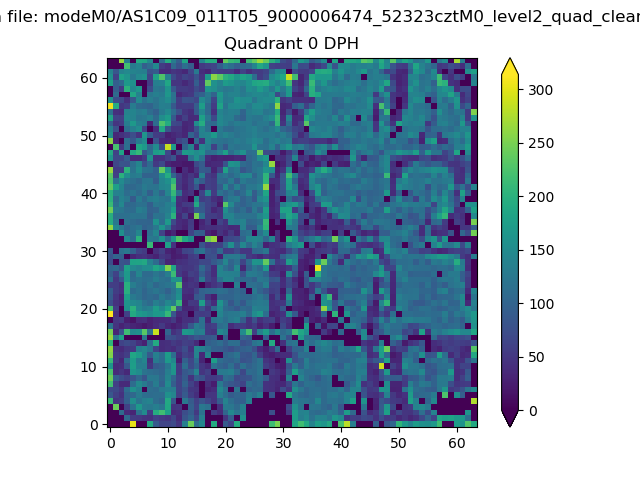 |
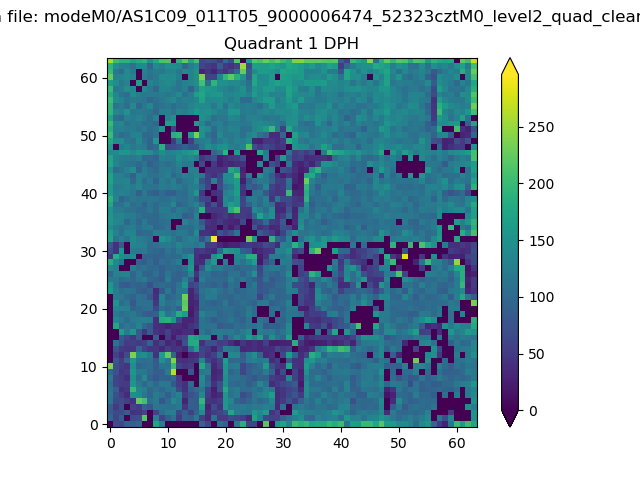 |
Quadrant B |
|---|---|---|---|
| Quadrant D | 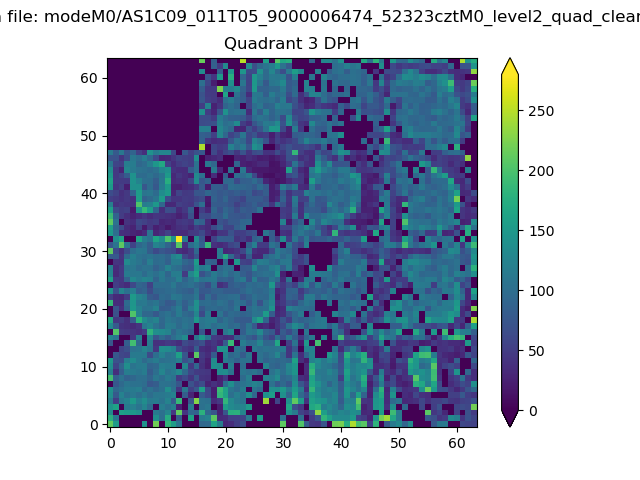 |
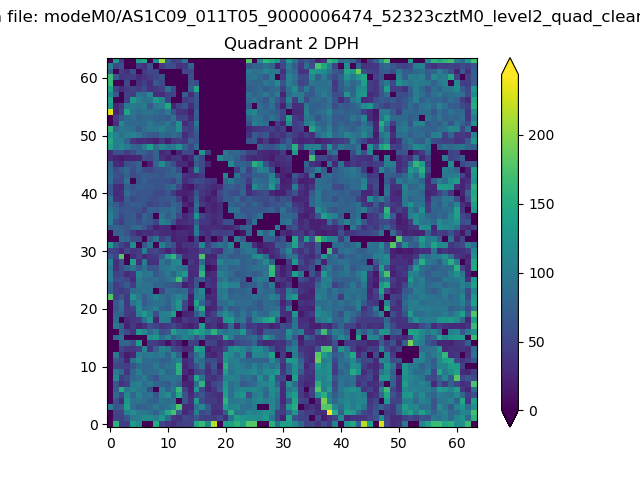 |
Quadrant C |
| Plot type | Count rate plots | Images |
|---|---|---|
| Comparison with Poisson distribution Blue bars denote a histogram of data divided into 1 sec bins. Red curve is a Poisson curve with rate = median count rate of data. |
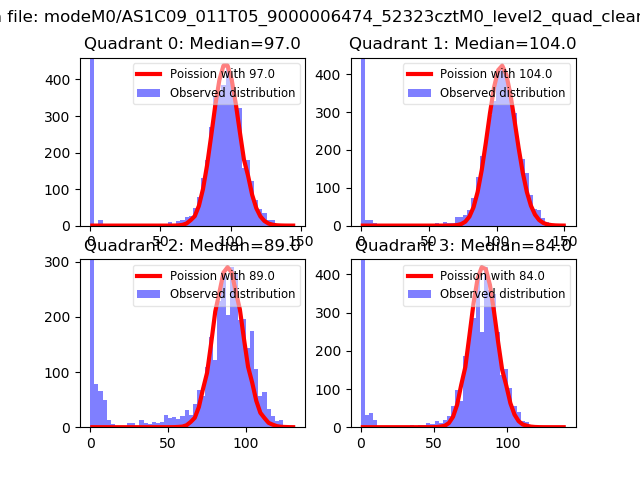 |
 |
| Quadrant-wise count rates Data is divided into 100 sec bins |
 |
|
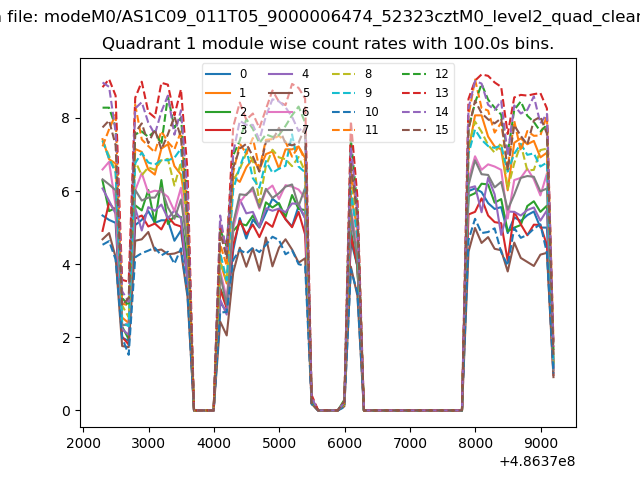
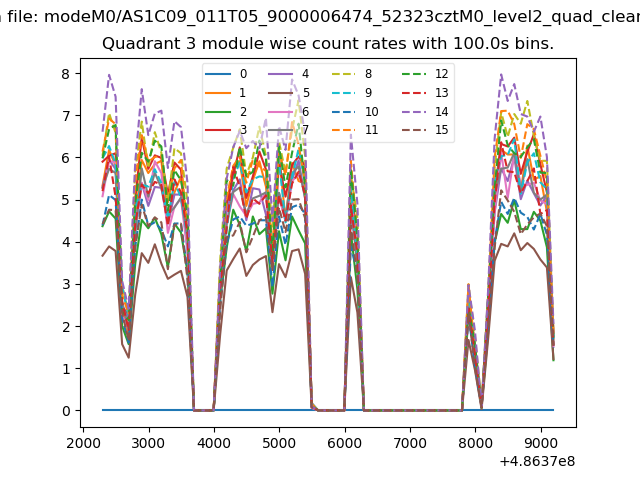
| Module-wise count rates for Quadrant A Data is divided into 100 sec bins |
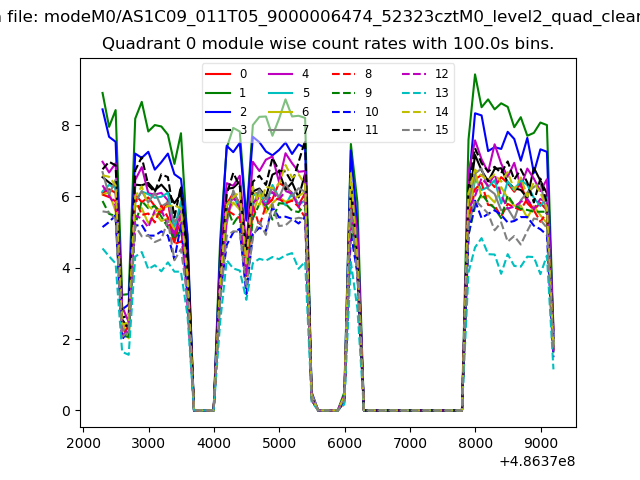 |
 |
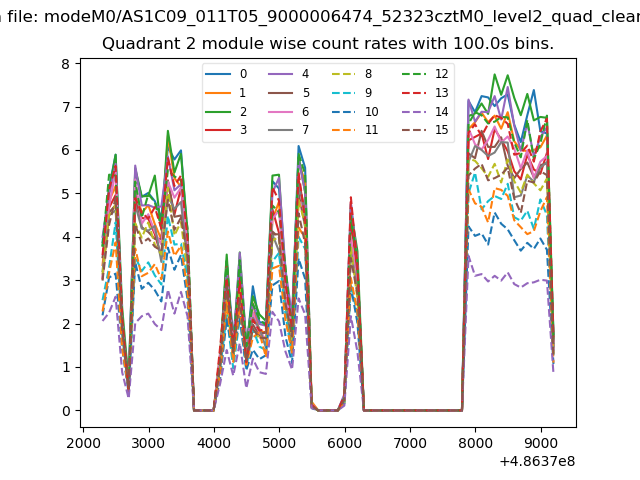
| Module-wise count rates for Quadrant B Data is divided into 100 sec bins |
 |
 |
| Module-wise count rates for Quadrant C Data is divided into 100 sec bins |
 |
 |
| Module-wise count rates for Quadrant D Data is divided into 100 sec bins |
 |
 |
| Parameter | Plot |
|---|---|
| CZT HV Monitor | 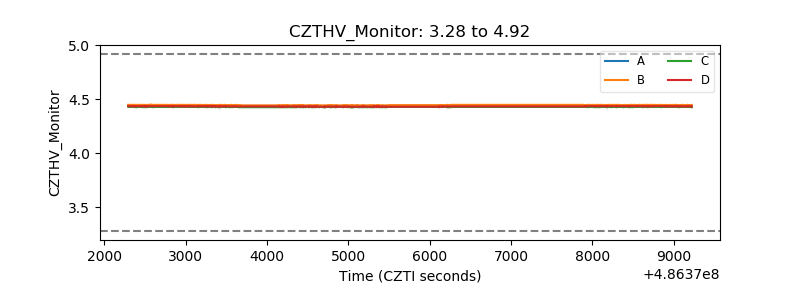 |
| D_VDD | 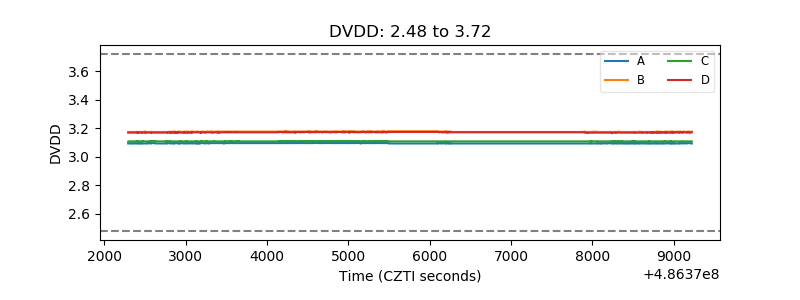 |
| Temperature 1 | 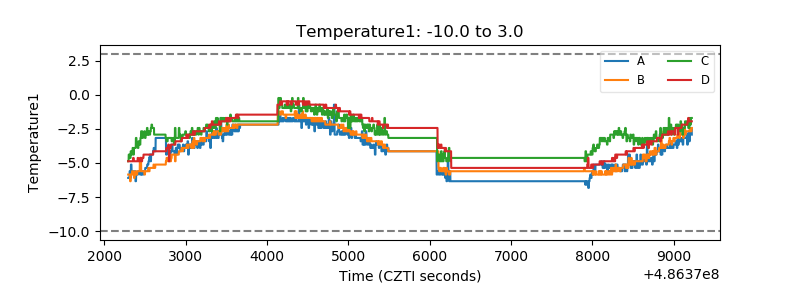 |
| Veto HV Monitor | 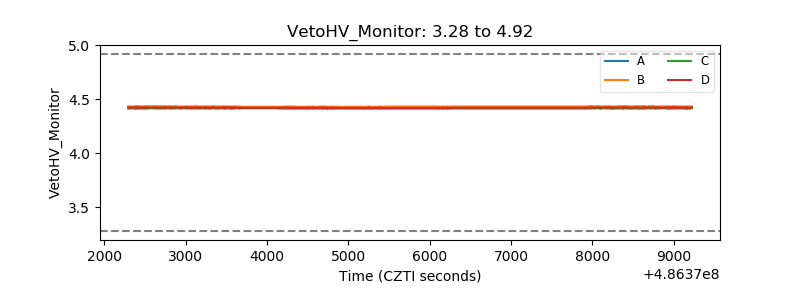 |
| Veto LLD | 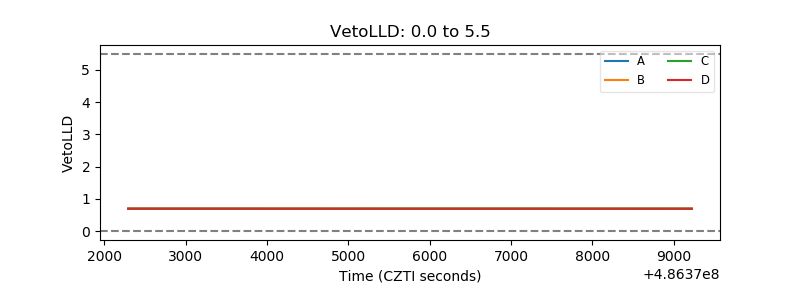 |
| Alpha Counter | 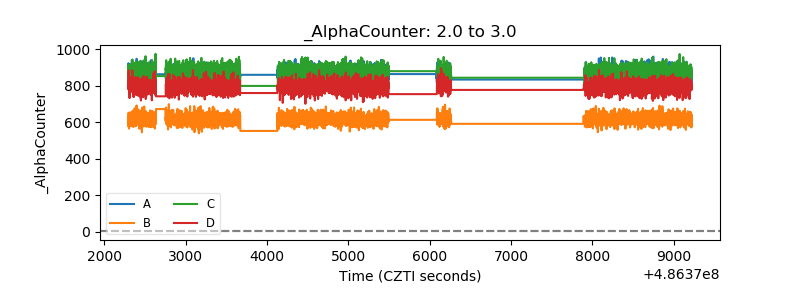 |
| _CPM_Rate | 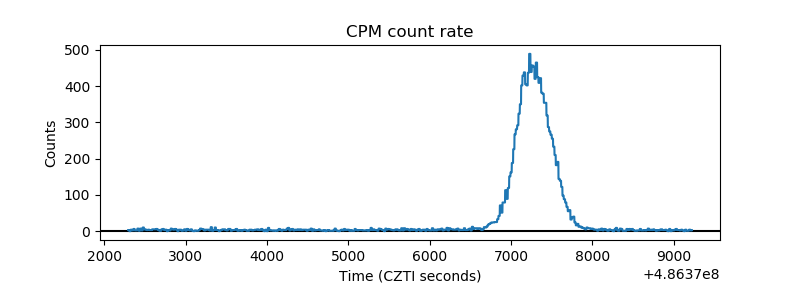 |
| CZT Counter | 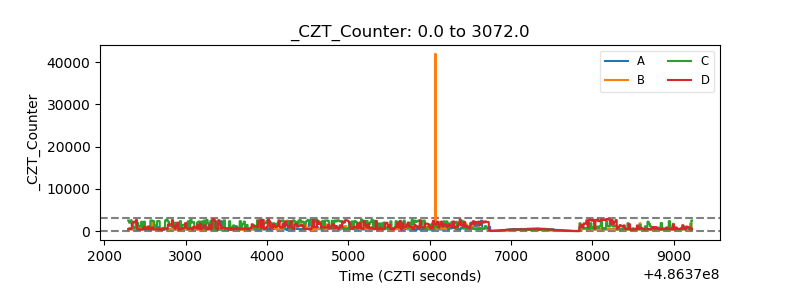 |
| +2.5 Volts monitor | 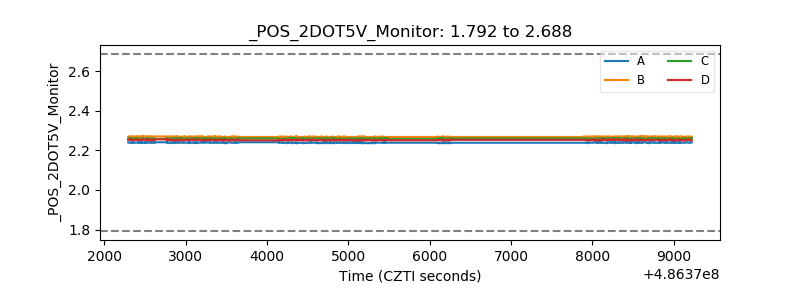 |
| +5 Volts monitor | 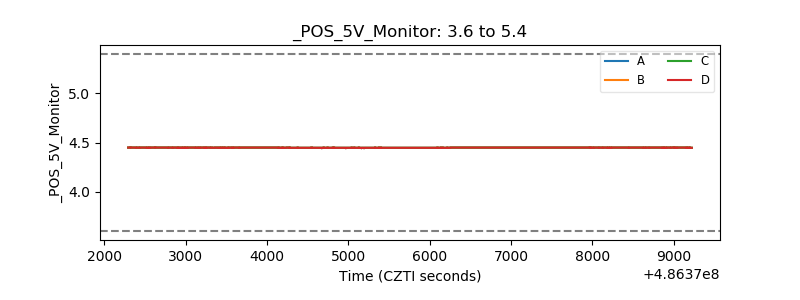 |
| _ROLL_ROT | 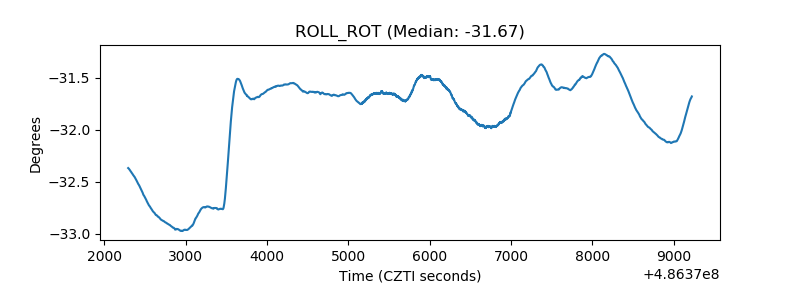 |
| _Roll_DEC | 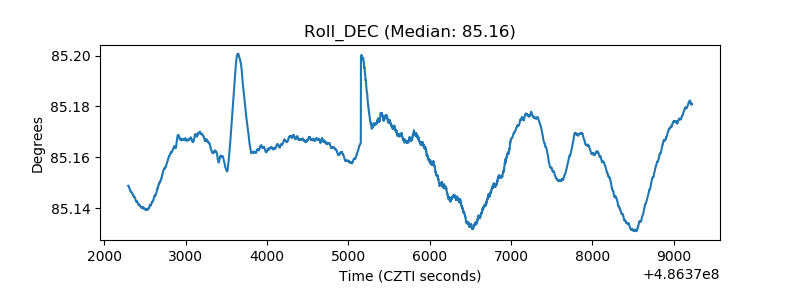 |
| _Roll_RA | 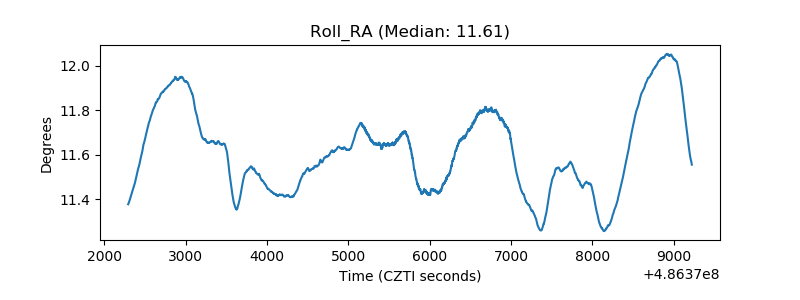 |
| Veto Counter | 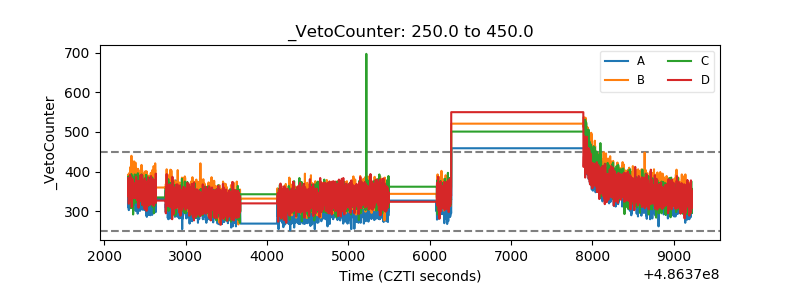 |