| Param | Original file | Final file |
|---|---|---|
| Filename | modeM0/AS1C09_011T05_9000006474_52326cztM0_level2.fits | modeM0/AS1C09_011T05_9000006474_52326cztM0_level2_quad_clean.evt |
| Size (bytes) | 884,684,160 | 83,594,880 |
| Size | 843.7 MB | 79.7 MB |
| Events in quadrant A | 3,829,315 | 642,141 |
| Events in quadrant B | 11,986,835 | 423,382 |
| Events in quadrant C | 8,785,355 | 469,571 |
| Events in quadrant D | 7,611,692 | 513,264 |
| Mode M0 | |||
|---|---|---|---|
| Quadrant | BADHDUFLAG | Total packets | Discarded packets |
| A | 0 | 16326 | 50 |
| B | 0 | 40472 | 91 |
| C | 0 | 30961 | 72 |
| D | 0 | 27462 | 71 |
| Mode SS | |||
|---|---|---|---|
| Quadrant | BADHDUFLAG | Total packets | Discarded packets |
| A | 0 | 140 | 0 |
| B | 0 | 140 | 0 |
| C | 0 | 140 | 0 |
| D | 0 | 140 | 0 |
| Mode M9 | |||
|---|---|---|---|
| Quadrant | BADHDUFLAG | Total packets | Discarded packets |
| A | 0 | 3 | 0 |
| B | 0 | 3 | 0 |
| C | 0 | 3 | 0 |
| D | 0 | 3 | 0 |
| Quadrant | Total seconds | Saturated seconds | Saturation percentage |
|---|---|---|---|
| A | 6927 | 219 | 3.161542% |
| B | 6917 | 3211 | 46.421859% |
| C | 6919 | 1977 | 28.573493% |
| D | 6921 | 1103 | 15.937003% |
Noise dominated data is calculated using 1-second bins in cleaned event files. If a bin has >2000 counts, and if more than 50% of those come from <1% of pixels, then it is considered to be noise-dominated and hence unusable.
| Quadrant | # 1 sec bins | Bins with >0 counts | Bins with >2000 counts | High rate bins dominated by noise | Noise dominated (total time) | Noise dominated (detector-on time) | Marked lightcurve |
|---|---|---|---|---|---|---|---|
| A | 7223 | 6936 | 104 | 104 | 1.44% | 1.50% | 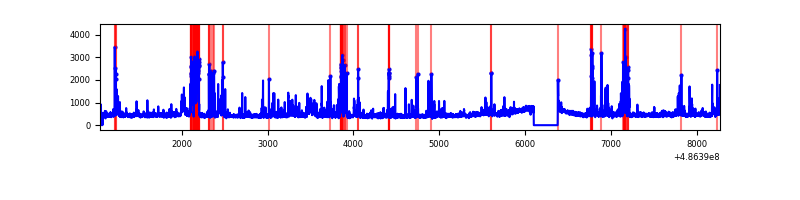 |
| B | 7210 | 6926 | 2715 | 2715 | 37.66% | 39.20% | 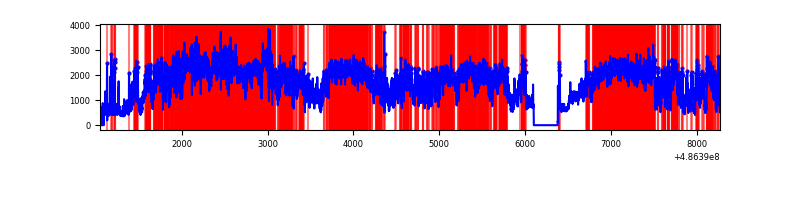 |
| C | 7225 | 6928 | 1555 | 1555 | 21.52% | 22.45% | 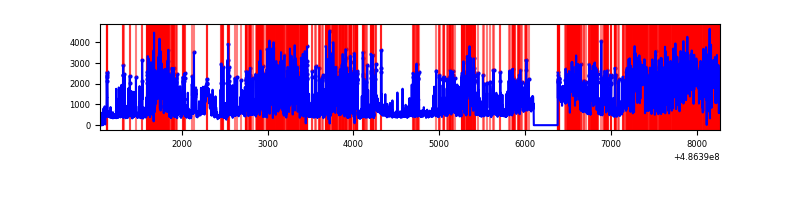 |
| D | 7219 | 6929 | 858 | 858 | 11.89% | 12.38% | 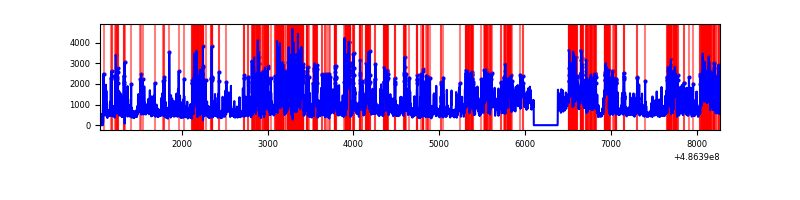 |
Top three noisy pixels from each quadrant. If the there are fewer than three noisy pixels in the level2.evt file, extra rows are filled as -1
| Pixel properties | Quadrant properties | ||||||
|---|---|---|---|---|---|---|---|
| Quadrant | DetID | PixID | Counts | Sigma | Mean | Median | Sigma |
| A | 15 | 239 | 176141 | 977.32 | 726 | 710 | 179.5 |
| A | 5 | 240 | 175335 | 972.83 | 726 | 710 | 179.5 |
| A | 7 | 206 | 149992 | 831.65 | 726 | 710 | 179.5 |
| B | 10 | 254 | 4516960 | 34102.21 | 627 | 605 | 132.4 |
| B | 7 | 0 | 3296757 | 24888.67 | 627 | 605 | 132.4 |
| B | 12 | 32 | 609499 | 4597.65 | 627 | 605 | 132.4 |
| C | 15 | 224 | 3246543 | 19016.48 | 621 | 613 | 170.7 |
| C | 12 | 254 | 1134603 | 6643.55 | 621 | 613 | 170.7 |
| C | 9 | 38 | 544137 | 3184.27 | 621 | 613 | 170.7 |
| D | 12 | 2 | 1065437 | 5650.19 | 667 | 636 | 188.5 |
| D | 12 | 17 | 902304 | 4784.55 | 667 | 636 | 188.5 |
| D | 8 | 176 | 734710 | 3895.24 | 667 | 636 | 188.5 |
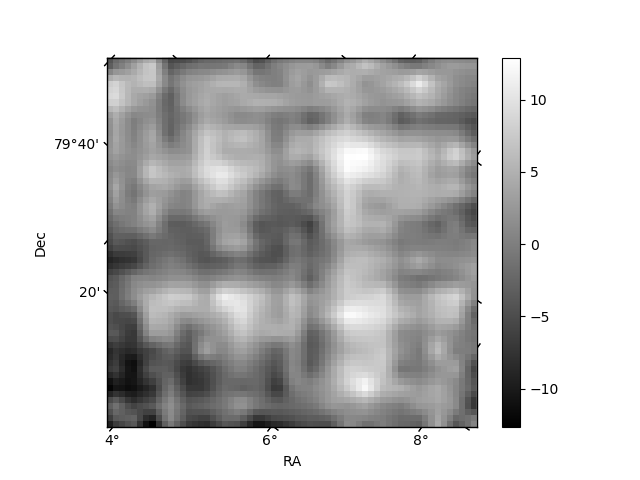
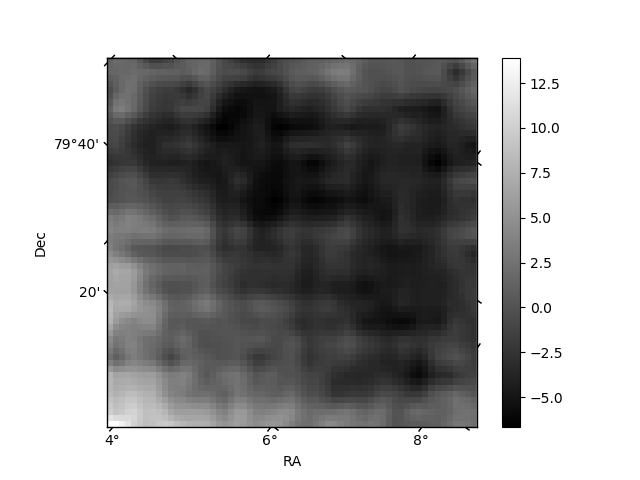
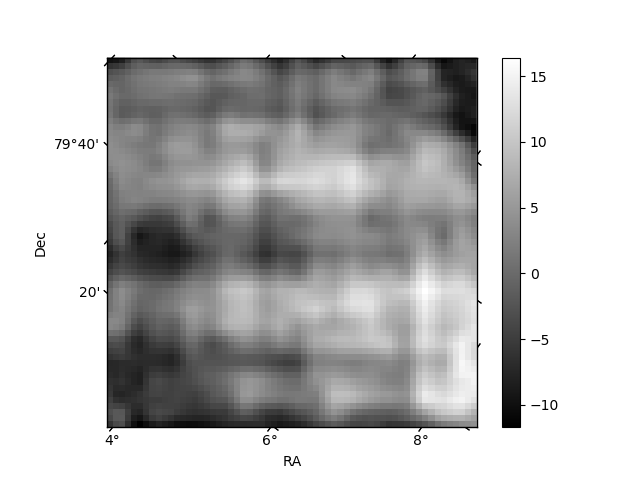
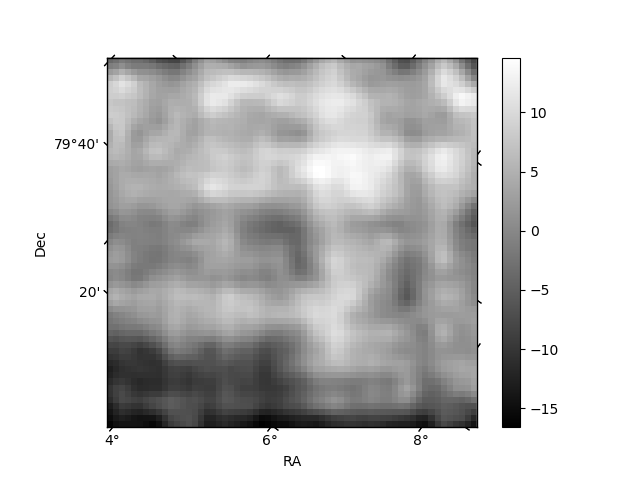
Histogram calculated using DETX and DETY for each event in the final _common_clean file
| Quadrant A | 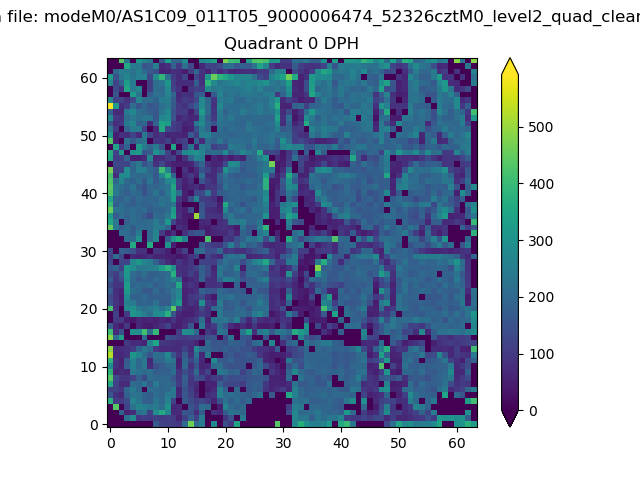 |
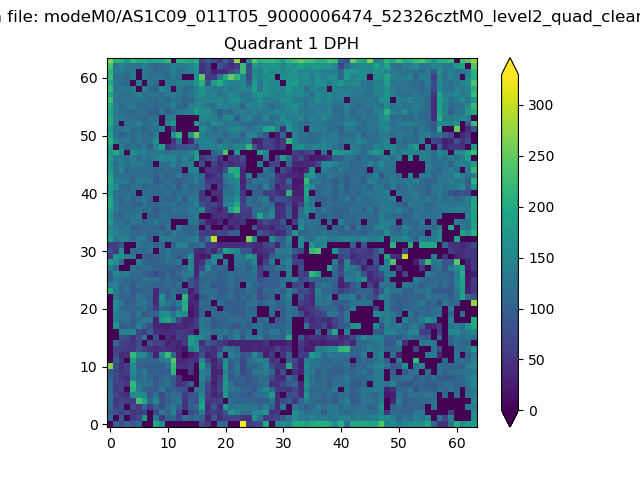 |
Quadrant B |
|---|---|---|---|
| Quadrant D | 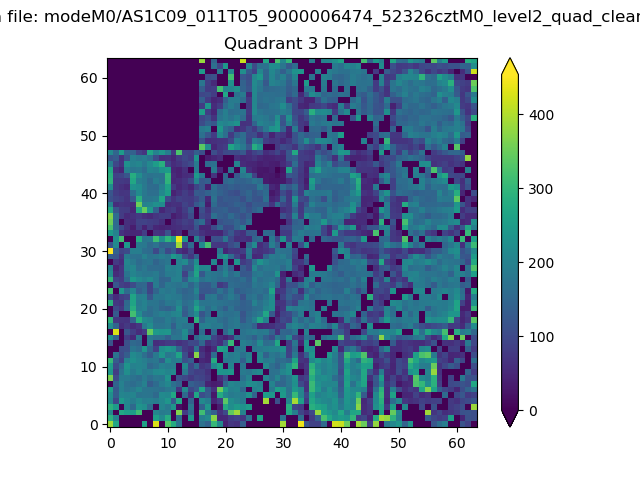 |
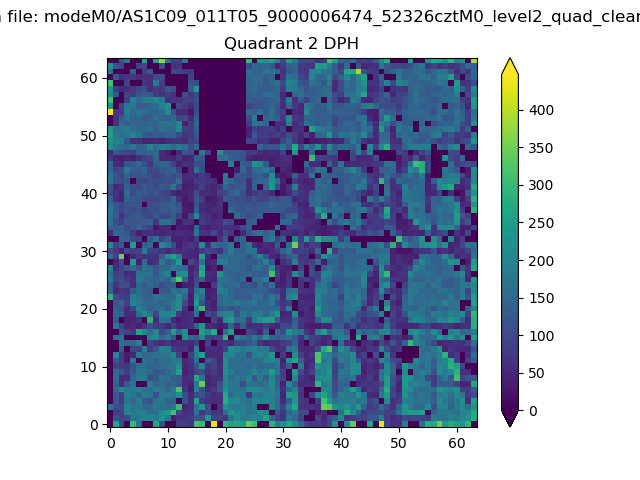 |
Quadrant C |
| Plot type | Count rate plots | Images |
|---|---|---|
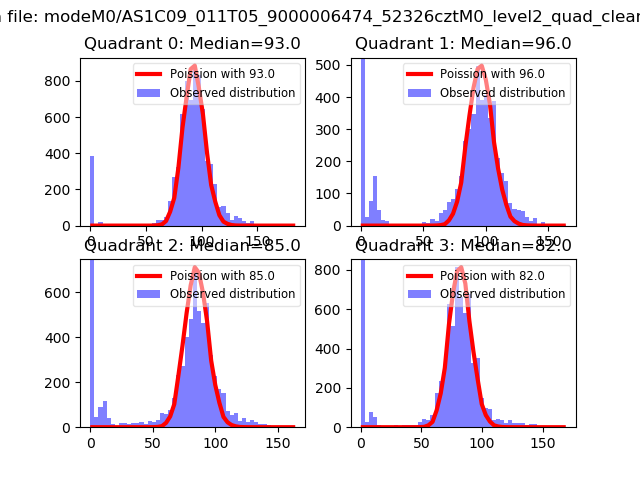
| Comparison with Poisson distribution Blue bars denote a histogram of data divided into 1 sec bins. Red curve is a Poisson curve with rate = median count rate of data. |
 |
 |
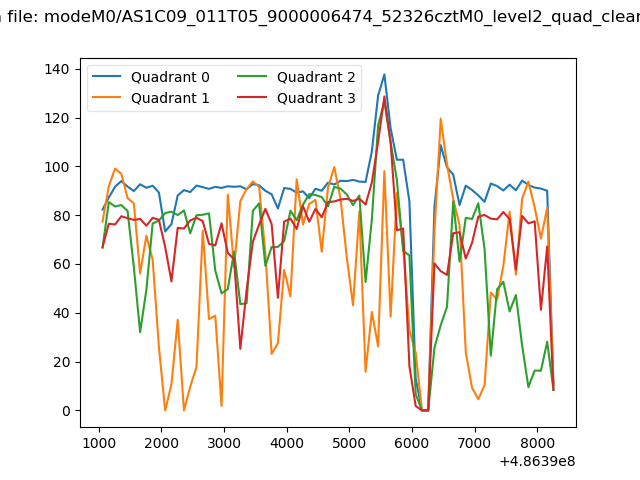
| Quadrant-wise count rates Data is divided into 100 sec bins |
 |
|
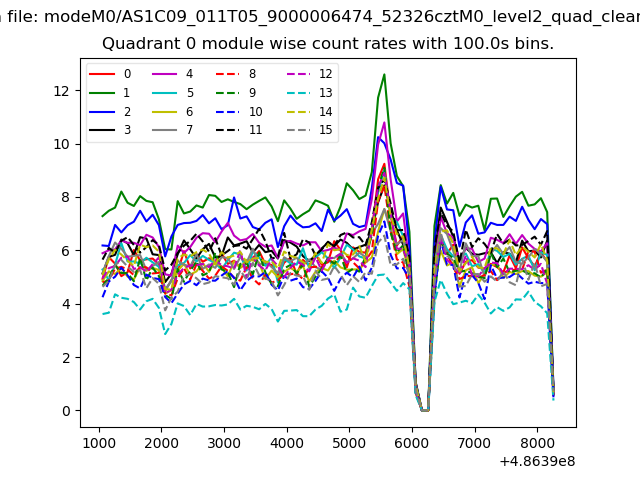
| Module-wise count rates for Quadrant A Data is divided into 100 sec bins |
 |
 |
| Module-wise count rates for Quadrant B Data is divided into 100 sec bins |
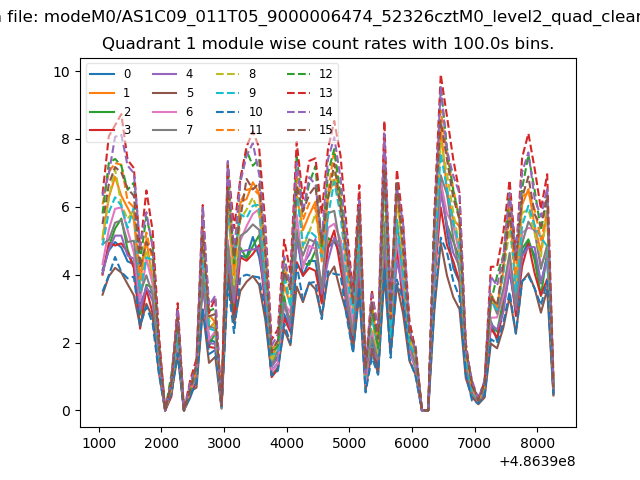 |
 |
| Module-wise count rates for Quadrant C Data is divided into 100 sec bins |
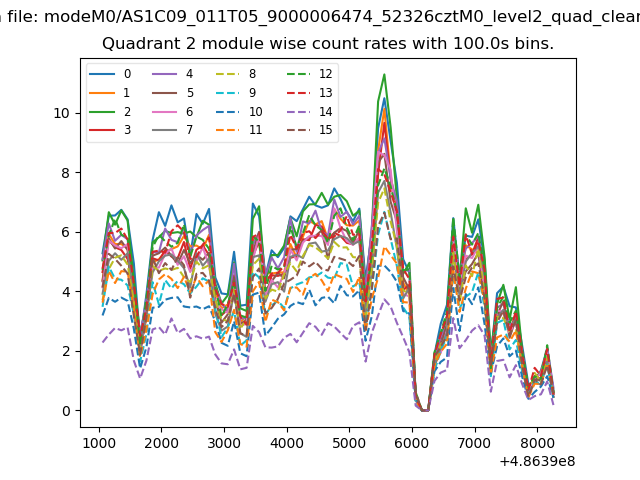 |
 |
| Module-wise count rates for Quadrant D Data is divided into 100 sec bins |
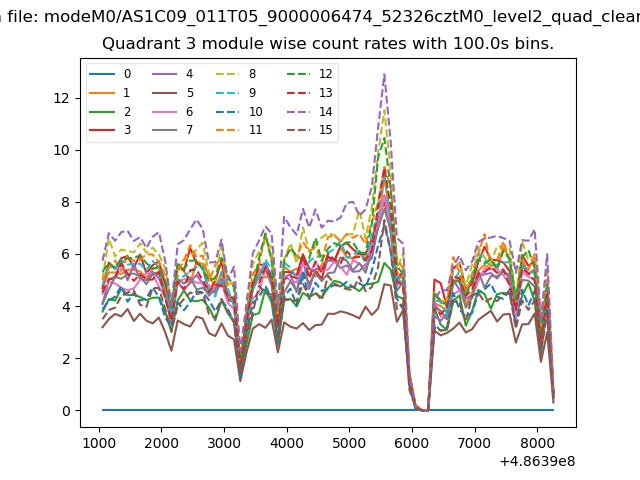 |
 |
| Parameter | Plot |
|---|---|
| CZT HV Monitor | 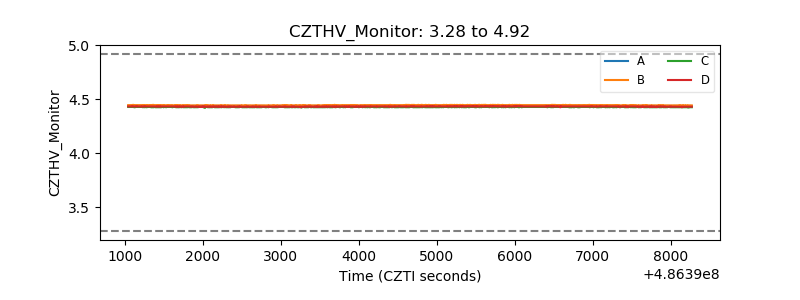 |
| D_VDD | 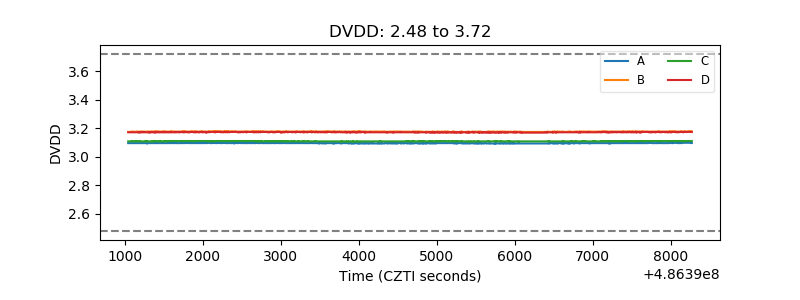 |
| Temperature 1 | 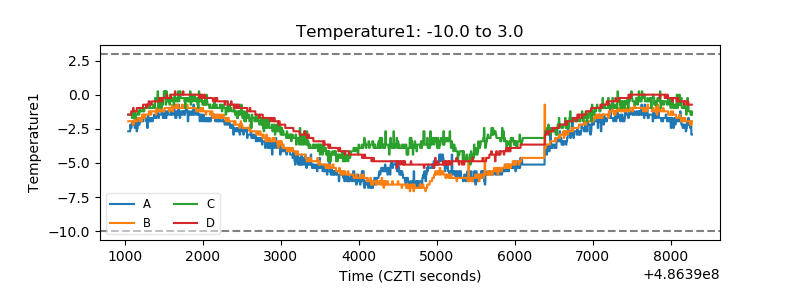 |
| Veto HV Monitor | 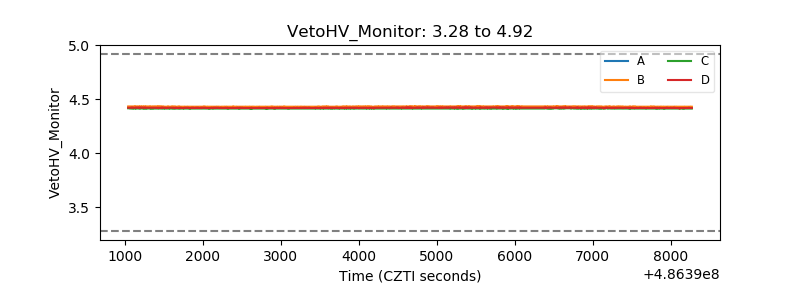 |
| Veto LLD | 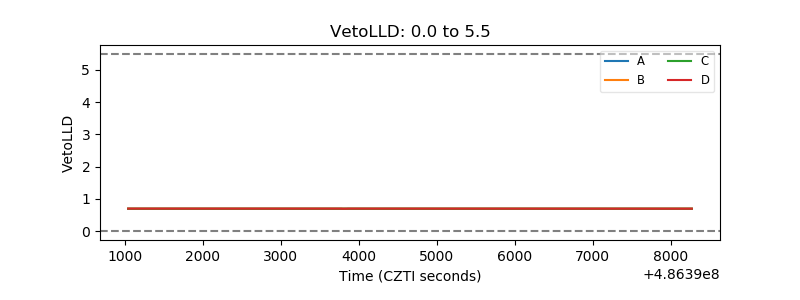 |
| Alpha Counter | 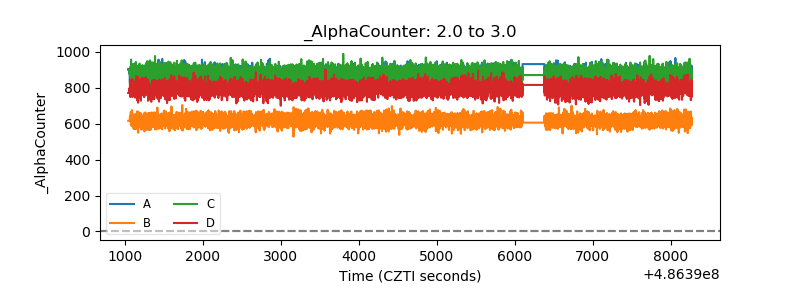 |
| _CPM_Rate | 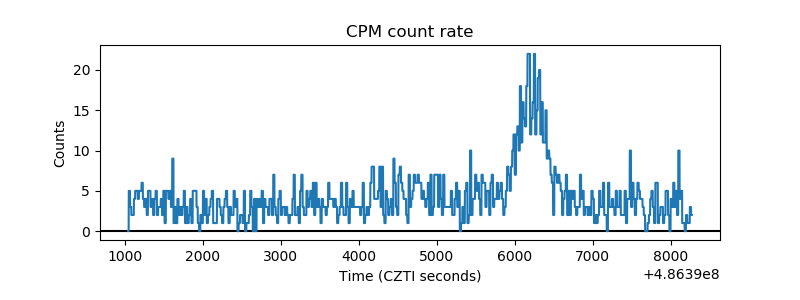 |
| CZT Counter | 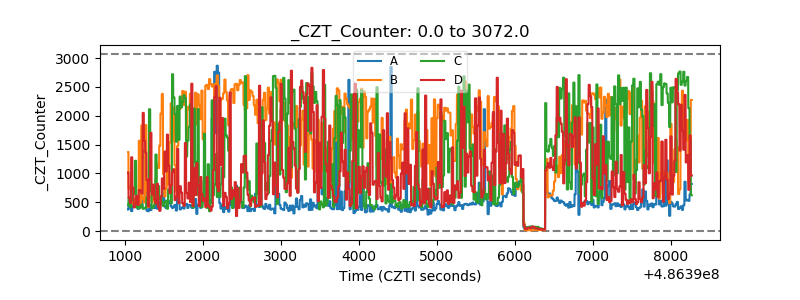 |
| +2.5 Volts monitor | 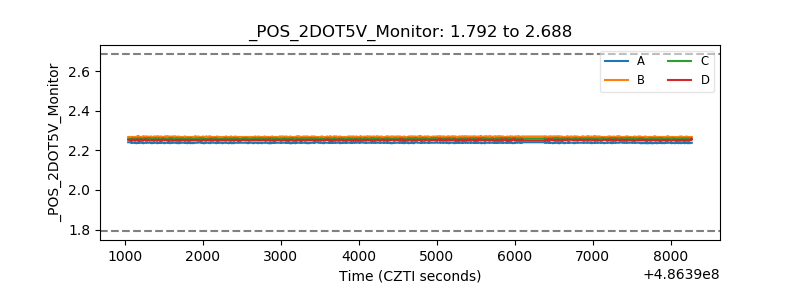 |
| +5 Volts monitor | 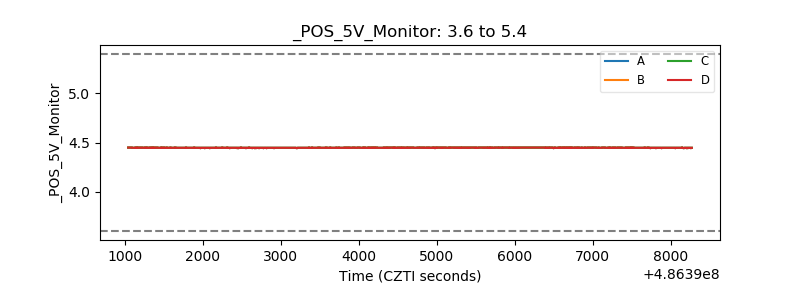 |
| _ROLL_ROT | 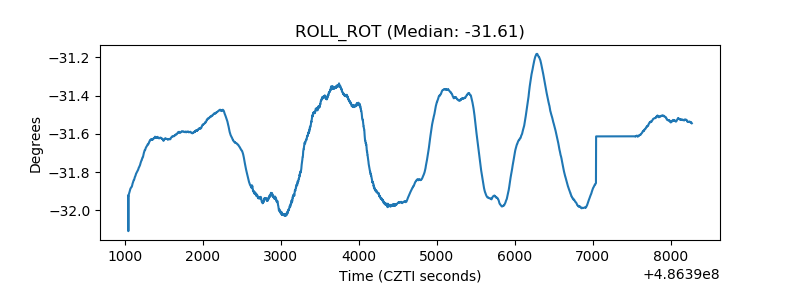 |
| _Roll_DEC | 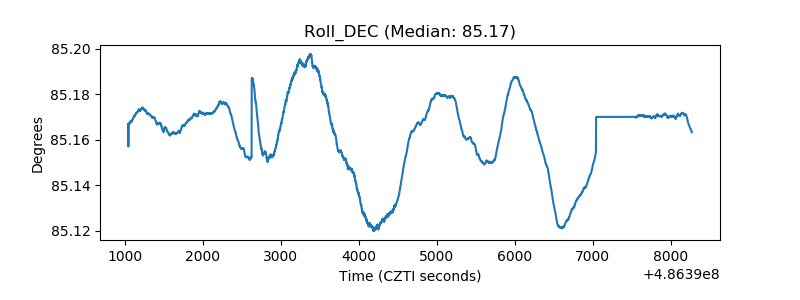 |
| _Roll_RA | 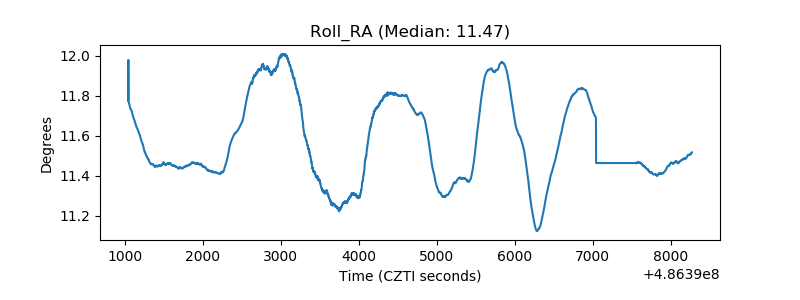 |
| Veto Counter | 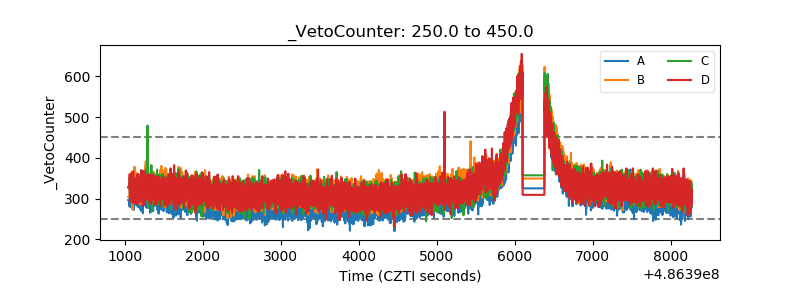 |