| Param | Original file | Final file |
|---|---|---|
| Filename | modeM0/AS1C09_011T05_9000006474_52327cztM0_level2.fits | modeM0/AS1C09_011T05_9000006474_52327cztM0_level2_quad_clean.evt |
| Size (bytes) | 990,118,080 | 80,484,480 |
| Size | 944.3 MB | 76.8 MB |
| Events in quadrant A | 3,809,675 | 649,467 |
| Events in quadrant B | 10,726,725 | 482,615 |
| Events in quadrant C | 12,208,216 | 355,604 |
| Events in quadrant D | 9,377,321 | 471,164 |
| Mode M0 | |||
|---|---|---|---|
| Quadrant | BADHDUFLAG | Total packets | Discarded packets |
| A | 0 | 16099 | 0 |
| B | 0 | 36710 | 0 |
| C | 0 | 40968 | 10 |
| D | 0 | 32636 | 4 |
| Mode SS | |||
|---|---|---|---|
| Quadrant | BADHDUFLAG | Total packets | Discarded packets |
| A | 0 | 136 | 0 |
| B | 0 | 136 | 0 |
| C | 0 | 136 | 0 |
| D | 0 | 136 | 0 |
| Quadrant | Total seconds | Saturated seconds | Saturation percentage |
|---|---|---|---|
| A | 6857 | 128 | 1.866706% |
| B | 6857 | 2455 | 35.802829% |
| C | 6856 | 3417 | 49.839557% |
| D | 6857 | 1664 | 24.267172% |
Noise dominated data is calculated using 1-second bins in cleaned event files. If a bin has >2000 counts, and if more than 50% of those come from <1% of pixels, then it is considered to be noise-dominated and hence unusable.
| Quadrant | # 1 sec bins | Bins with >0 counts | Bins with >2000 counts | High rate bins dominated by noise | Noise dominated (total time) | Noise dominated (detector-on time) | Marked lightcurve |
|---|---|---|---|---|---|---|---|
| A | 6857 | 6857 | 87 | 87 | 1.27% | 1.27% | 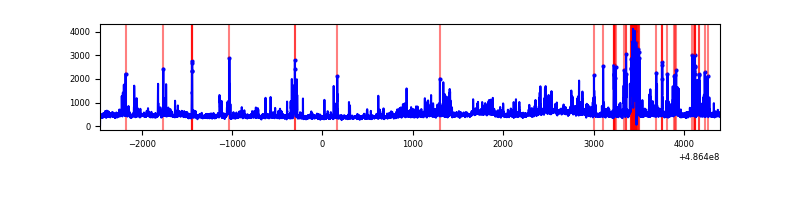 |
| B | 6857 | 6857 | 2033 | 2033 | 29.65% | 29.65% | 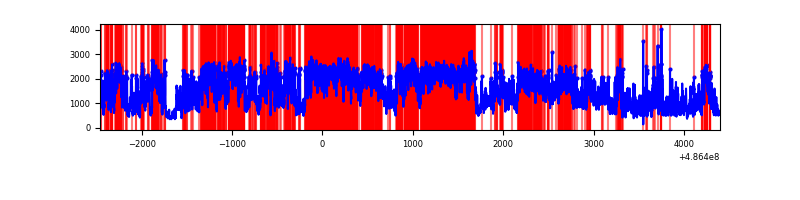 |
| C | 6858 | 6858 | 3028 | 3028 | 44.15% | 44.15% | 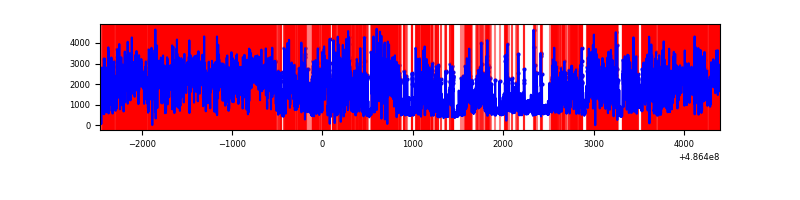 |
| D | 6857 | 6857 | 1610 | 1610 | 23.48% | 23.48% | 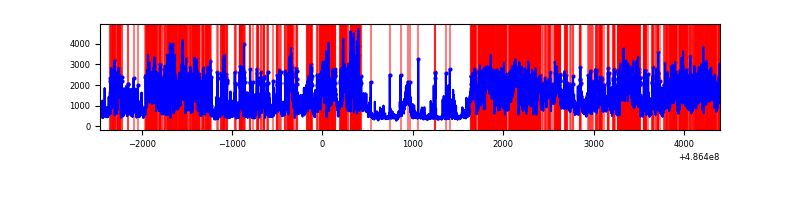 |
Top three noisy pixels from each quadrant. If the there are fewer than three noisy pixels in the level2.evt file, extra rows are filled as -1
| Pixel properties | Quadrant properties | ||||||
|---|---|---|---|---|---|---|---|
| Quadrant | DetID | PixID | Counts | Sigma | Mean | Median | Sigma |
| A | 5 | 243 | 313463 | 1775.85 | 710 | 694 | 176.1 |
| A | 11 | 3 | 133744 | 755.44 | 710 | 694 | 176.1 |
| A | 4 | 249 | 120129 | 678.13 | 710 | 694 | 176.1 |
| B | 7 | 0 | 4155952 | 30079.71 | 647 | 623 | 138.1 |
| B | 10 | 254 | 2991070 | 21647.33 | 647 | 623 | 138.1 |
| B | 0 | 216 | 389664 | 2816.2 | 647 | 623 | 138.1 |
| C | 12 | 254 | 4144042 | 27721.76 | 537 | 533 | 149.5 |
| C | 15 | 224 | 3059364 | 20464.82 | 537 | 533 | 149.5 |
| C | 15 | 178 | 1048810 | 7013.4 | 537 | 533 | 149.5 |
| D | 12 | 17 | 2252678 | 12373.45 | 637 | 607 | 182.0 |
| D | 12 | 2 | 1915435 | 10520.55 | 637 | 607 | 182.0 |
| D | 15 | 93 | 673724 | 3698.28 | 637 | 607 | 182.0 |
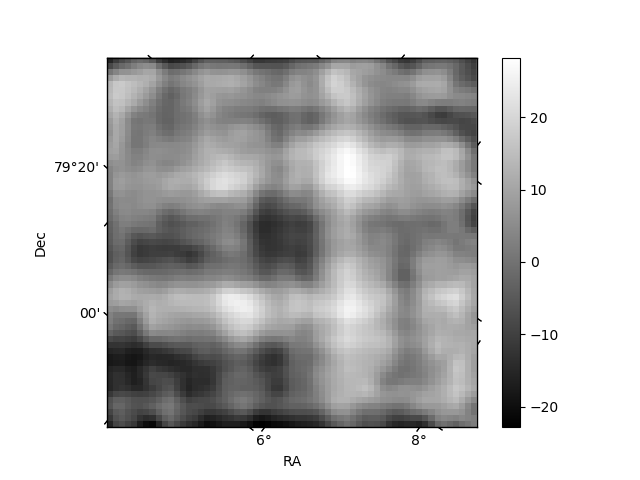
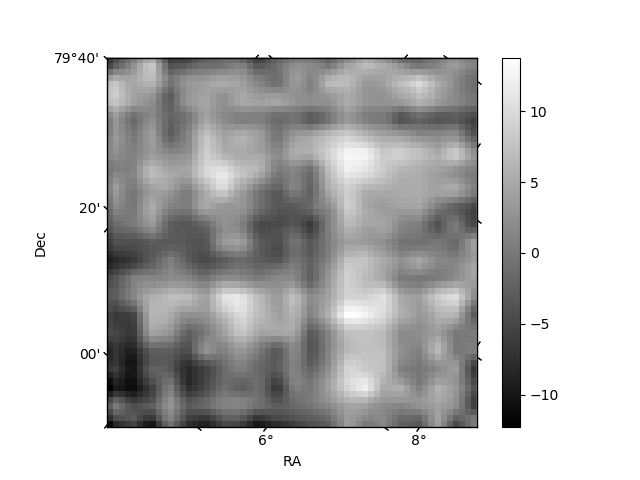
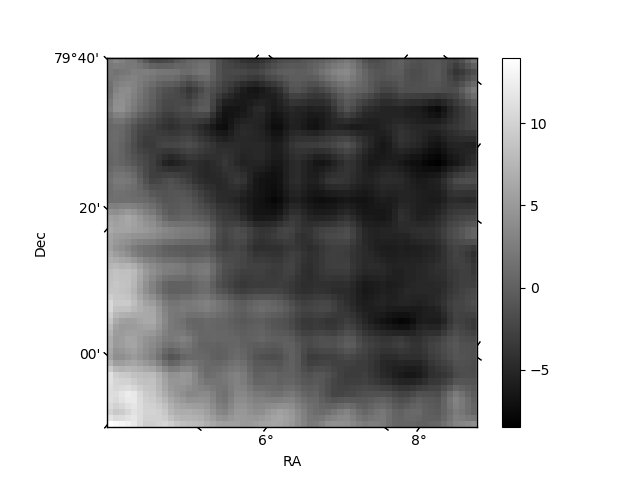
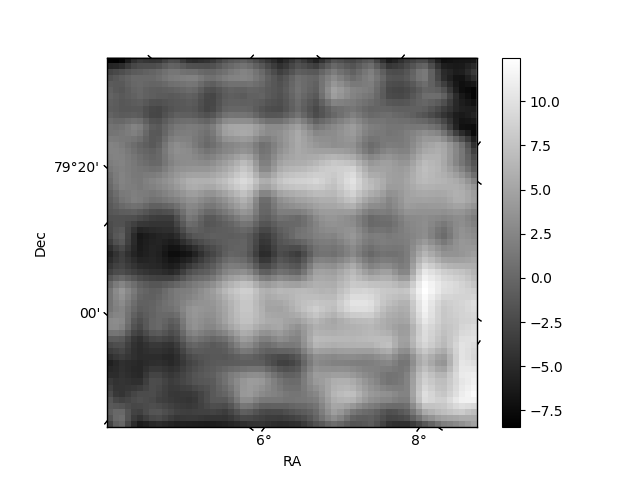
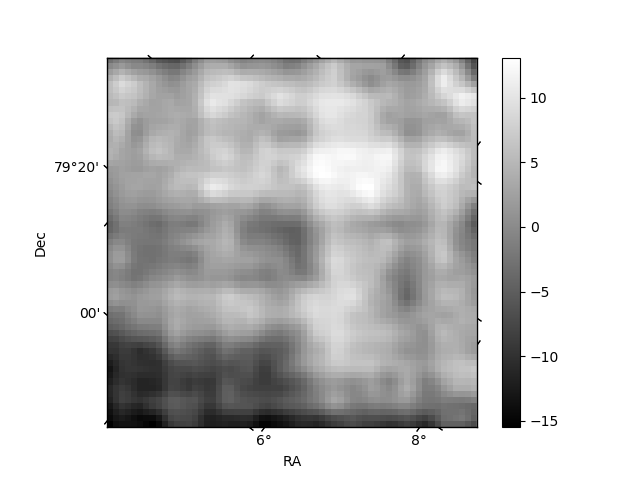
Histogram calculated using DETX and DETY for each event in the final _common_clean file
| Quadrant A | 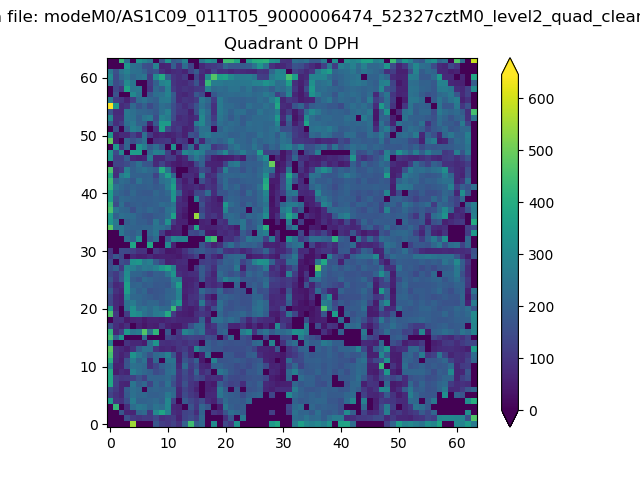 |
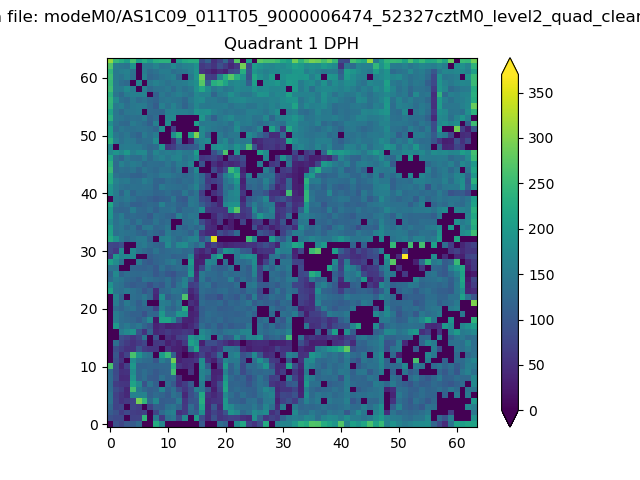 |
Quadrant B |
|---|---|---|---|
| Quadrant D | 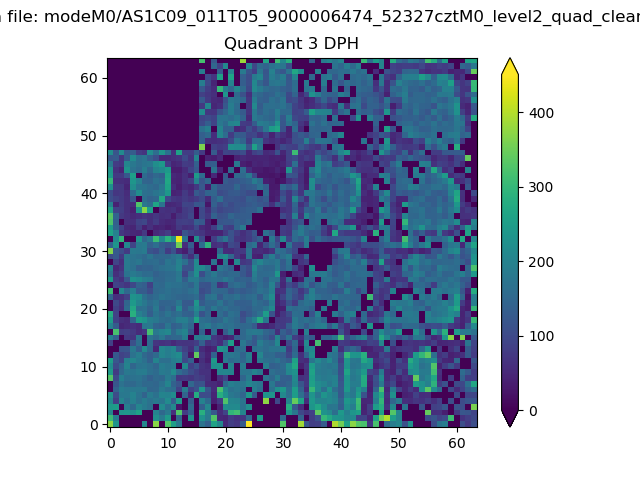 |
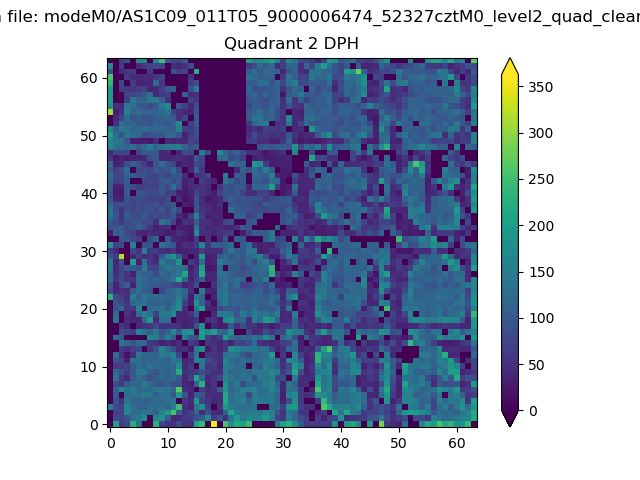 |
Quadrant C |
| Plot type | Count rate plots | Images |
|---|---|---|
| Comparison with Poisson distribution Blue bars denote a histogram of data divided into 1 sec bins. Red curve is a Poisson curve with rate = median count rate of data. |
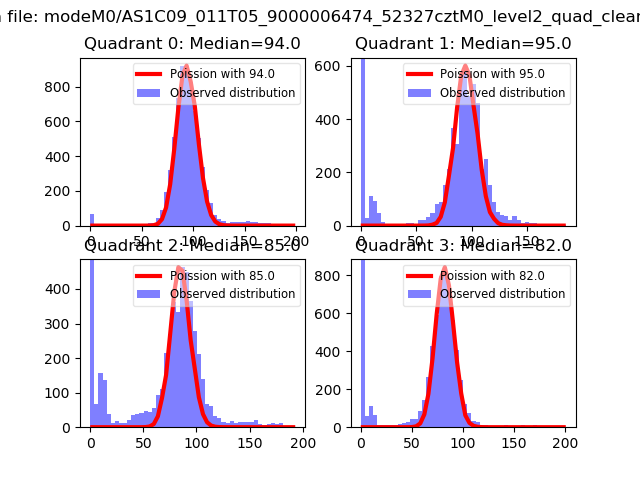 |
 |
| Quadrant-wise count rates Data is divided into 100 sec bins |
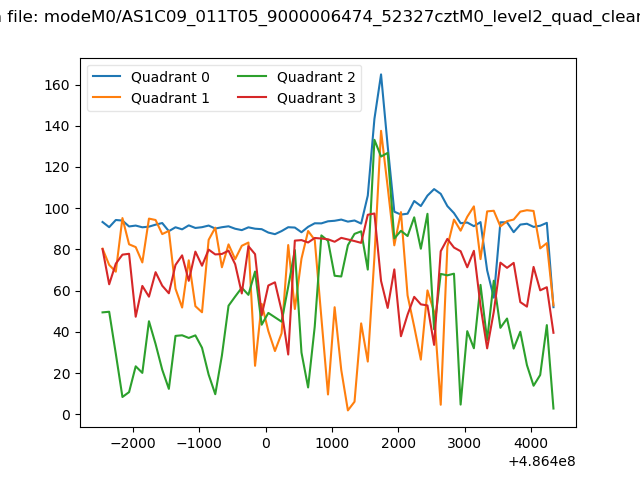 |
|
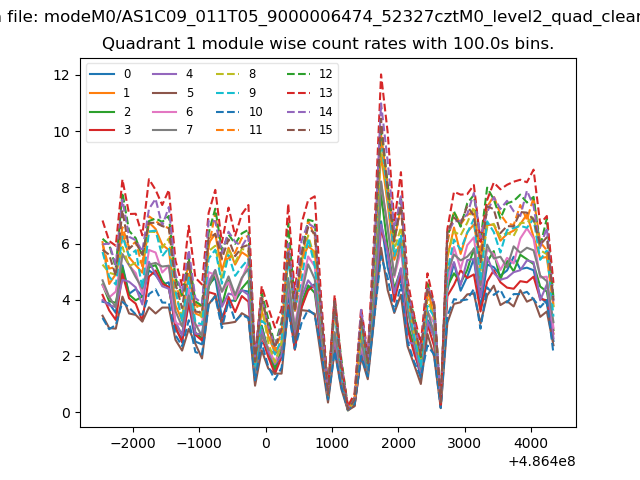
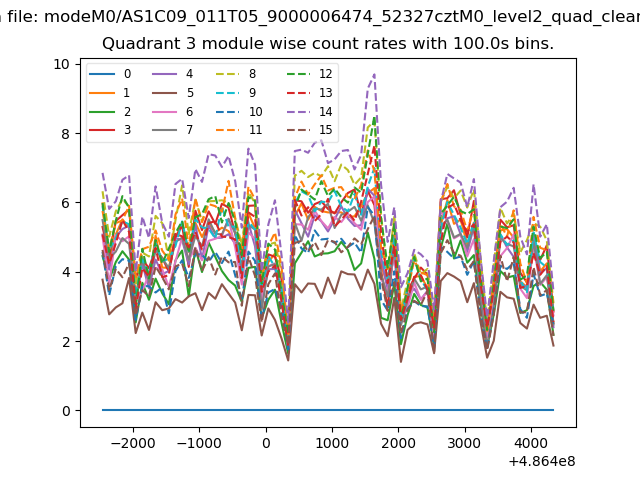
| Module-wise count rates for Quadrant A Data is divided into 100 sec bins |
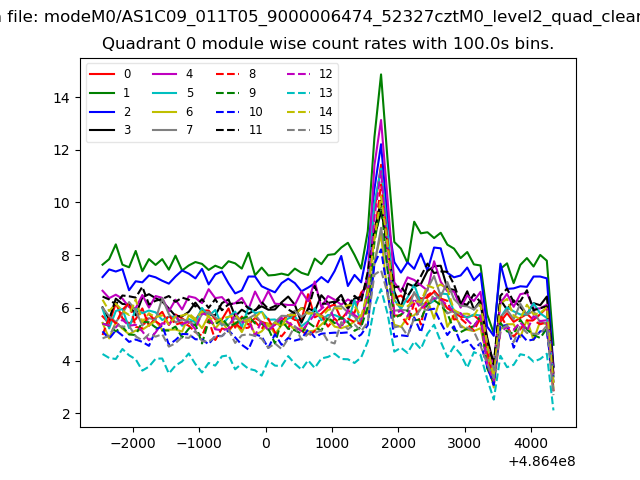 |
 |
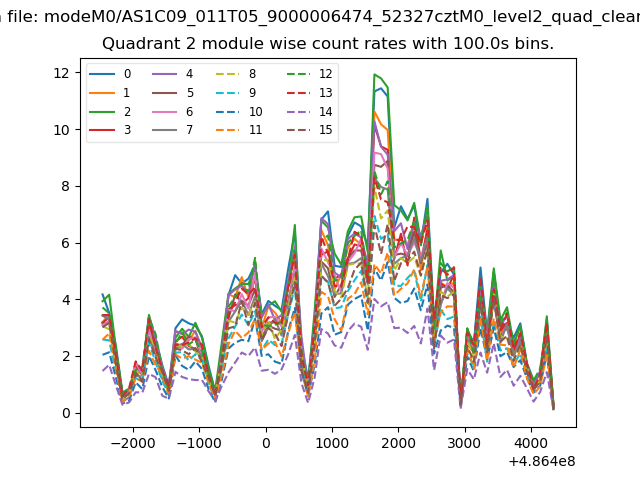
| Module-wise count rates for Quadrant B Data is divided into 100 sec bins |
 |
 |
| Module-wise count rates for Quadrant C Data is divided into 100 sec bins |
 |
 |
| Module-wise count rates for Quadrant D Data is divided into 100 sec bins |
 |
 |
| Parameter | Plot |
|---|---|
| CZT HV Monitor |  |
| D_VDD | 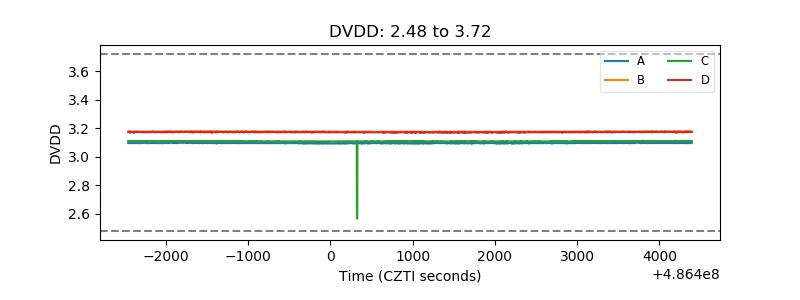 |
| Temperature 1 |  |
| Veto HV Monitor | 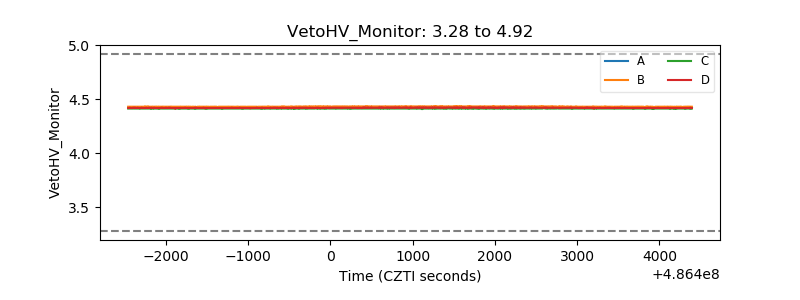 |
| Veto LLD | 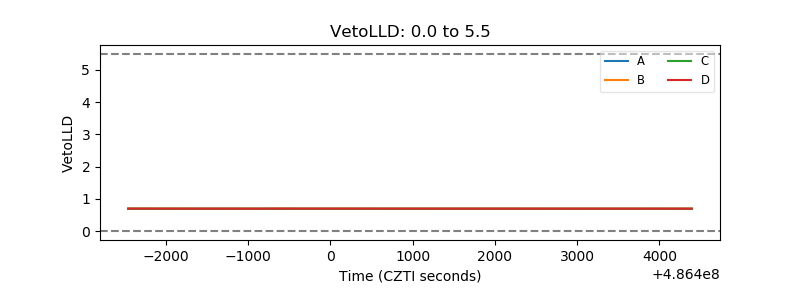 |
| Alpha Counter | 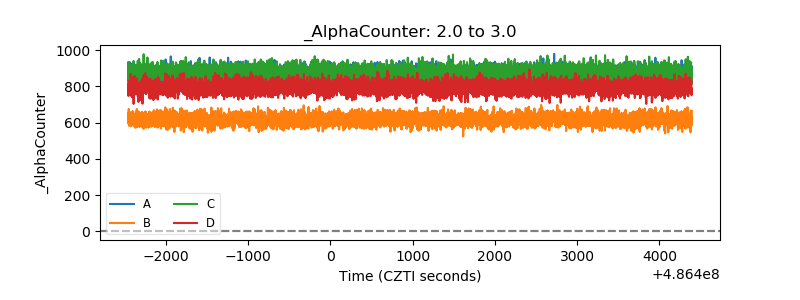 |
| _CPM_Rate | 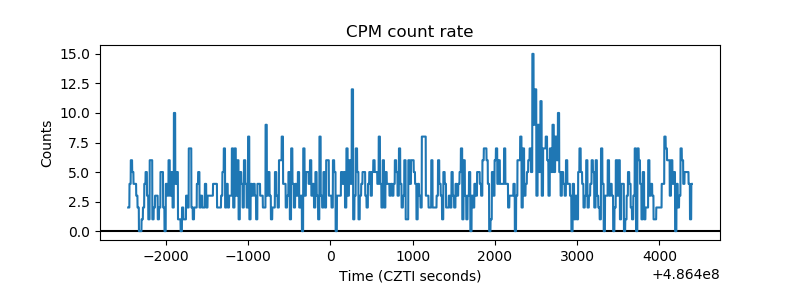 |
| CZT Counter | 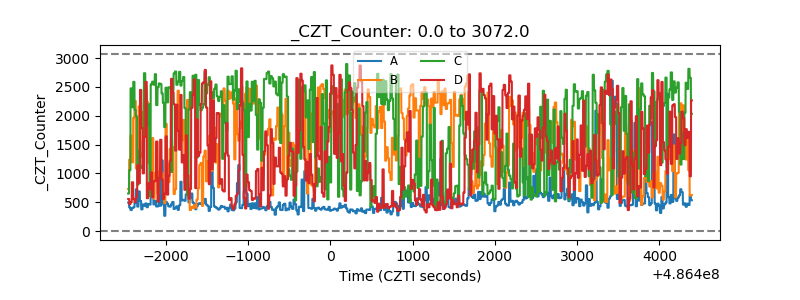 |
| +2.5 Volts monitor | 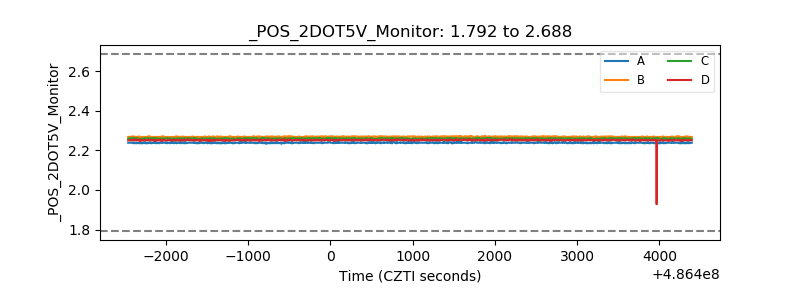 |
| +5 Volts monitor |  |
| _ROLL_ROT | 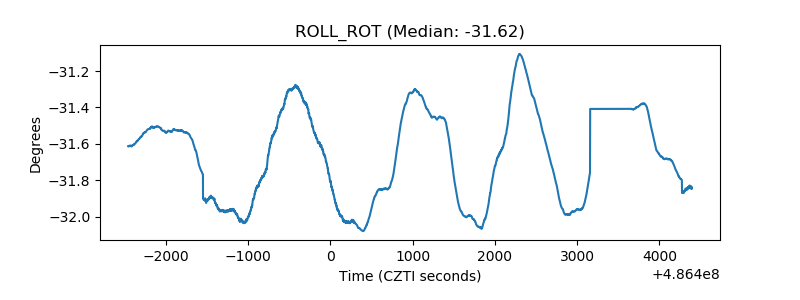 |
| _Roll_DEC | 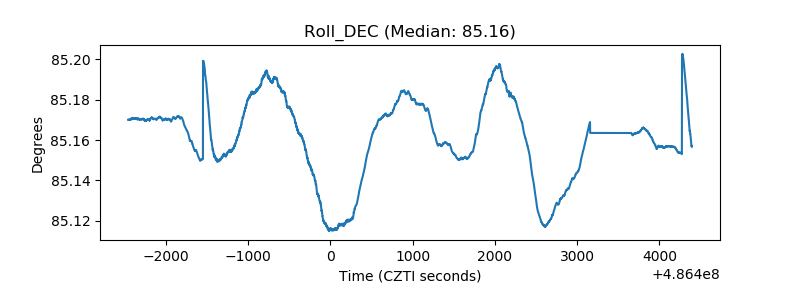 |
| _Roll_RA | 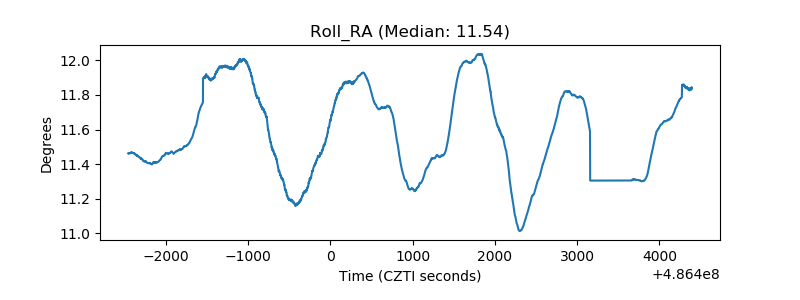 |
| Veto Counter | 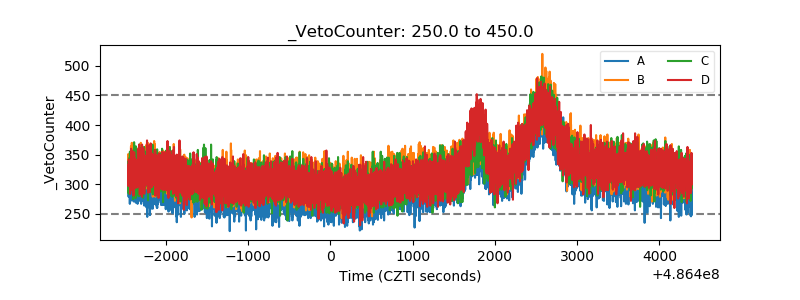 |