| Param | Original file | Final file |
|---|---|---|
| Filename | modeM0/AS1C09_011T05_9000006474_52333cztM0_level2.fits | modeM0/AS1C09_011T05_9000006474_52333cztM0_level2_quad_clean.evt |
| Size (bytes) | 704,013,120 | 83,076,480 |
| Size | 671.4 MB | 79.2 MB |
| Events in quadrant A | 3,196,557 | 600,436 |
| Events in quadrant B | 4,447,348 | 631,399 |
| Events in quadrant C | 9,880,240 | 385,721 |
| Events in quadrant D | 8,034,405 | 445,106 |
| Mode M0 | |||
|---|---|---|---|
| Quadrant | BADHDUFLAG | Total packets | Discarded packets |
| A | 0 | 14309 | 5 |
| B | 0 | 17673 | 12 |
| C | 0 | 33843 | 17 |
| D | 0 | 28374 | 13 |
| Mode SS | |||
|---|---|---|---|
| Quadrant | BADHDUFLAG | Total packets | Discarded packets |
| A | 0 | 134 | 0 |
| B | 0 | 134 | 0 |
| C | 0 | 134 | 0 |
| D | 0 | 134 | 0 |
| Mode M9 | |||
|---|---|---|---|
| Quadrant | BADHDUFLAG | Total packets | Discarded packets |
| A | 0 | 9 | 0 |
| B | 0 | 9 | 0 |
| C | 0 | 9 | 0 |
| D | 0 | 9 | 0 |
| Quadrant | Total seconds | Saturated seconds | Saturation percentage |
|---|---|---|---|
| A | 6481 | 54 | 0.833205% |
| B | 6480 | 204 | 3.148148% |
| C | 6480 | 2400 | 37.037037% |
| D | 6479 | 1382 | 21.330452% |
Noise dominated data is calculated using 1-second bins in cleaned event files. If a bin has >2000 counts, and if more than 50% of those come from <1% of pixels, then it is considered to be noise-dominated and hence unusable.
| Quadrant | # 1 sec bins | Bins with >0 counts | Bins with >2000 counts | High rate bins dominated by noise | Noise dominated (total time) | Noise dominated (detector-on time) | Marked lightcurve |
|---|---|---|---|---|---|---|---|
| A | 7413 | 6485 | 32 | 32 | 0.43% | 0.49% | 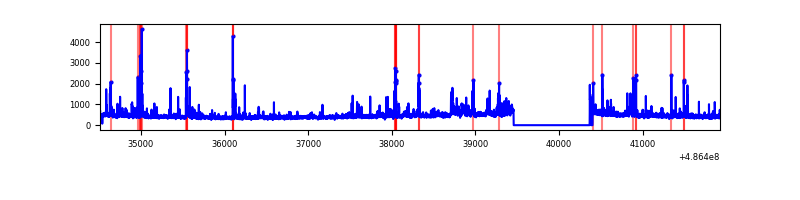 |
| B | 7413 | 6485 | 112 | 112 | 1.51% | 1.73% | 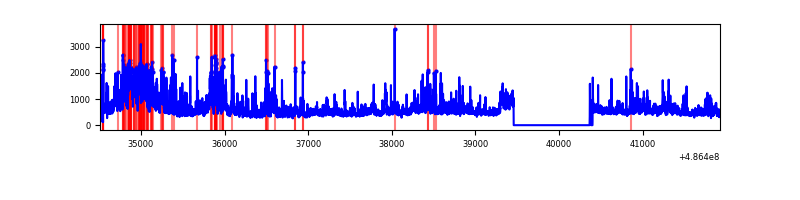 |
| C | 7412 | 6483 | 1982 | 1982 | 26.74% | 30.57% | 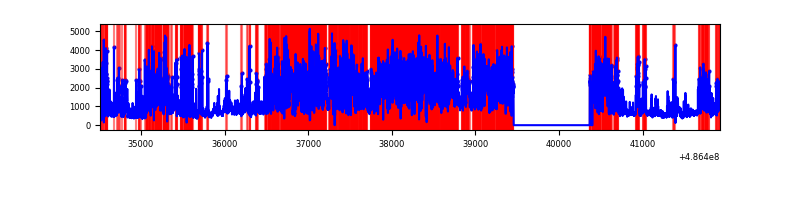 |
| D | 7413 | 6485 | 1189 | 1189 | 16.04% | 18.33% | 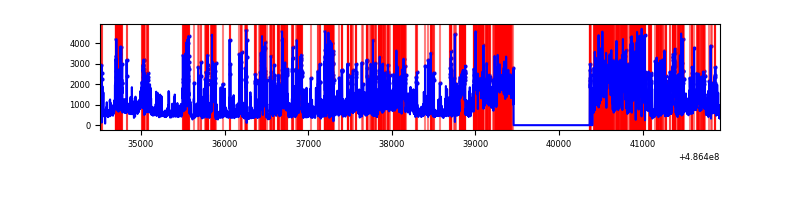 |
Top three noisy pixels from each quadrant. If the there are fewer than three noisy pixels in the level2.evt file, extra rows are filled as -1
| Pixel properties | Quadrant properties | ||||||
|---|---|---|---|---|---|---|---|
| Quadrant | DetID | PixID | Counts | Sigma | Mean | Median | Sigma |
| A | 5 | 240 | 110510 | 665.3 | 663 | 647 | 165.1 |
| A | 11 | 3 | 93566 | 562.69 | 663 | 647 | 165.1 |
| A | 8 | 249 | 64586 | 387.2 | 663 | 647 | 165.1 |
| B | 10 | 254 | 608089 | 4306.88 | 654 | 631 | 141.0 |
| B | 12 | 32 | 471025 | 3335.09 | 654 | 631 | 141.0 |
| B | 0 | 216 | 224777 | 1589.2 | 654 | 631 | 141.0 |
| C | 15 | 224 | 2453139 | 17105.97 | 521 | 517 | 143.4 |
| C | 15 | 178 | 1721967 | 12006.36 | 521 | 517 | 143.4 |
| C | 15 | 248 | 1346624 | 9388.51 | 521 | 517 | 143.4 |
| D | 15 | 78 | 1514324 | 9274.04 | 576 | 551 | 163.2 |
| D | 15 | 93 | 935307 | 5726.73 | 576 | 551 | 163.2 |
| D | 2 | 62 | 906867 | 5552.49 | 576 | 551 | 163.2 |
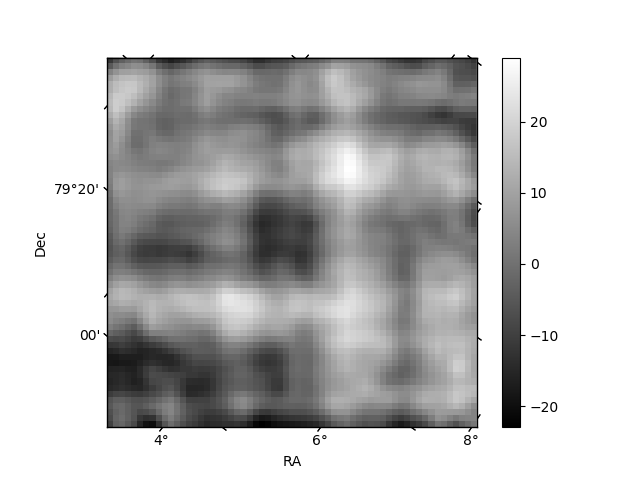
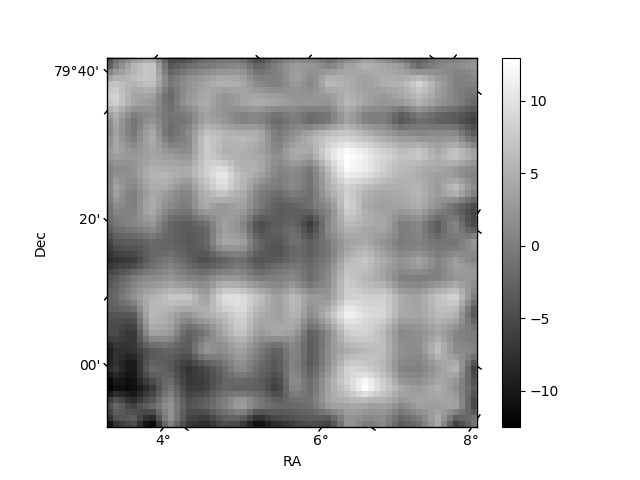
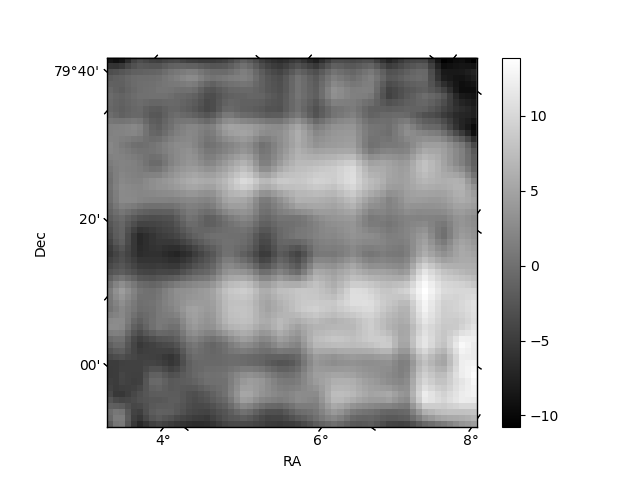
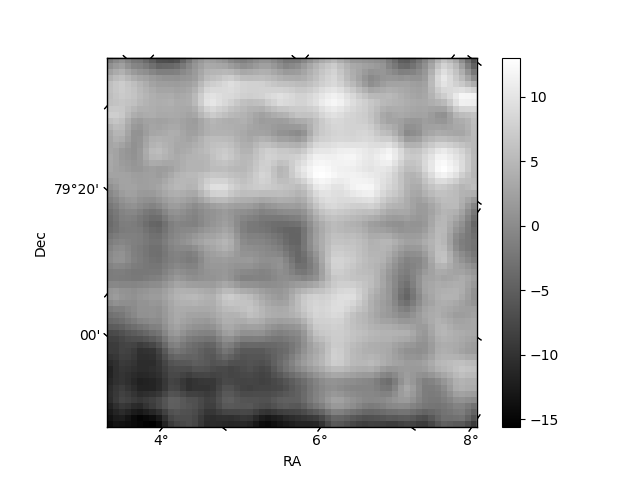
Histogram calculated using DETX and DETY for each event in the final _common_clean file
| Quadrant A | 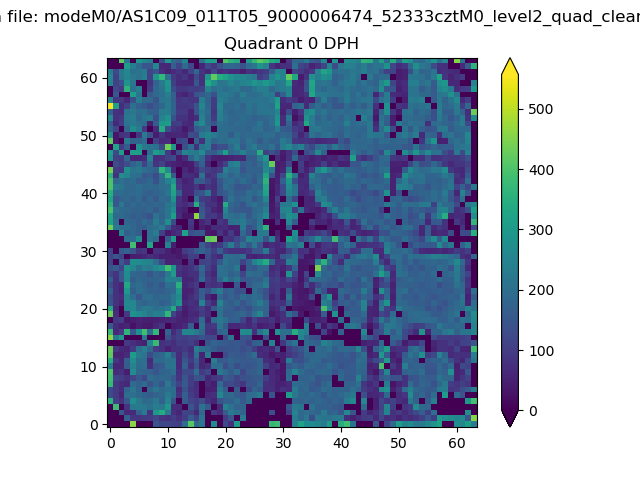 |
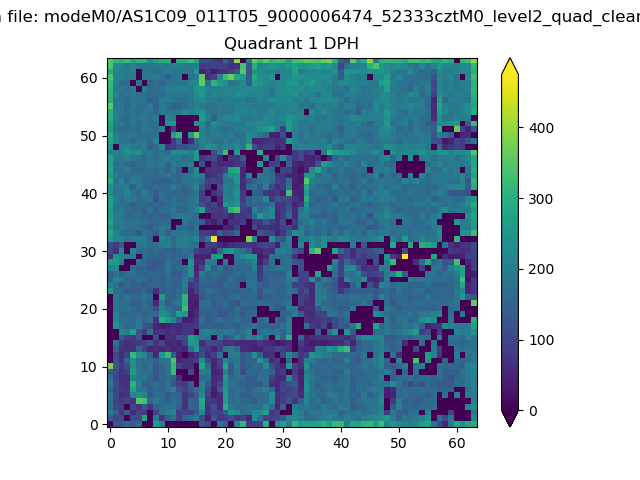 |
Quadrant B |
|---|---|---|---|
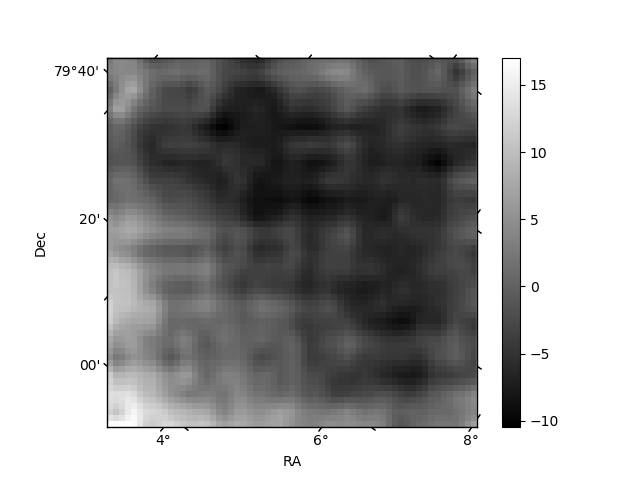
| Quadrant D | 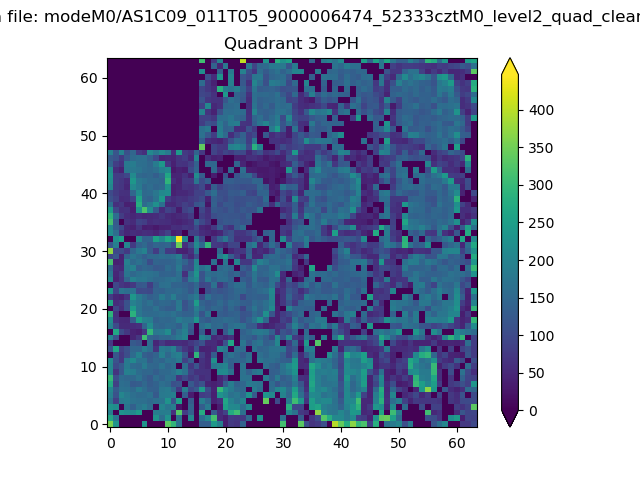 |
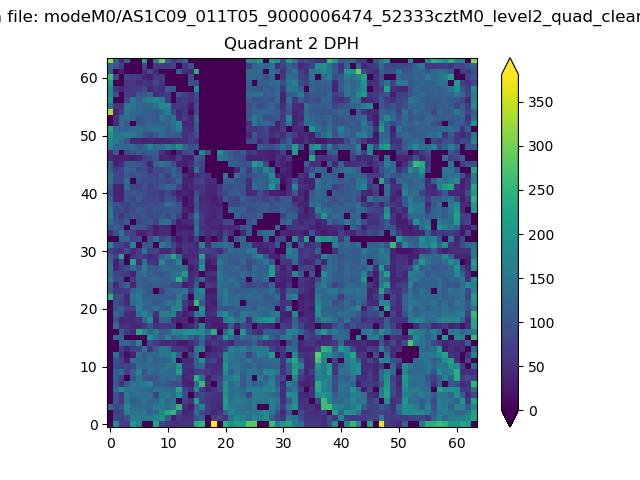 |
Quadrant C |
| Plot type | Count rate plots | Images |
|---|---|---|
| Comparison with Poisson distribution Blue bars denote a histogram of data divided into 1 sec bins. Red curve is a Poisson curve with rate = median count rate of data. |
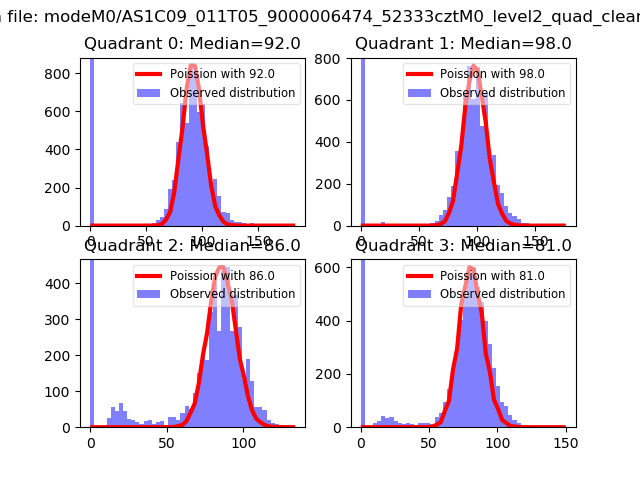 |
 |
| Quadrant-wise count rates Data is divided into 100 sec bins |
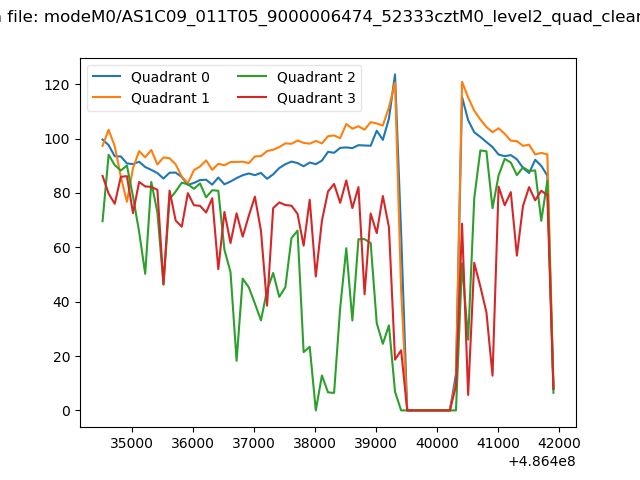 |
|
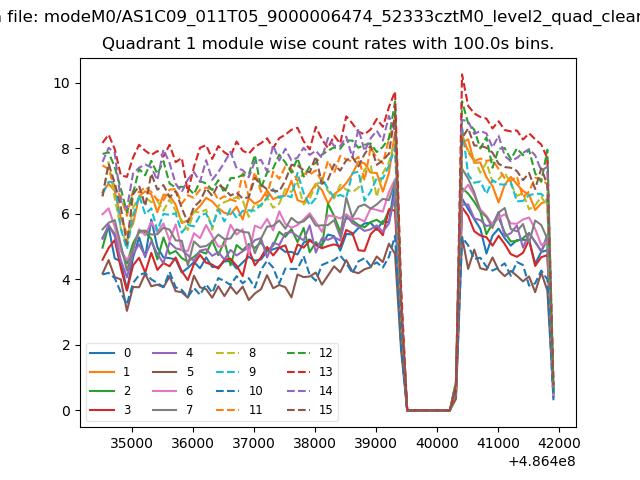
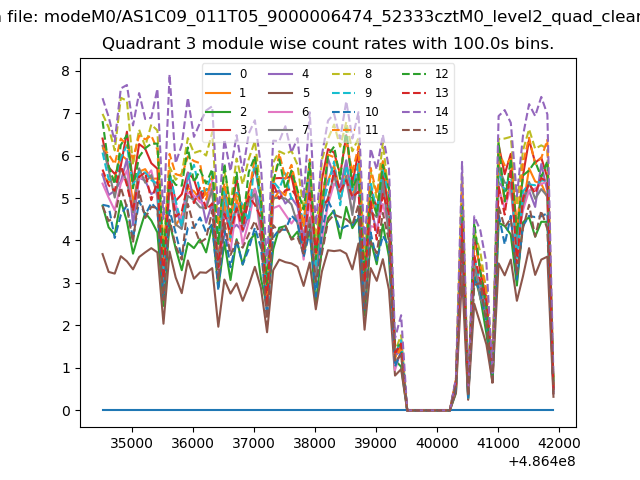
| Module-wise count rates for Quadrant A Data is divided into 100 sec bins |
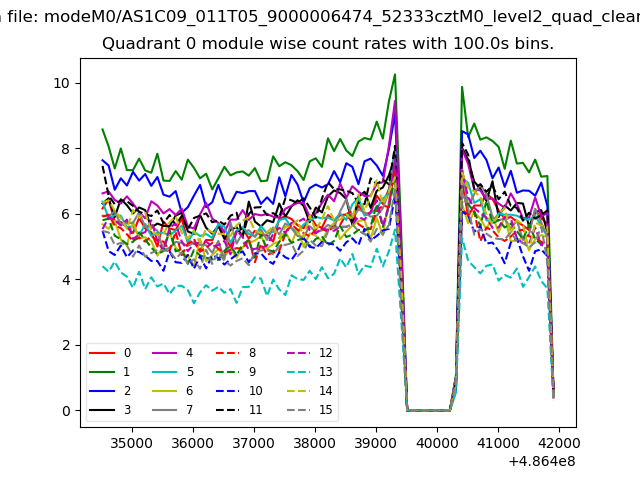 |
 |
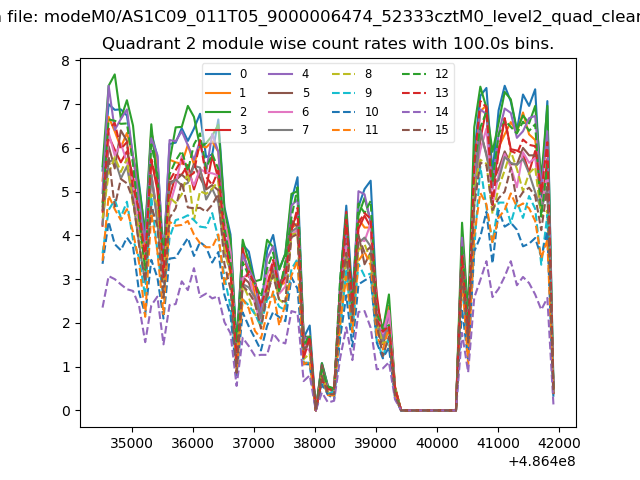
| Module-wise count rates for Quadrant B Data is divided into 100 sec bins |
 |
 |
| Module-wise count rates for Quadrant C Data is divided into 100 sec bins |
 |
 |
| Module-wise count rates for Quadrant D Data is divided into 100 sec bins |
 |
 |
| Parameter | Plot |
|---|---|
| CZT HV Monitor | 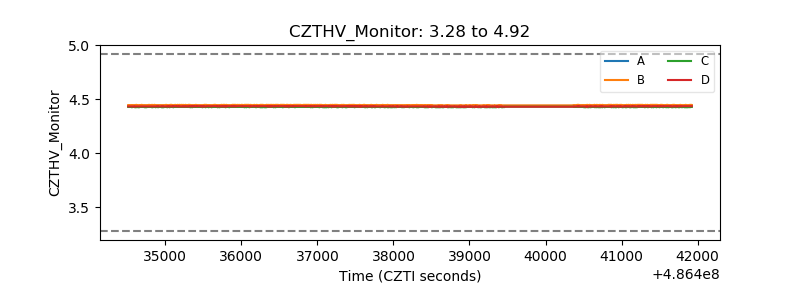 |
| D_VDD | 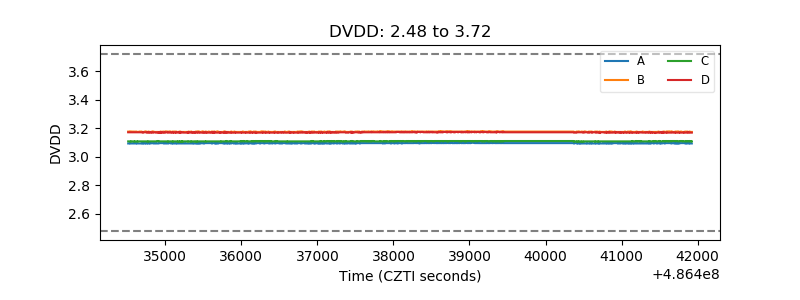 |
| Temperature 1 | 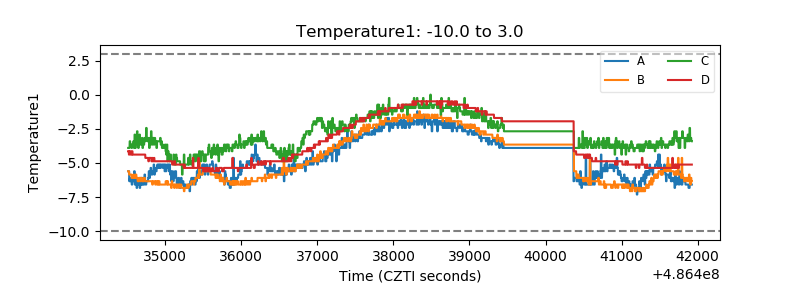 |
| Veto HV Monitor | 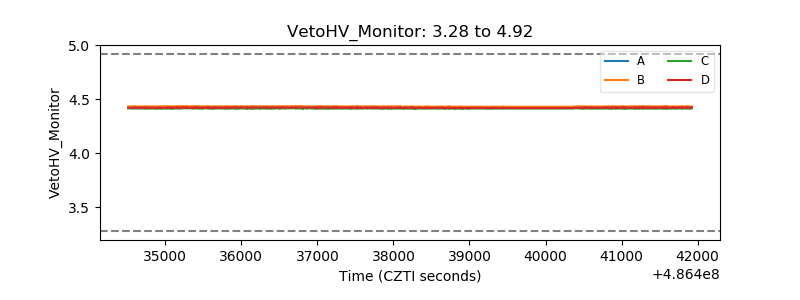 |
| Veto LLD | 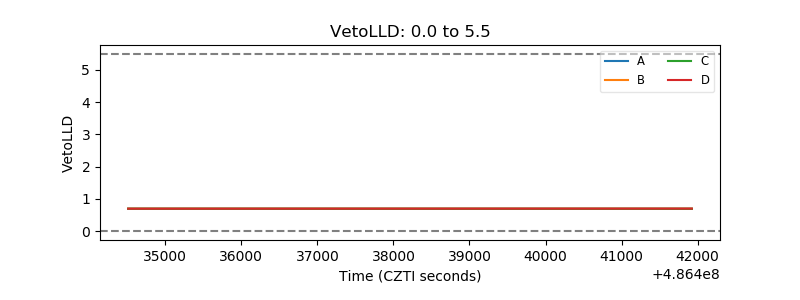 |
| Alpha Counter | 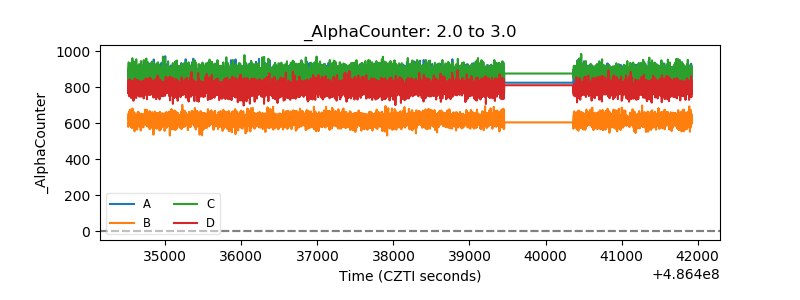 |
| _CPM_Rate | 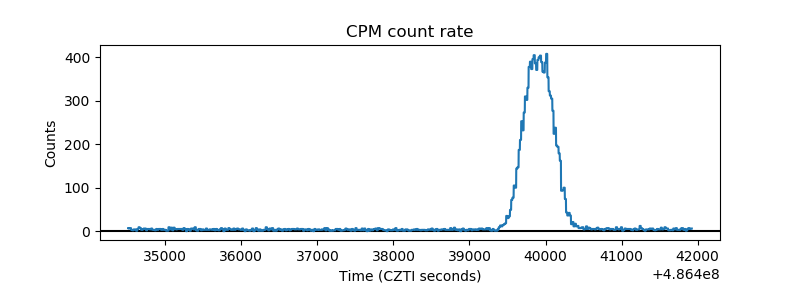 |
| CZT Counter | 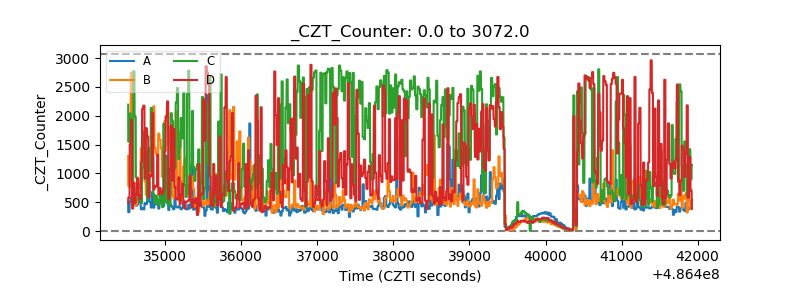 |
| +2.5 Volts monitor |  |
| +5 Volts monitor |  |
| _ROLL_ROT | 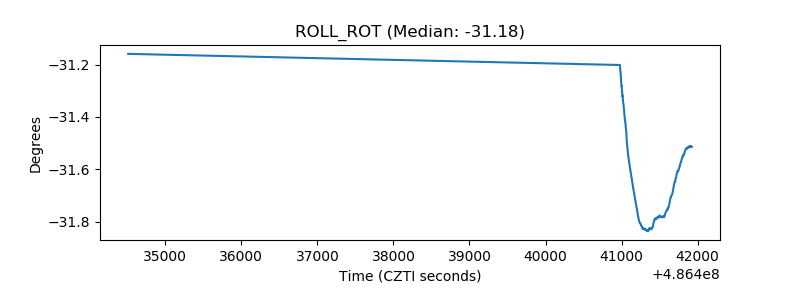 |
| _Roll_DEC | 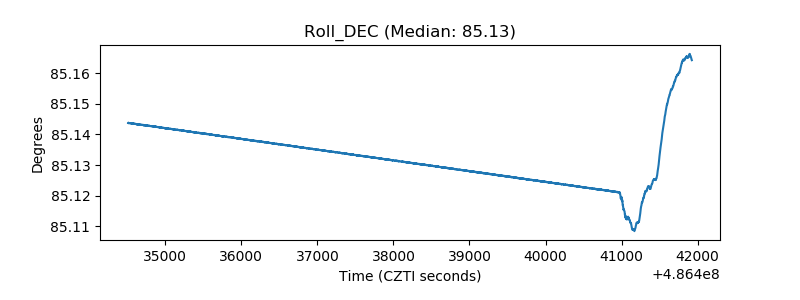 |
| _Roll_RA | 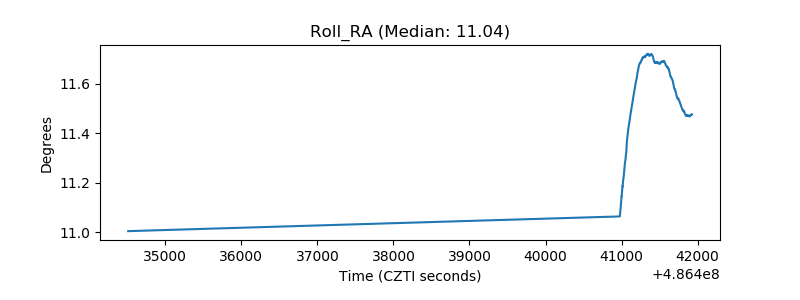 |
| Veto Counter | 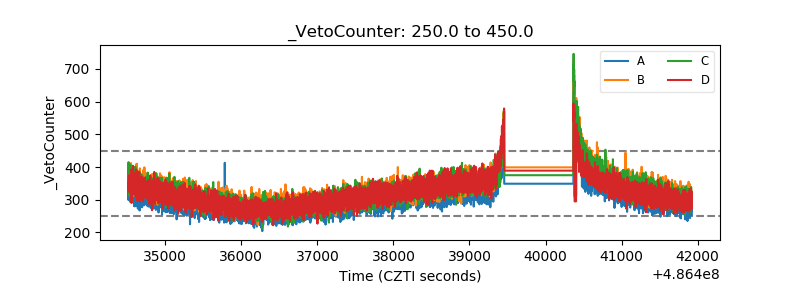 |