| Param | Original file | Final file |
|---|---|---|
| Filename | modeM0/AS1C09_011T05_9000006474_52340cztM0_level2.fits | modeM0/AS1C09_011T05_9000006474_52340cztM0_level2_quad_clean.evt |
| Size (bytes) | 906,575,040 | 85,305,600 |
| Size | 864.6 MB | 81.4 MB |
| Events in quadrant A | 3,492,140 | 739,353 |
| Events in quadrant B | 5,866,474 | 678,761 |
| Events in quadrant C | 13,441,779 | 273,839 |
| Events in quadrant D | 10,243,145 | 425,839 |
| Mode M0 | |||
|---|---|---|---|
| Quadrant | BADHDUFLAG | Total packets | Discarded packets |
| A | 0 | 15706 | 276 |
| B | 0 | 22557 | 472 |
| C | 0 | 45268 | 762 |
| D | 0 | 35634 | 558 |
| Mode SS | |||
|---|---|---|---|
| Quadrant | BADHDUFLAG | Total packets | Discarded packets |
| A | 0 | 138 | 2 |
| B | 0 | 138 | 2 |
| C | 0 | 138 | 2 |
| D | 0 | 138 | 0 |
| Mode M9 | |||
|---|---|---|---|
| Quadrant | BADHDUFLAG | Total packets | Discarded packets |
| A | 0 | 4 | 0 |
| B | 0 | 4 | 0 |
| C | 0 | 4 | 0 |
| D | 0 | 4 | 0 |
| Quadrant | Total seconds | Saturated seconds | Saturation percentage |
|---|---|---|---|
| A | 6671 | 230 | 3.447759% |
| B | 6668 | 506 | 7.588482% |
| C | 6665 | 4232 | 63.495874% |
| D | 6659 | 2069 | 31.070731% |
Noise dominated data is calculated using 1-second bins in cleaned event files. If a bin has >2000 counts, and if more than 50% of those come from <1% of pixels, then it is considered to be noise-dominated and hence unusable.
| Quadrant | # 1 sec bins | Bins with >0 counts | Bins with >2000 counts | High rate bins dominated by noise | Noise dominated (total time) | Noise dominated (detector-on time) | Marked lightcurve |
|---|---|---|---|---|---|---|---|
| A | 7188 | 6687 | 39 | 39 | 0.54% | 0.58% | 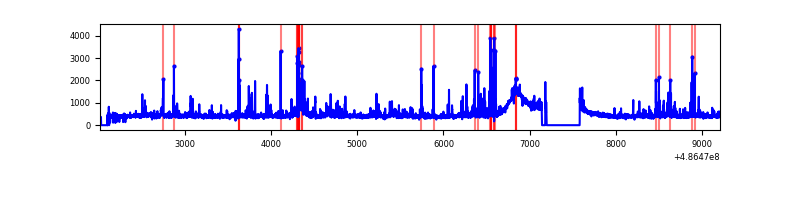 |
| B | 7191 | 6692 | 260 | 260 | 3.62% | 3.89% | 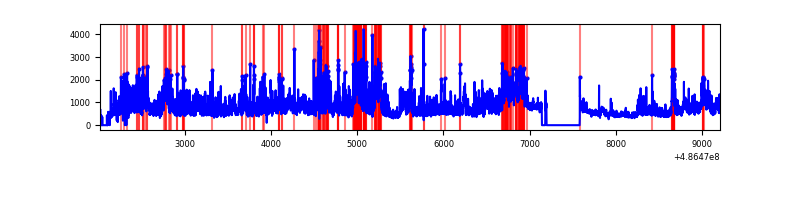 |
| C | 7113 | 6682 | 3658 | 3658 | 51.43% | 54.74% | 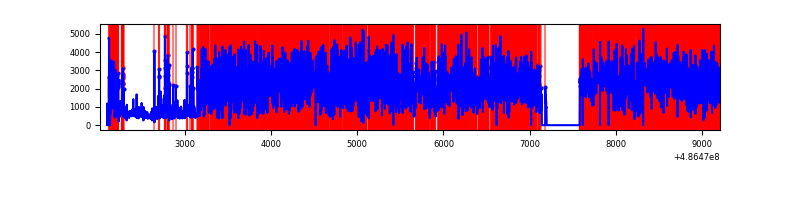 |
| D | 7196 | 6683 | 1884 | 1884 | 26.18% | 28.19% | 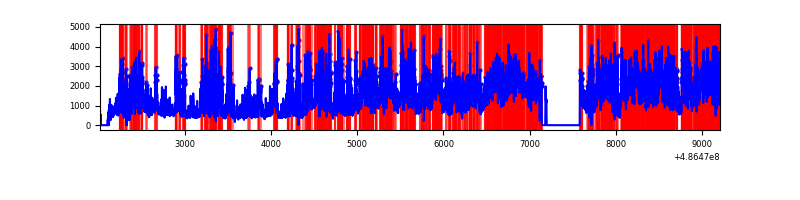 |
Top three noisy pixels from each quadrant. If the there are fewer than three noisy pixels in the level2.evt file, extra rows are filled as -1
| Pixel properties | Quadrant properties | ||||||
|---|---|---|---|---|---|---|---|
| Quadrant | DetID | PixID | Counts | Sigma | Mean | Median | Sigma |
| A | 8 | 20 | 108754 | 568.75 | 718 | 700 | 190.0 |
| A | 3 | 114 | 70348 | 366.6 | 718 | 700 | 190.0 |
| A | 3 | 14 | 49769 | 258.28 | 718 | 700 | 190.0 |
| B | 4 | 170 | 1996377 | 13768.46 | 670 | 648 | 144.9 |
| B | 0 | 216 | 401741 | 2767.13 | 670 | 648 | 144.9 |
| B | 0 | 213 | 115635 | 793.29 | 670 | 648 | 144.9 |
| C | 15 | 248 | 4304205 | 31585.99 | 464 | 456 | 136.3 |
| C | 15 | 224 | 4008595 | 29416.45 | 464 | 456 | 136.3 |
| C | 15 | 178 | 2240402 | 16439.37 | 464 | 456 | 136.3 |
| D | 6 | 42 | 3901983 | 21419.02 | 606 | 578 | 182.1 |
| D | 15 | 78 | 857443 | 4704.26 | 606 | 578 | 182.1 |
| D | 15 | 93 | 673916 | 3696.68 | 606 | 578 | 182.1 |
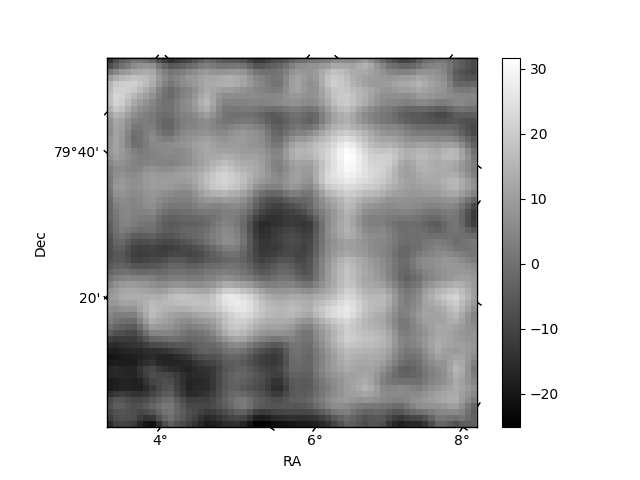
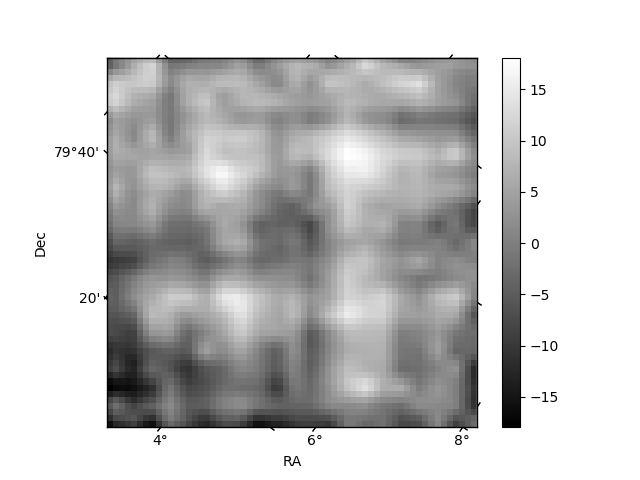
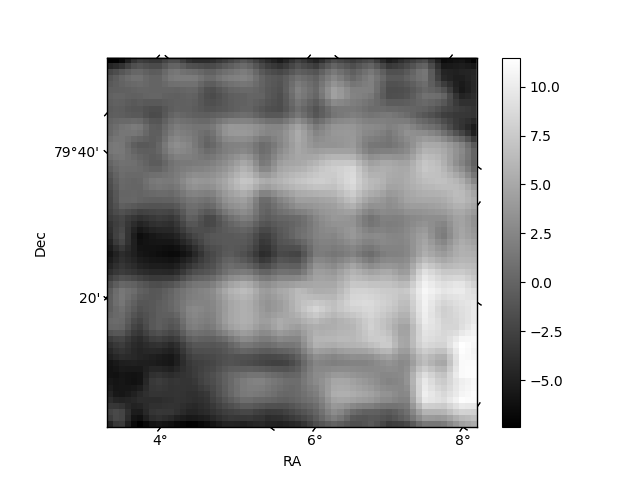
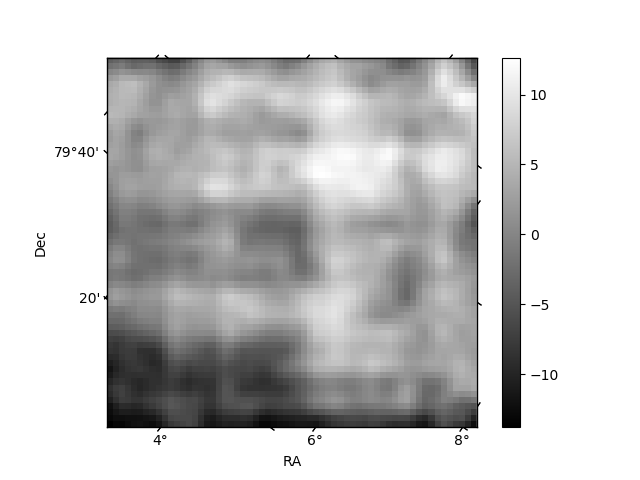
Histogram calculated using DETX and DETY for each event in the final _common_clean file
| Quadrant A | 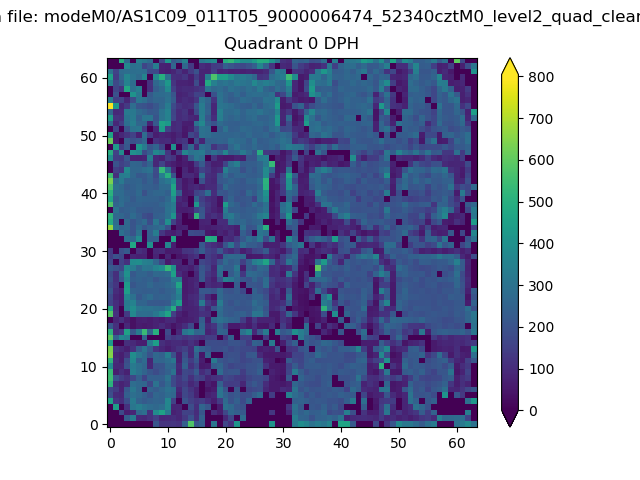 |
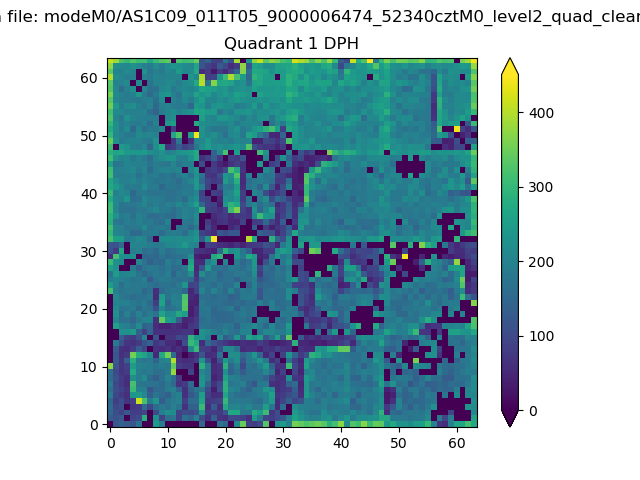 |
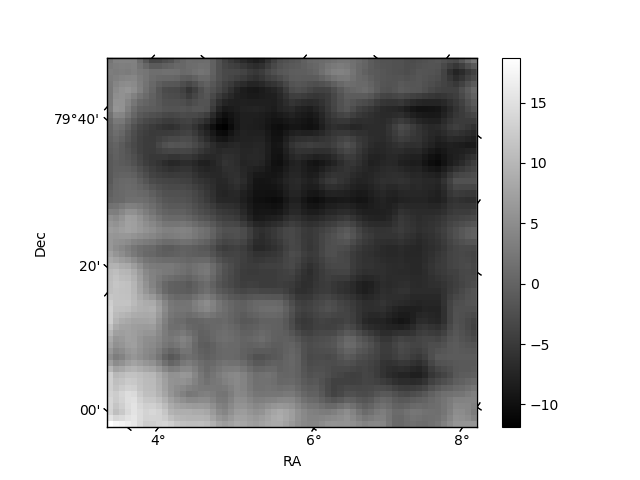
Quadrant B |
|---|---|---|---|
| Quadrant D | 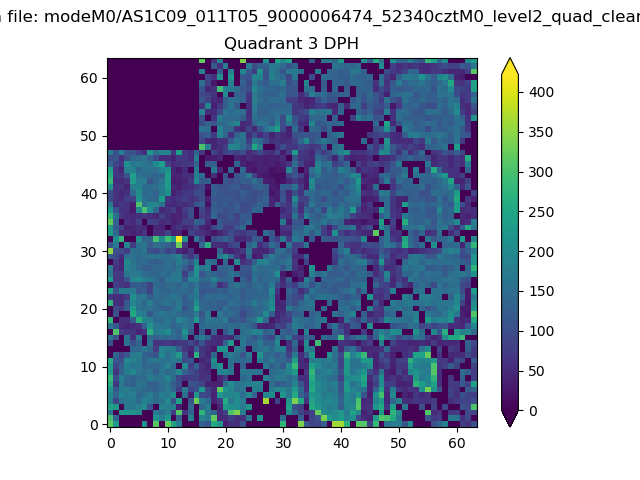 |
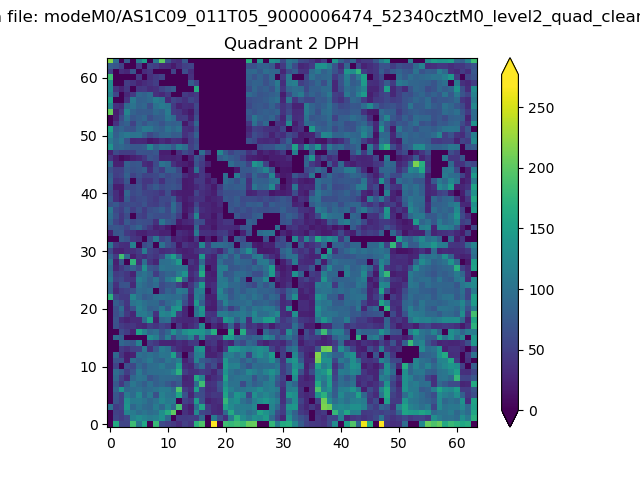 |
Quadrant C |
| Plot type | Count rate plots | Images |
|---|---|---|
| Comparison with Poisson distribution Blue bars denote a histogram of data divided into 1 sec bins. Red curve is a Poisson curve with rate = median count rate of data. |
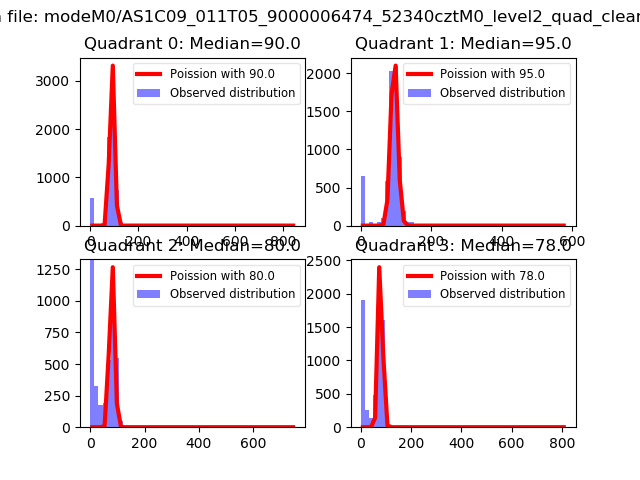 |
 |
| Quadrant-wise count rates Data is divided into 100 sec bins |
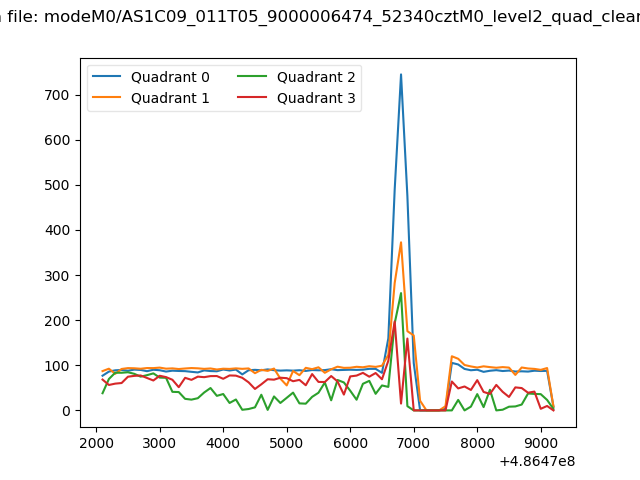 |
|
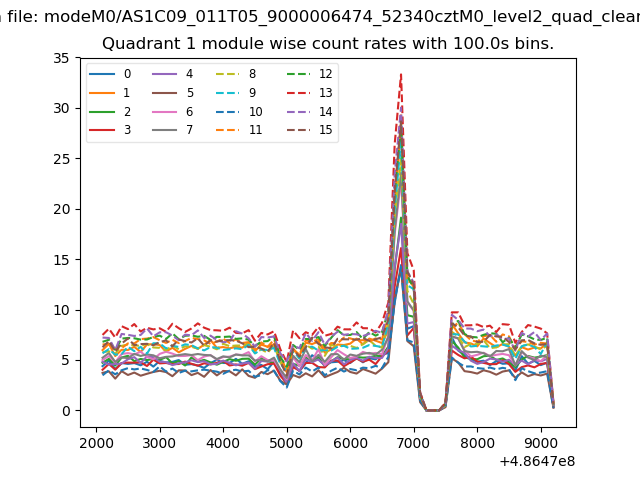
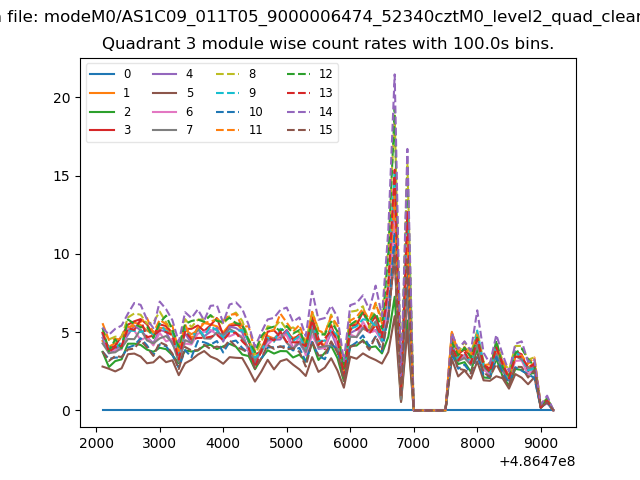
| Module-wise count rates for Quadrant A Data is divided into 100 sec bins |
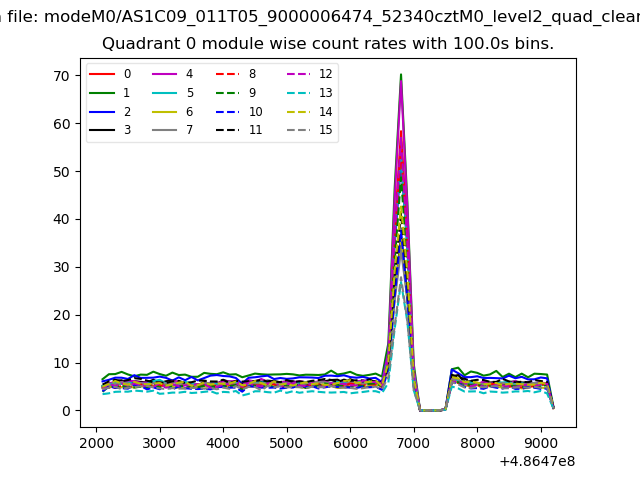 |
 |
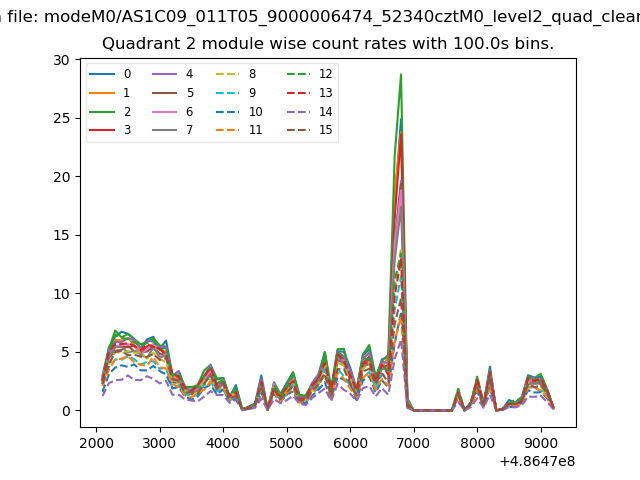
| Module-wise count rates for Quadrant B Data is divided into 100 sec bins |
 |
 |
| Module-wise count rates for Quadrant C Data is divided into 100 sec bins |
 |
 |
| Module-wise count rates for Quadrant D Data is divided into 100 sec bins |
 |
 |
| Parameter | Plot |
|---|---|
| CZT HV Monitor | 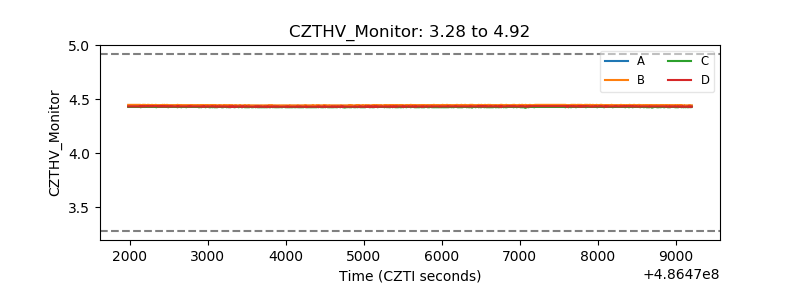 |
| D_VDD | 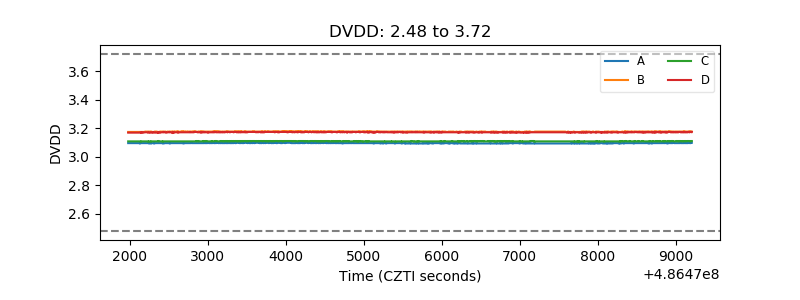 |
| Temperature 1 | 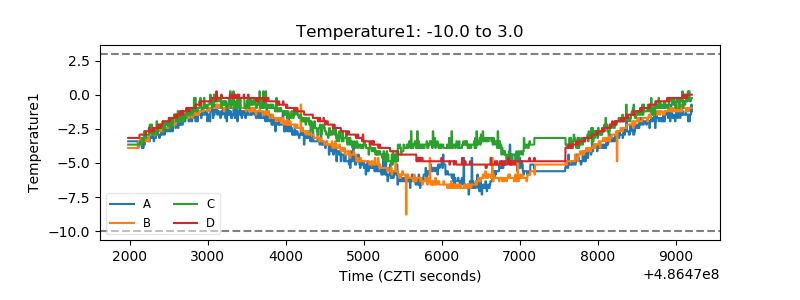 |
| Veto HV Monitor | 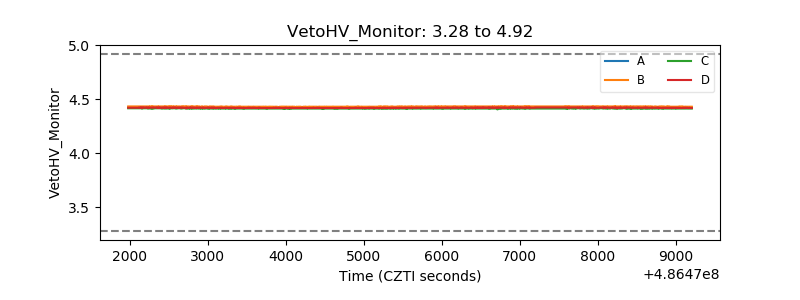 |
| Veto LLD | 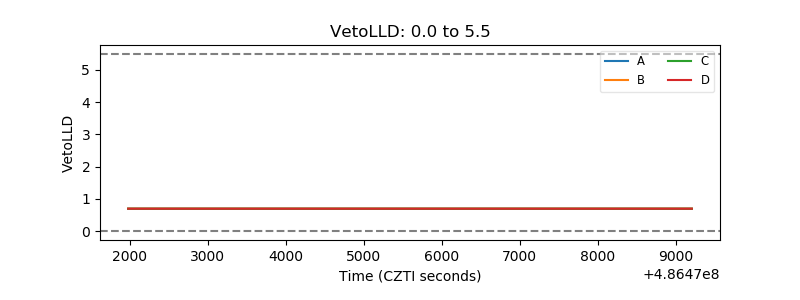 |
| Alpha Counter | 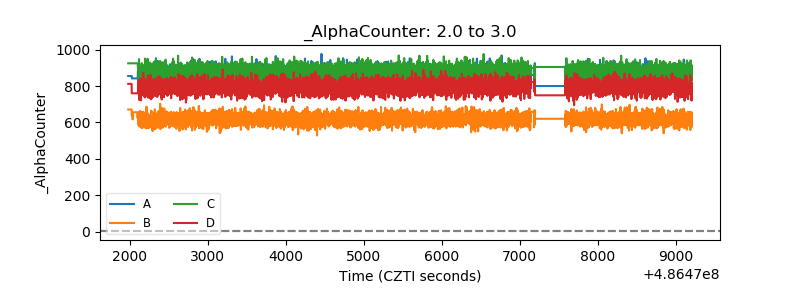 |
| _CPM_Rate | 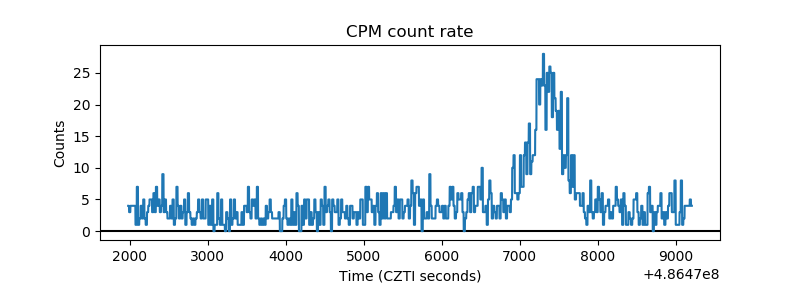 |
| CZT Counter | 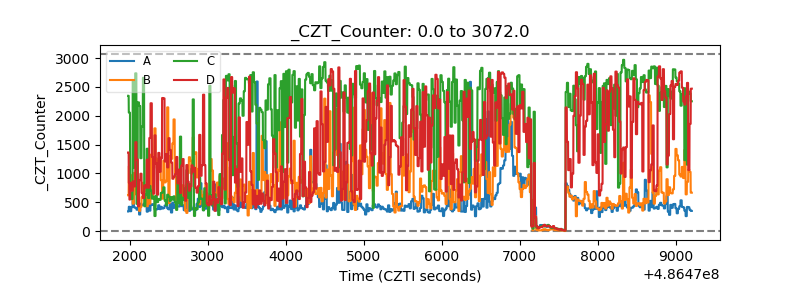 |
| +2.5 Volts monitor |  |
| +5 Volts monitor |  |
| _ROLL_ROT | 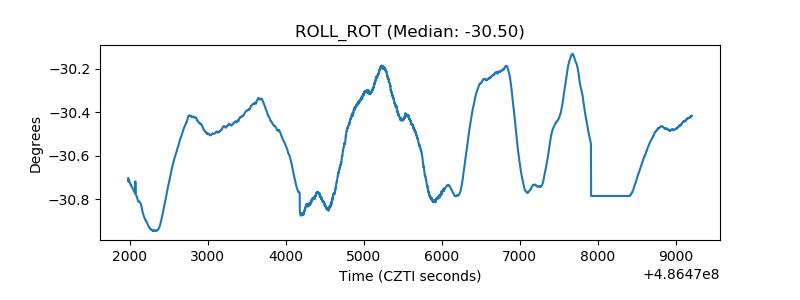 |
| _Roll_DEC | 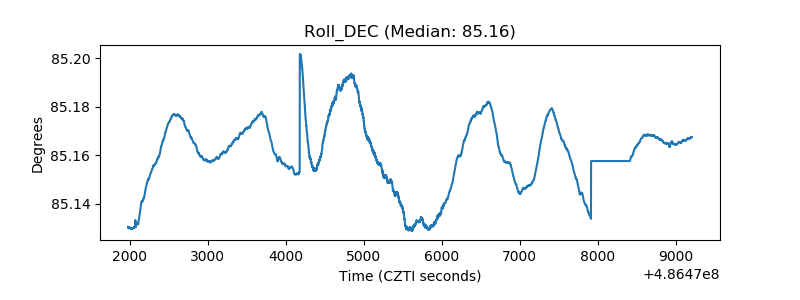 |
| _Roll_RA | 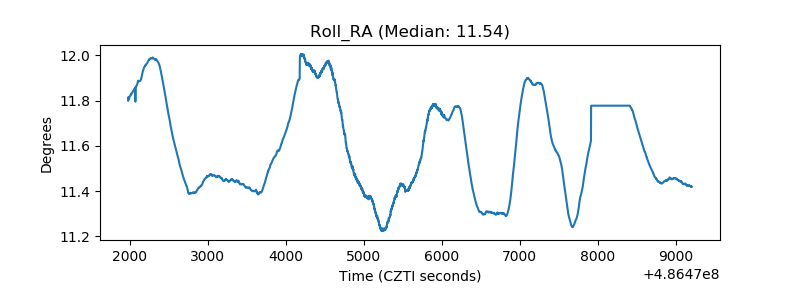 |
| Veto Counter | 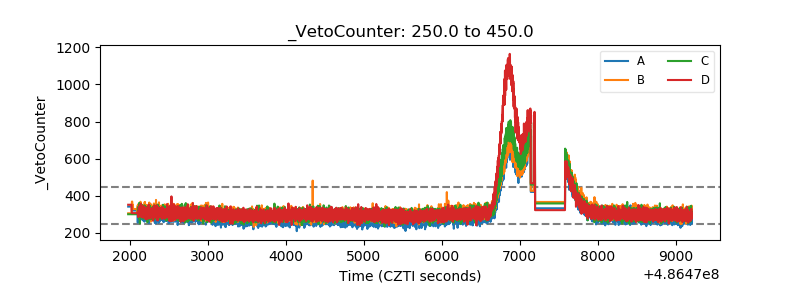 |