| Param | Original file | Final file |
|---|---|---|
| Filename | modeM0/AS1A13_037T01_9000006476cztM0_level2.fits | modeM0/AS1A13_037T01_9000006476cztM0_level2_quad_clean.evt |
| Size (bytes) | 5,241,568,320 | 1,236,608,640 |
| Size | 4.9 GB | 1.2 GB |
| Events in quadrant A | 41,893,646 | 2,826,932 |
| Events in quadrant B | 40,591,077 | 2,502,487 |
| Events in quadrant C | 33,231,814 | 1,942,033 |
| Events in quadrant D | 13,601,620 | 911,490 |
| Mode M9 | |||
|---|---|---|---|
| Quadrant | BADHDUFLAG | Total packets | Discarded packets |
| A | 0 | 477 | 0 |
| B | 0 | 478 | 0 |
| C | 0 | 480 | 0 |
| D | 0 | 478 | 0 |
| Mode M0 | |||
|---|---|---|---|
| Quadrant | BADHDUFLAG | Total packets | Discarded packets |
| A | 0 | 991895 | 0 |
| B | 0 | 1293537 | 0 |
| C | 0 | 1911240 | 0 |
| D | 0 | 2812796 | 0 |
| Mode SS | |||
|---|---|---|---|
| Quadrant | BADHDUFLAG | Total packets | Discarded packets |
| A | 0 | 8575 | 0 |
| B | 0 | 8632 | 0 |
| C | 0 | 8647 | 0 |
| D | 0 | 8651 | 0 |
| Quadrant | Total seconds | Saturated seconds | Saturation percentage |
|---|---|---|---|
| A | 427539 | 12438 | 2.909208% |
| B | 427229 | 39988 | 9.359852% |
| C | 426381 | 118791 | 27.860294% |
| D | 427009 | 287336 | 67.290385% |
Noise dominated data is calculated using 1-second bins in cleaned event files. If a bin has >2000 counts, and if more than 50% of those come from <1% of pixels, then it is considered to be noise-dominated and hence unusable.
| Quadrant | # 1 sec bins | Bins with >0 counts | Bins with >2000 counts | High rate bins dominated by noise | Noise dominated (total time) | Noise dominated (detector-on time) | Marked lightcurve |
|---|---|---|---|---|---|---|---|
| A | 535152 | 428652 | 0 | 0 | 0.00% | 0.00% | 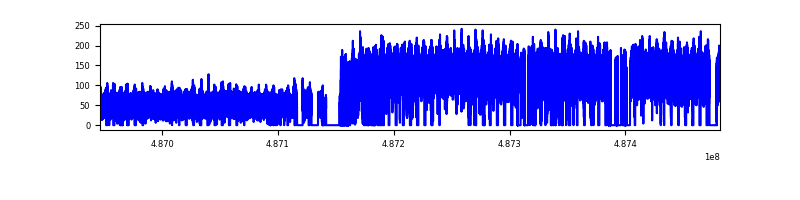 |
| B | 535152 | 428093 | 0 | 0 | 0.00% | 0.00% | 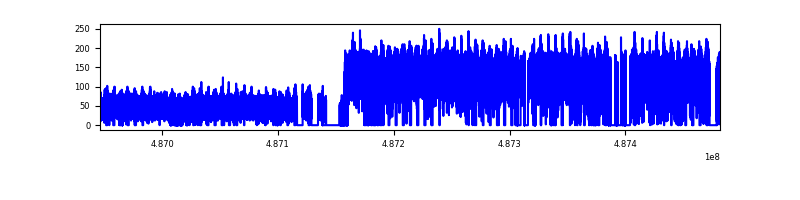 |
| C | 535152 | 423955 | 0 | 0 | 0.00% | 0.00% | 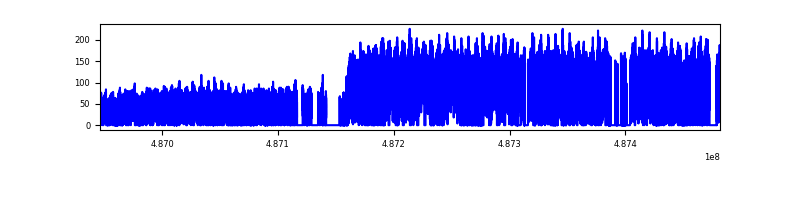 |
| D | 535152 | 401302 | 0 | 0 | 0.00% | 0.00% | 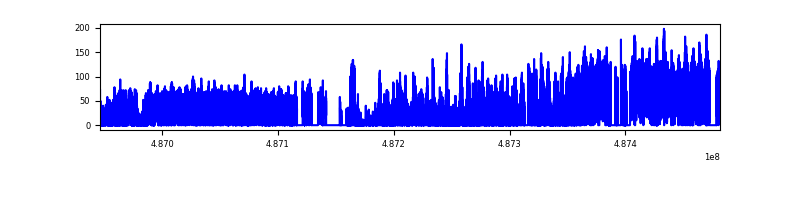 |
Top three noisy pixels from each quadrant. If the there are fewer than three noisy pixels in the level2.evt file, extra rows are filled as -1
| Pixel properties | Quadrant properties | ||||||
|---|---|---|---|---|---|---|---|
| Quadrant | DetID | PixID | Counts | Sigma | Mean | Median | Sigma |
| A | 14 | 188 | 30714 | 7.17 | 11157 | 10633 | 2800.3 |
| A | 9 | 255 | 27780 | 6.12 | 11157 | 10633 | 2800.3 |
| A | 14 | 204 | 26001 | 5.49 | 11157 | 10633 | 2800.3 |
| B | 2 | 9 | 29179 | 7.77 | 10936 | 10558 | 2397.5 |
| B | 2 | 8 | 25221 | 6.12 | 10936 | 10558 | 2397.5 |
| B | 5 | 63 | 23610 | 5.44 | 10936 | 10558 | 2397.5 |
| C | 6 | 179 | 23857 | 6.11 | 9036 | 8686 | 2483.4 |
| C | -1 | -1 | -1 | -1.0 | 9036 | 8686 | 2483.4 |
| C | -1 | -1 | -1 | -1.0 | 9036 | 8686 | 2483.4 |
| D | 6 | 218 | 11217 | 6.77 | 3961 | 3631 | 1121.0 |
| D | 6 | 91 | 9788 | 5.49 | 3961 | 3631 | 1121.0 |
| D | 6 | 232 | 9566 | 5.29 | 3961 | 3631 | 1121.0 |
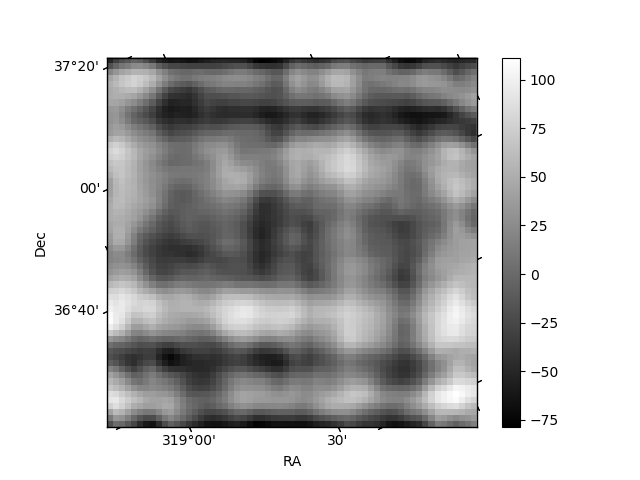
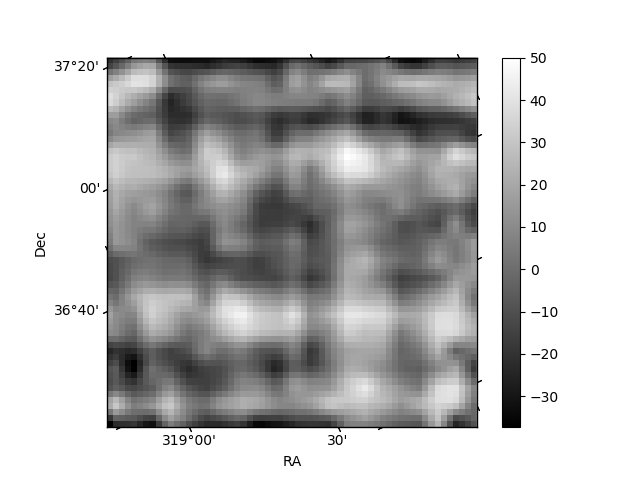
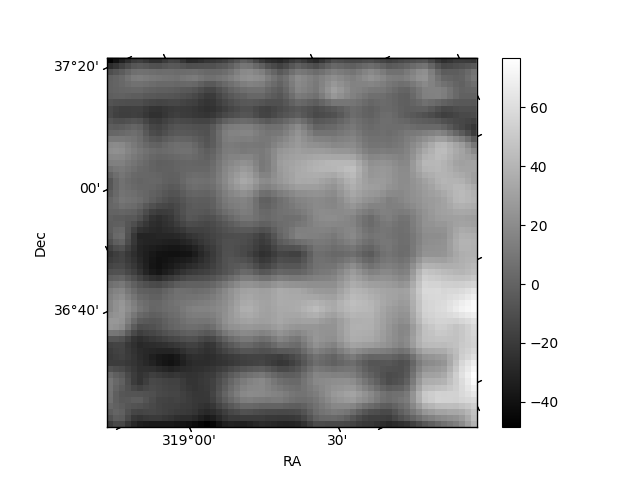
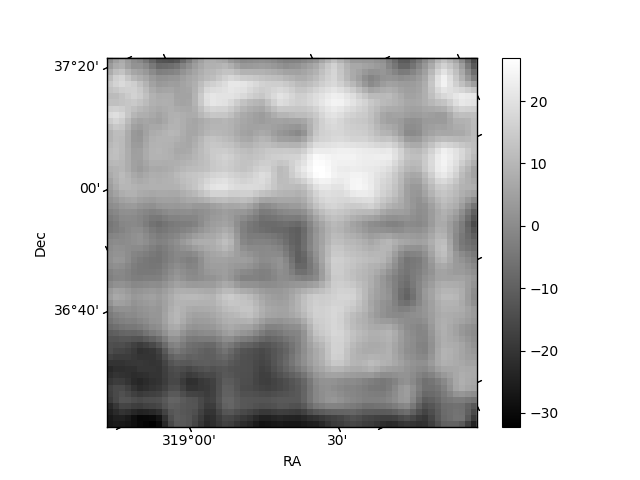
Histogram calculated using DETX and DETY for each event in the final _common_clean file
| Quadrant A | 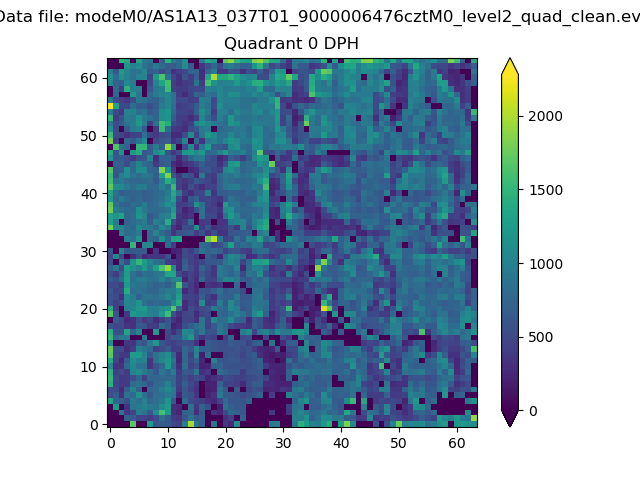 |
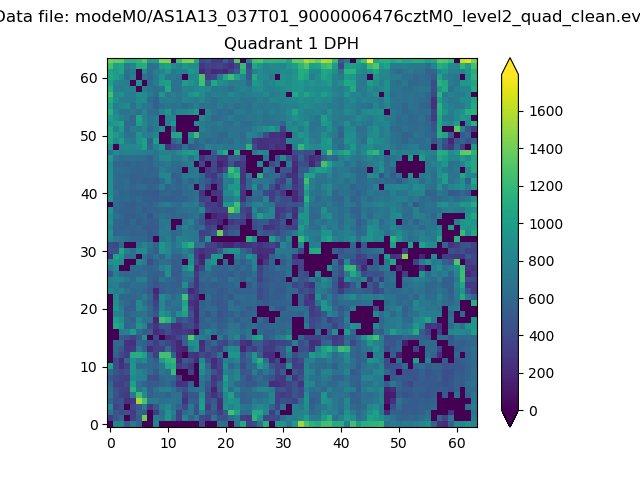 |
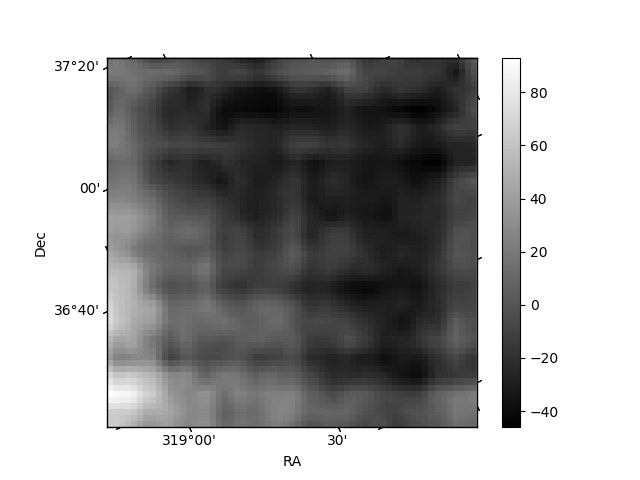
Quadrant B |
|---|---|---|---|
| Quadrant D | 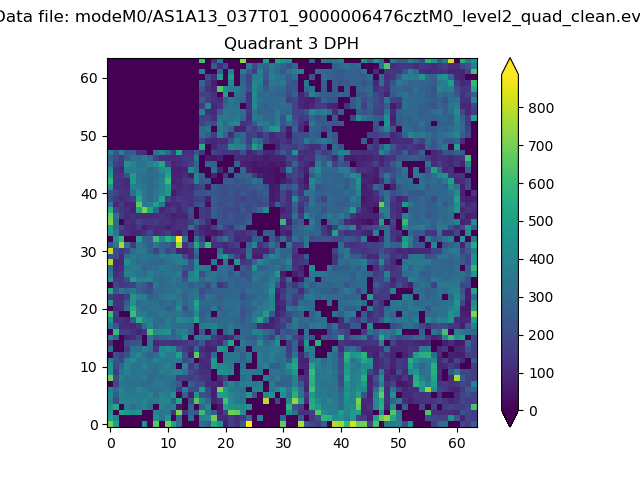 |
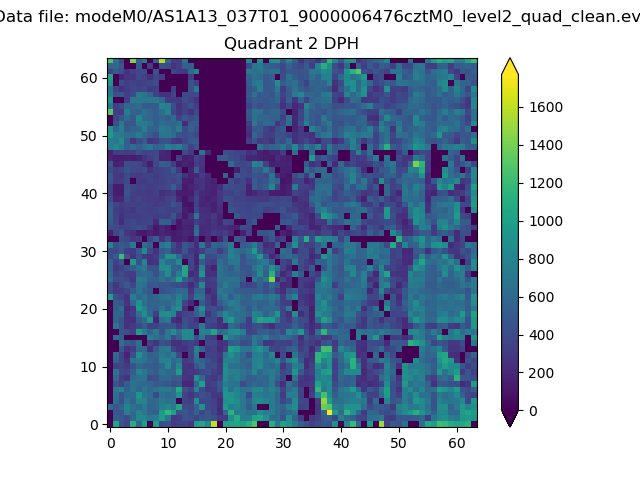 |
Quadrant C |
| Plot type | Count rate plots | Images |
|---|---|---|
| Comparison with Poisson distribution Blue bars denote a histogram of data divided into 1 sec bins. Red curve is a Poisson curve with rate = median count rate of data. |
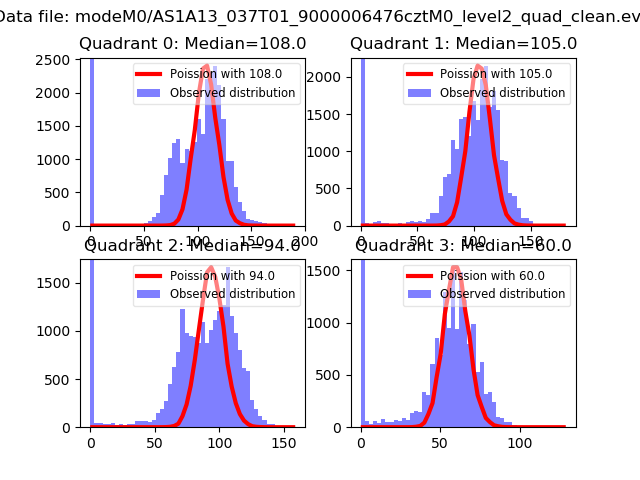 |
 |
| Quadrant-wise count rates Data is divided into 100 sec bins |
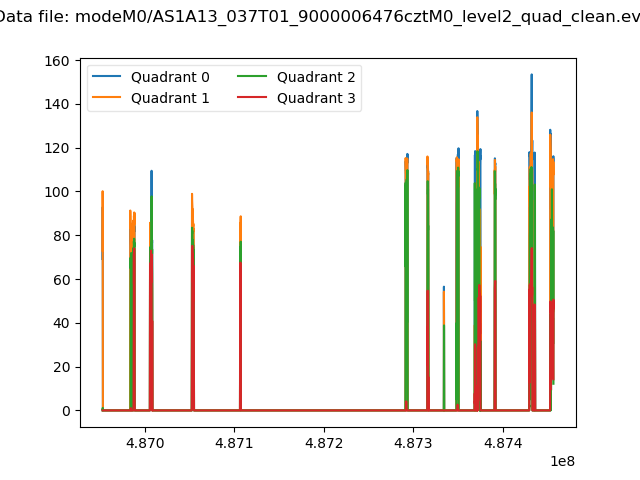 |
|
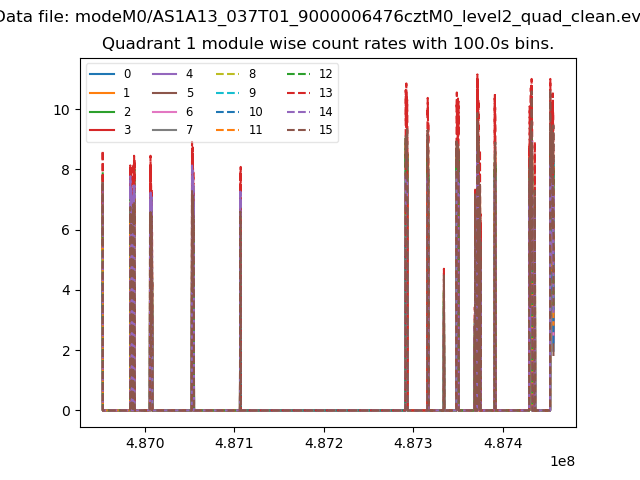
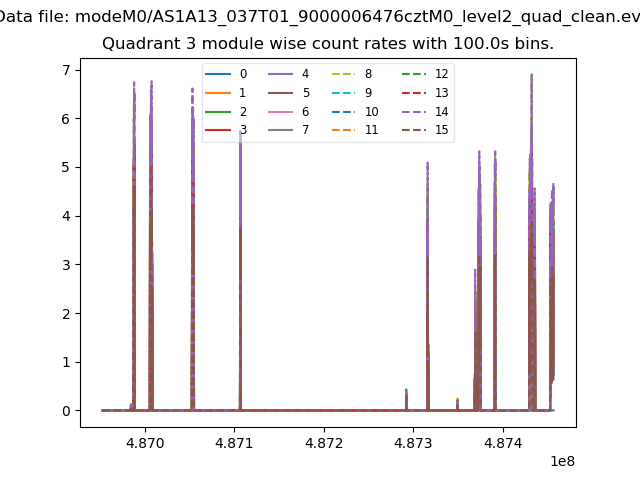
| Module-wise count rates for Quadrant A Data is divided into 100 sec bins |
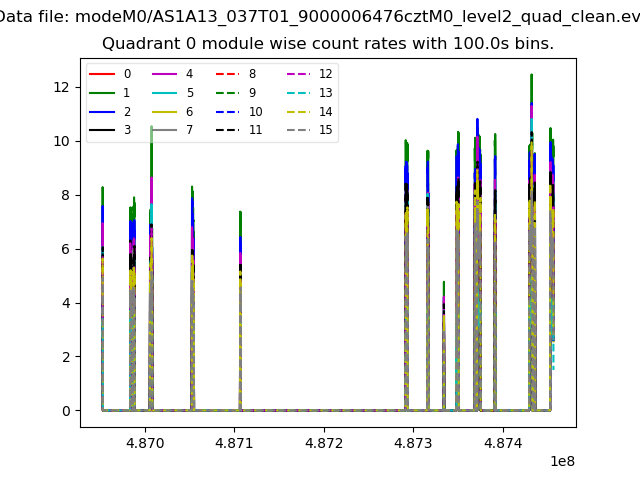 |
 |
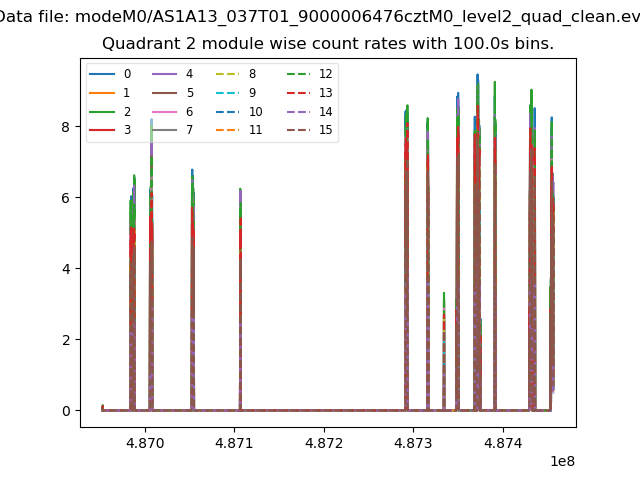
| Module-wise count rates for Quadrant B Data is divided into 100 sec bins |
 |
 |
| Module-wise count rates for Quadrant C Data is divided into 100 sec bins |
 |
 |
| Module-wise count rates for Quadrant D Data is divided into 100 sec bins |
 |
 |
| Parameter | Plot |
|---|---|
| CZT HV Monitor | 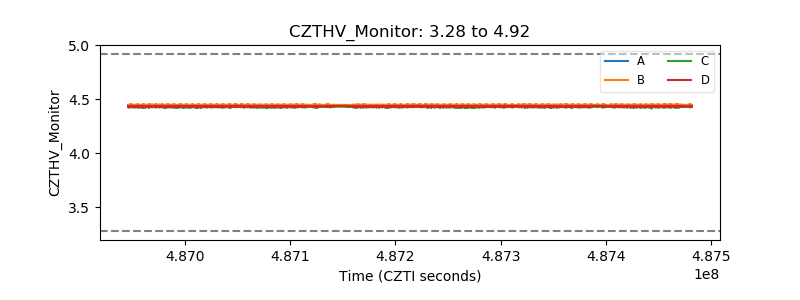 |
| D_VDD | 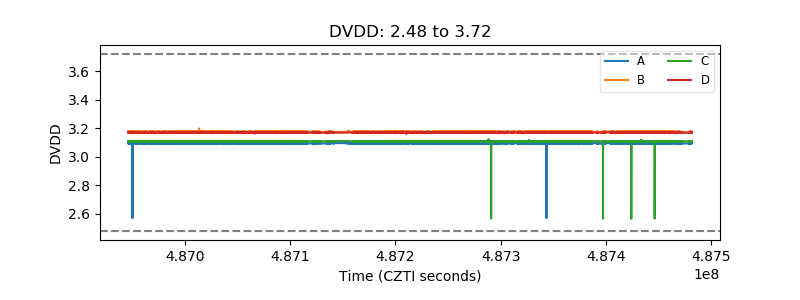 |
| Temperature 1 | 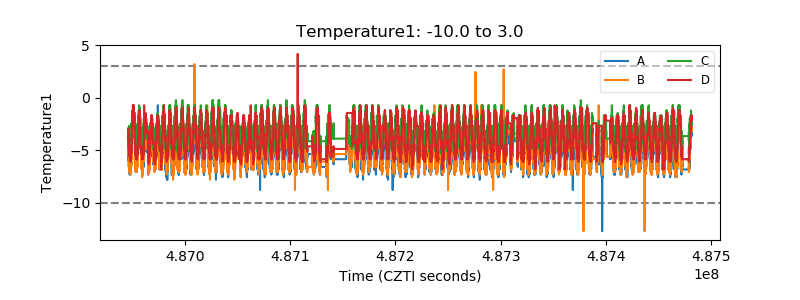 |
| Veto HV Monitor | 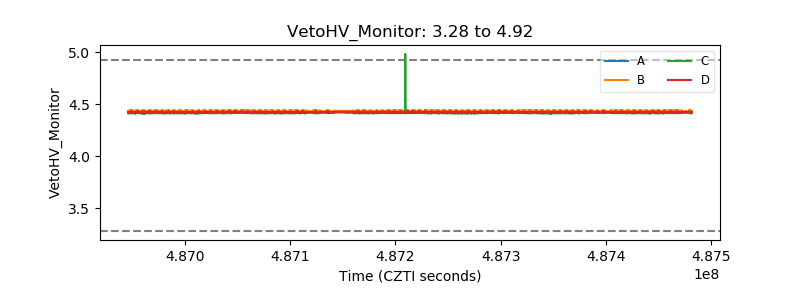 |
| Veto LLD | 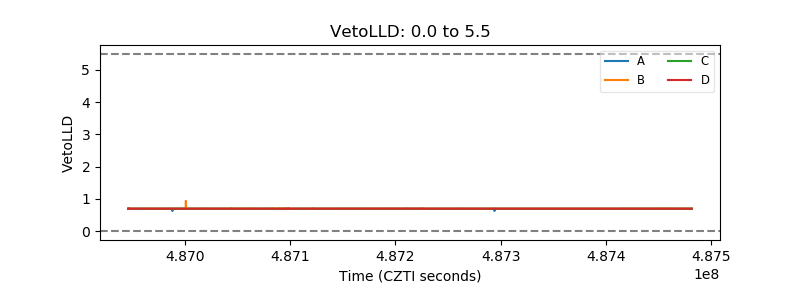 |
| Alpha Counter | 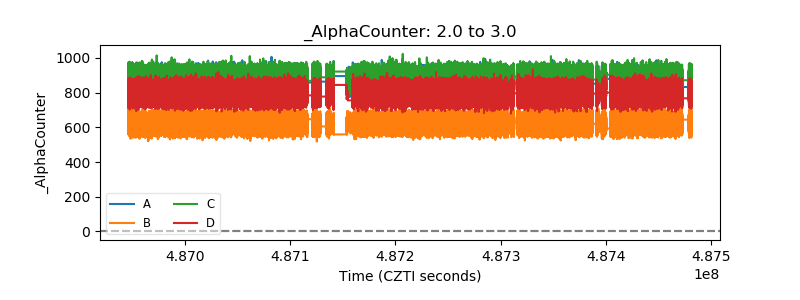 |
| _CPM_Rate | 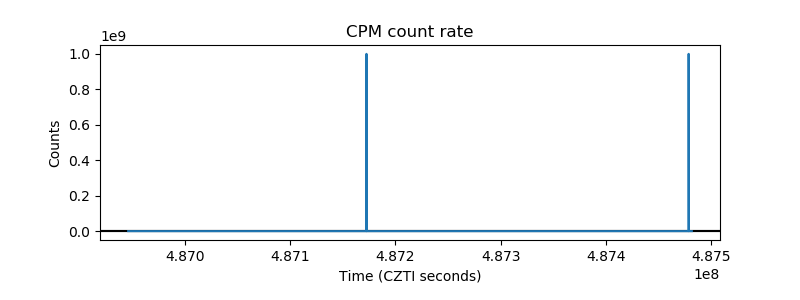 |
| CZT Counter | 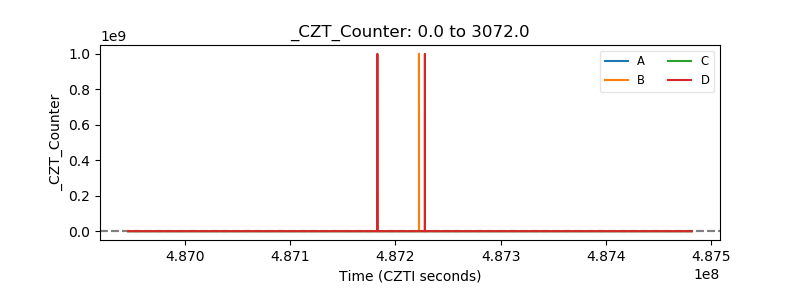 |
| +2.5 Volts monitor | 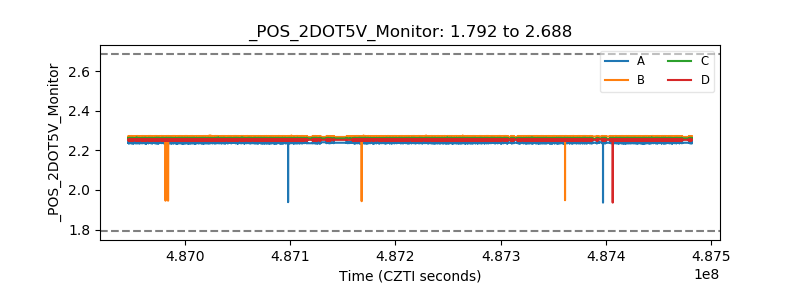 |
| +5 Volts monitor | 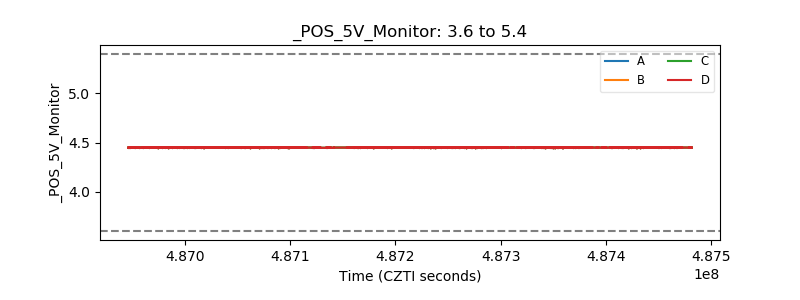 |
| _ROLL_ROT | 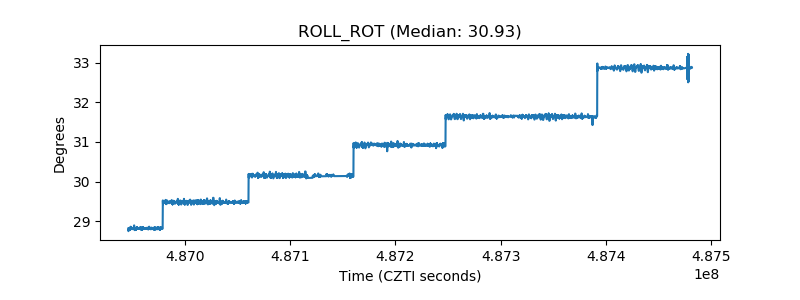 |
| _Roll_DEC | 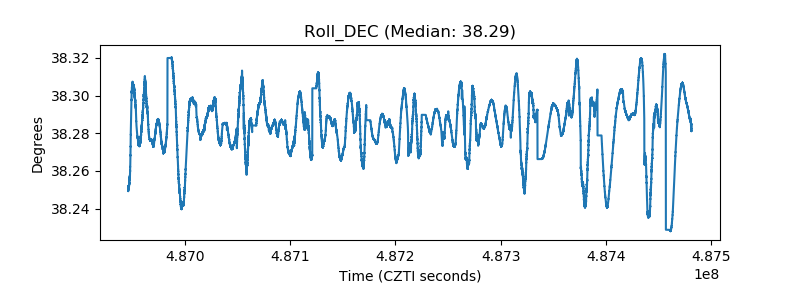 |
| _Roll_RA | 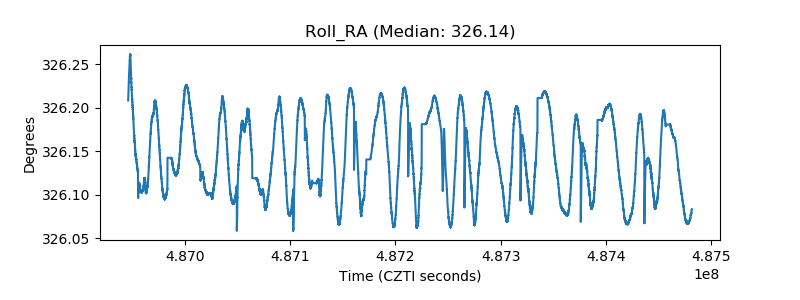 |
| Veto Counter | 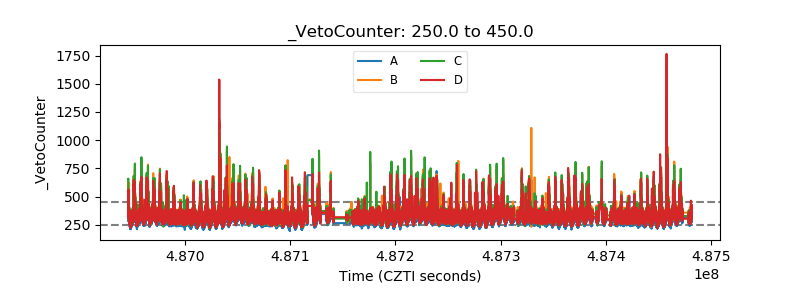 |