| Param | Original file | Final file |
|---|---|---|
| Filename | modeM0/AS1A13_037T01_9000006476_52423cztM0_level2.fits | modeM0/AS1A13_037T01_9000006476_52423cztM0_level2_quad_clean.evt |
| Size (bytes) | 961,709,760 | 66,291,840 |
| Size | 917.2 MB | 63.2 MB |
| Events in quadrant A | 3,164,749 | 648,460 |
| Events in quadrant B | 3,192,715 | 699,487 |
| Events in quadrant C | 14,661,966 | 175,953 |
| Events in quadrant D | 14,060,746 | 17,042 |
| Mode M9 | |||
|---|---|---|---|
| Quadrant | BADHDUFLAG | Total packets | Discarded packets |
| A | 0 | 22 | 0 |
| B | 0 | 22 | 0 |
| C | 0 | 22 | 0 |
| D | 0 | 22 | 0 |
| Mode M0 | |||
|---|---|---|---|
| Quadrant | BADHDUFLAG | Total packets | Discarded packets |
| A | 0 | 14562 | 16 |
| B | 0 | 14497 | 9 |
| C | 0 | 48283 | 167 |
| D | 0 | 46520 | 168 |
| Mode SS | |||
|---|---|---|---|
| Quadrant | BADHDUFLAG | Total packets | Discarded packets |
| A | 0 | 138 | 0 |
| B | 0 | 137 | 0 |
| C | 0 | 137 | 1 |
| D | 0 | 138 | 0 |
| Quadrant | Total seconds | Saturated seconds | Saturation percentage |
|---|---|---|---|
| A | 6695 | 66 | 0.985810% |
| B | 6702 | 70 | 1.044464% |
| C | 6681 | 4938 | 73.911091% |
| D | 6679 | 6543 | 97.963767% |
Noise dominated data is calculated using 1-second bins in cleaned event files. If a bin has >2000 counts, and if more than 50% of those come from <1% of pixels, then it is considered to be noise-dominated and hence unusable.
| Quadrant | # 1 sec bins | Bins with >0 counts | Bins with >2000 counts | High rate bins dominated by noise | Noise dominated (total time) | Noise dominated (detector-on time) | Marked lightcurve |
|---|---|---|---|---|---|---|---|
| A | 8921 | 6704 | 41 | 41 | 0.46% | 0.61% | 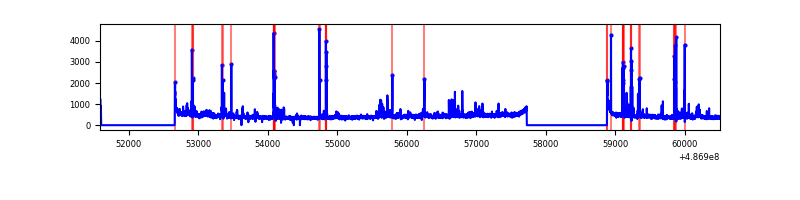 |
| B | 8922 | 6706 | 19 | 19 | 0.21% | 0.28% | 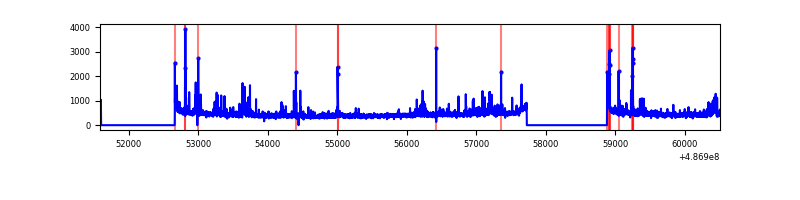 |
| C | 8921 | 6698 | 4682 | 4682 | 52.48% | 69.90% | 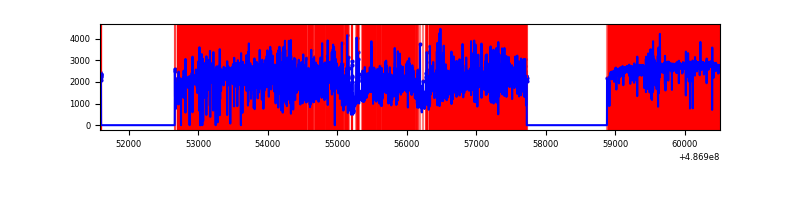 |
| D | 8921 | 6681 | 3834 | 3834 | 42.98% | 57.39% | 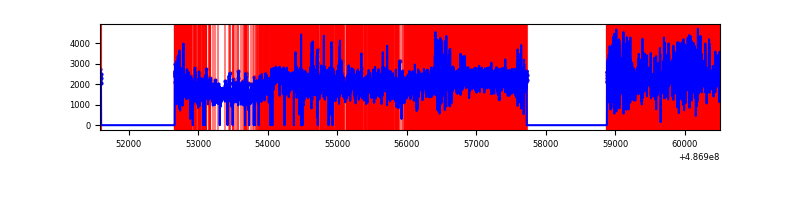 |
Top three noisy pixels from each quadrant. If the there are fewer than three noisy pixels in the level2.evt file, extra rows are filled as -1
| Pixel properties | Quadrant properties | ||||||
|---|---|---|---|---|---|---|---|
| Quadrant | DetID | PixID | Counts | Sigma | Mean | Median | Sigma |
| A | 5 | 240 | 167059 | 966.45 | 691 | 675 | 172.2 |
| A | 4 | 61 | 55080 | 316.01 | 691 | 675 | 172.2 |
| A | 8 | 25 | 46484 | 266.08 | 691 | 675 | 172.2 |
| B | 4 | 171 | 147134 | 977.64 | 696 | 671 | 149.8 |
| B | 10 | 247 | 39823 | 261.34 | 696 | 671 | 149.8 |
| B | 4 | 81 | 39784 | 261.08 | 696 | 671 | 149.8 |
| C | 9 | 38 | 3801332 | 34519.85 | 393 | 391 | 110.1 |
| C | 3 | 242 | 3403270 | 30904.68 | 393 | 391 | 110.1 |
| C | 1 | 45 | 2296611 | 20854.09 | 393 | 391 | 110.1 |
| D | 12 | 18 | 11588401 | 320736.27 | 115 | 109 | 36.1 |
| D | 12 | 17 | 1095239 | 30310.59 | 115 | 109 | 36.1 |
| D | 12 | 6 | 327025 | 9048.25 | 115 | 109 | 36.1 |
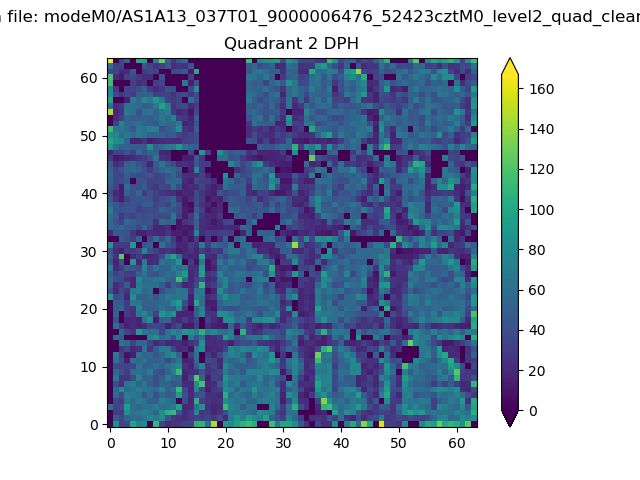
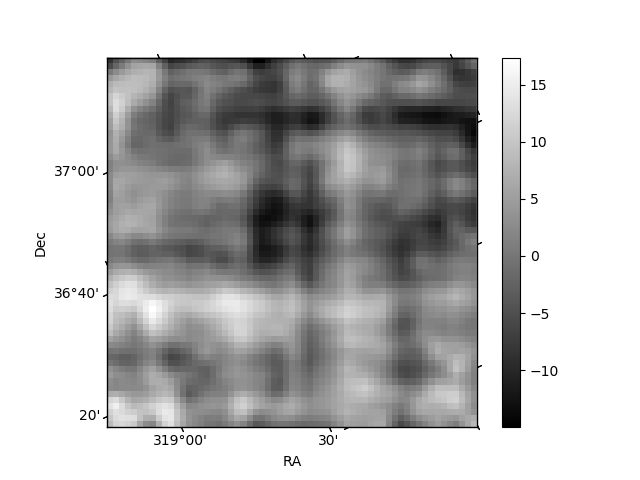
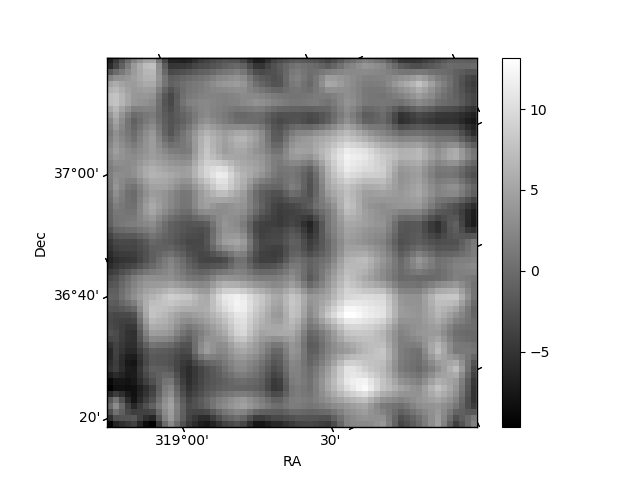
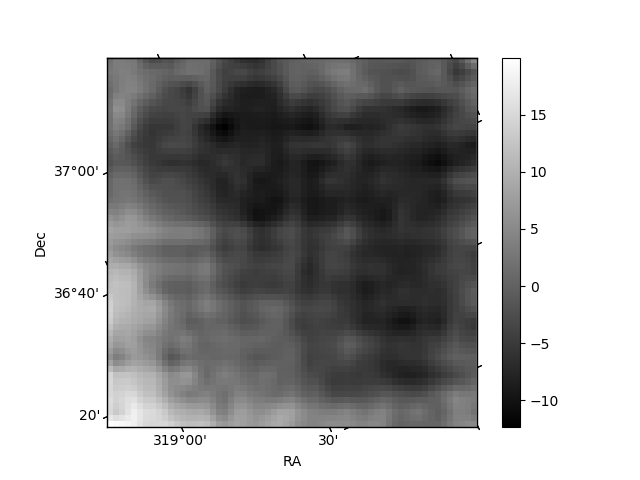
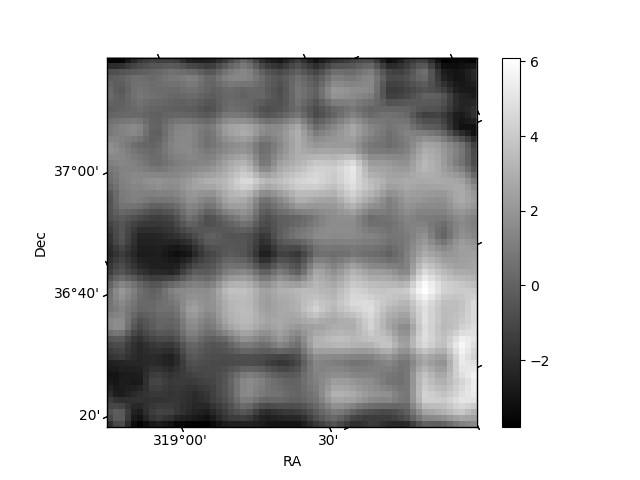
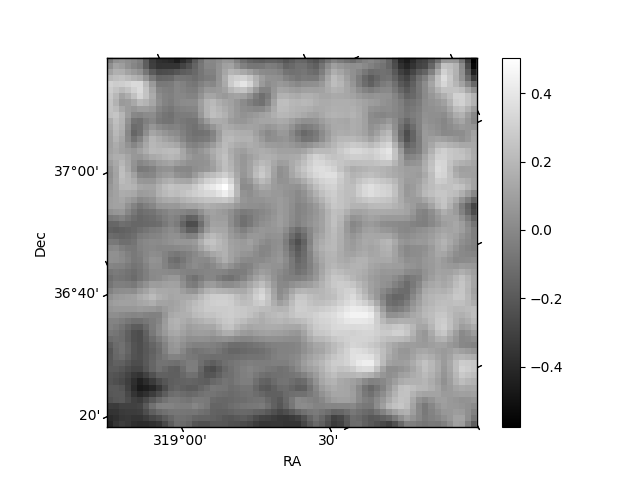
Histogram calculated using DETX and DETY for each event in the final _common_clean file
| Quadrant A | 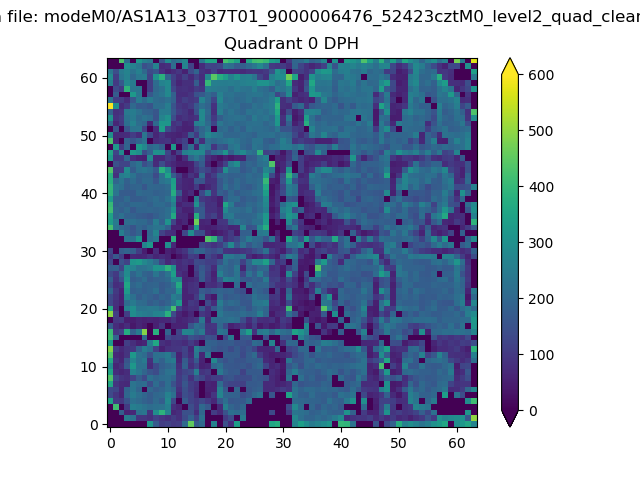 |
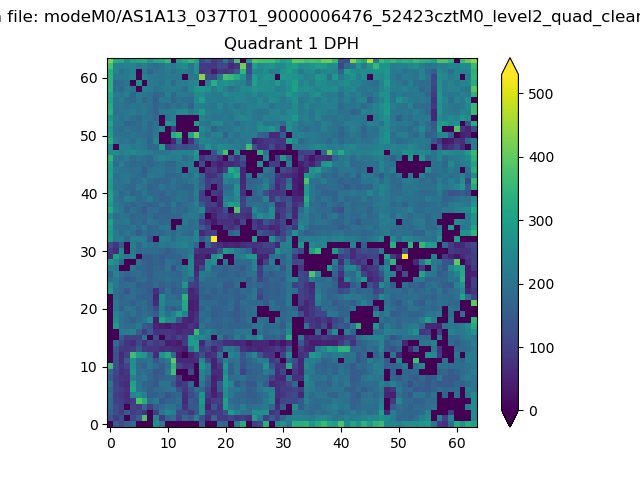 |
Quadrant B |
|---|---|---|---|
| Quadrant D | 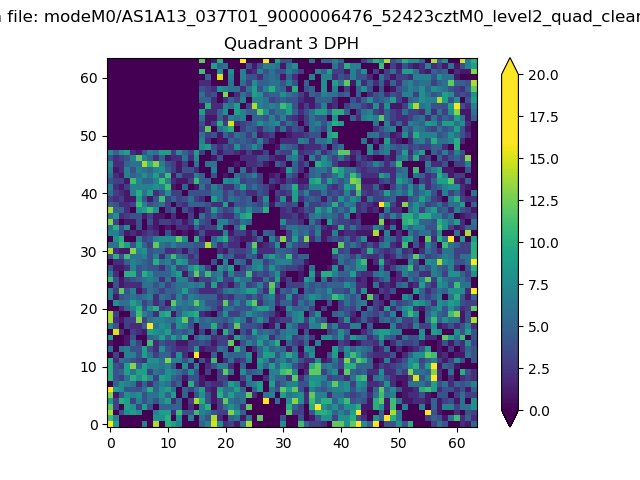 |
 |
Quadrant C |
| Plot type | Count rate plots | Images |
|---|---|---|
| Comparison with Poisson distribution Blue bars denote a histogram of data divided into 1 sec bins. Red curve is a Poisson curve with rate = median count rate of data. |
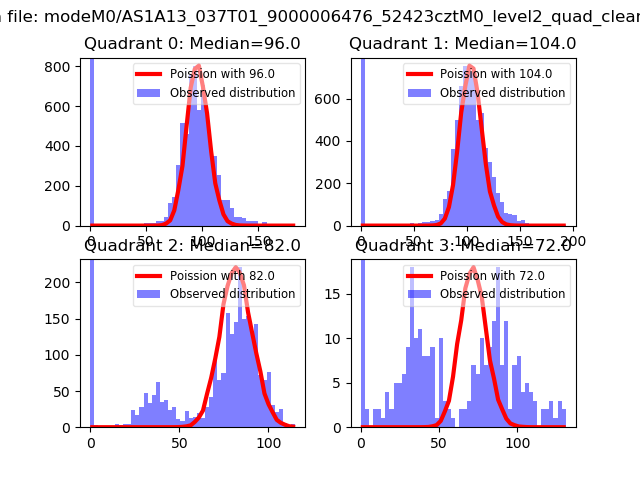 |
 |
| Quadrant-wise count rates Data is divided into 100 sec bins |
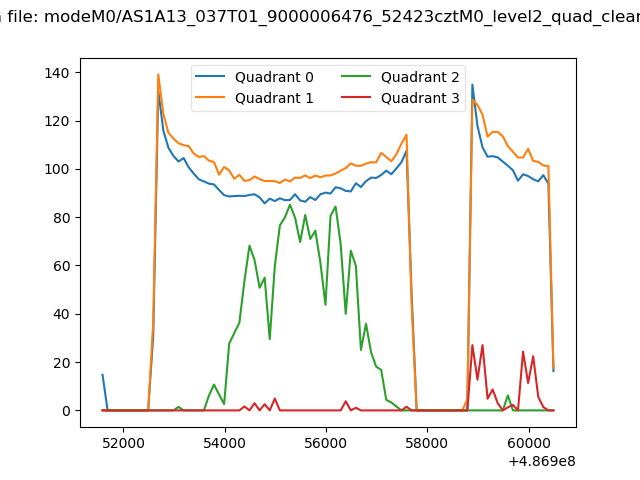 |
|
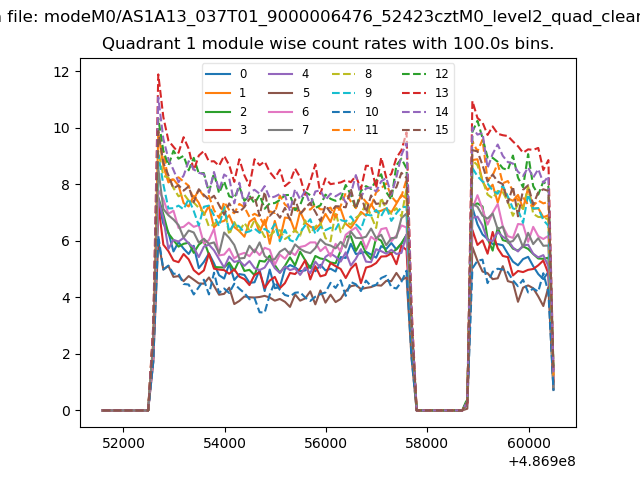
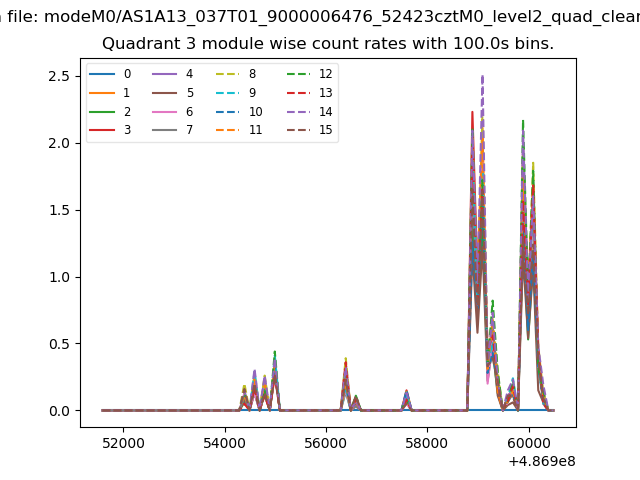
| Module-wise count rates for Quadrant A Data is divided into 100 sec bins |
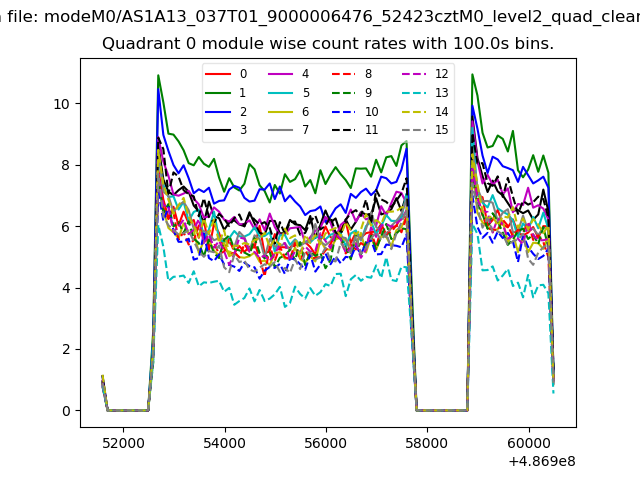 |
 |
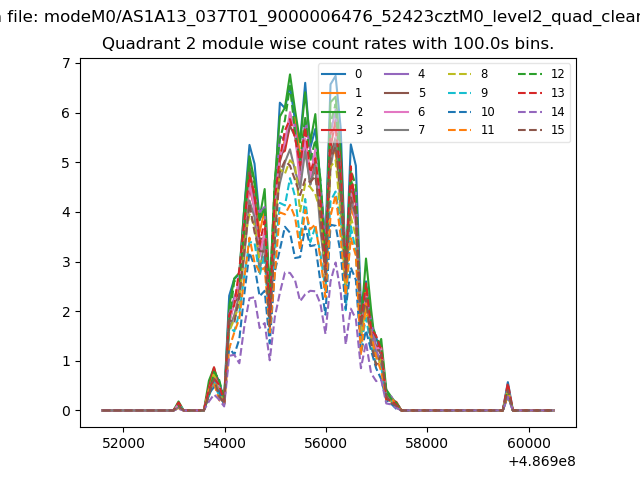
| Module-wise count rates for Quadrant B Data is divided into 100 sec bins |
 |
 |
| Module-wise count rates for Quadrant C Data is divided into 100 sec bins |
 |
 |
| Module-wise count rates for Quadrant D Data is divided into 100 sec bins |
 |
 |
| Parameter | Plot |
|---|---|
| CZT HV Monitor | 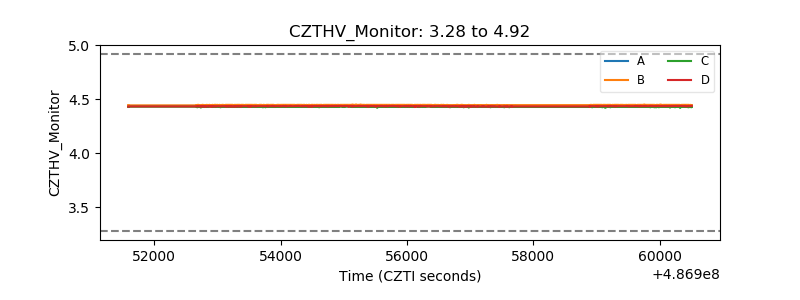 |
| D_VDD | 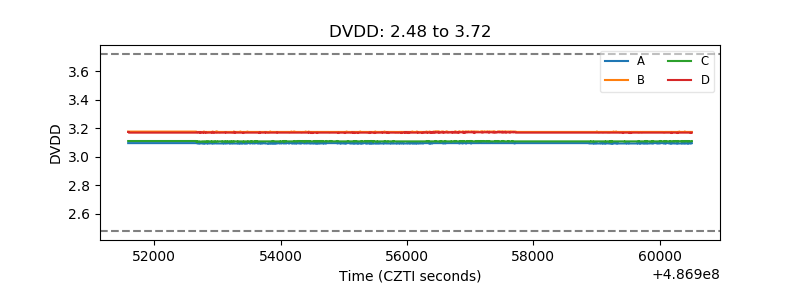 |
| Temperature 1 | 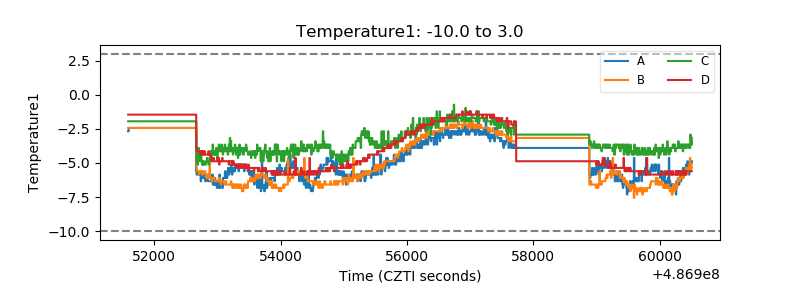 |
| Veto HV Monitor | 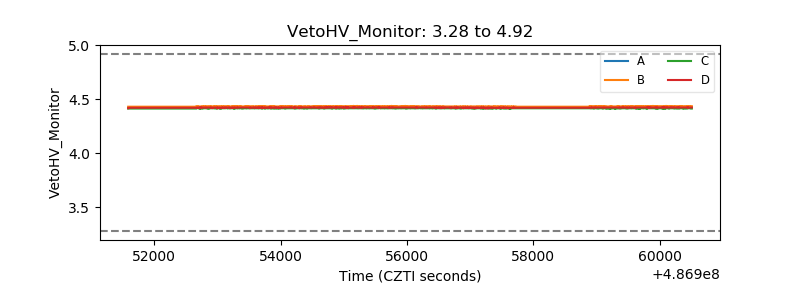 |
| Veto LLD | 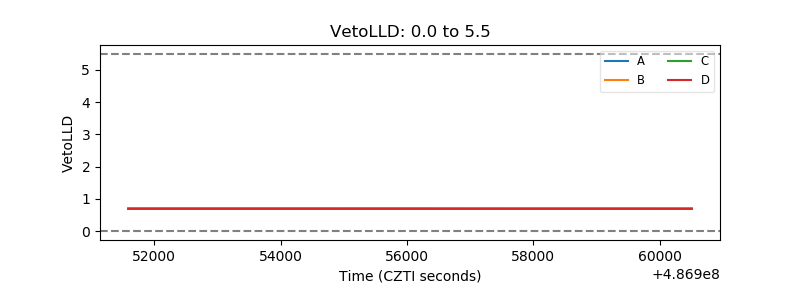 |
| Alpha Counter |  |
| _CPM_Rate | 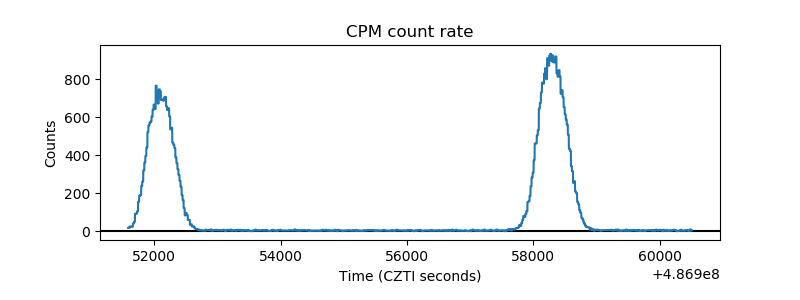 |
| CZT Counter | 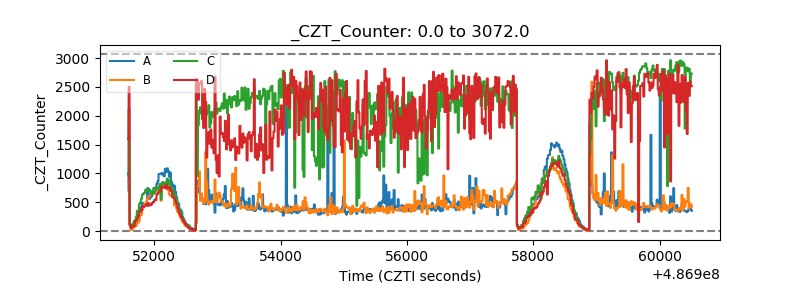 |
| +2.5 Volts monitor |  |
| +5 Volts monitor |  |
| _ROLL_ROT | 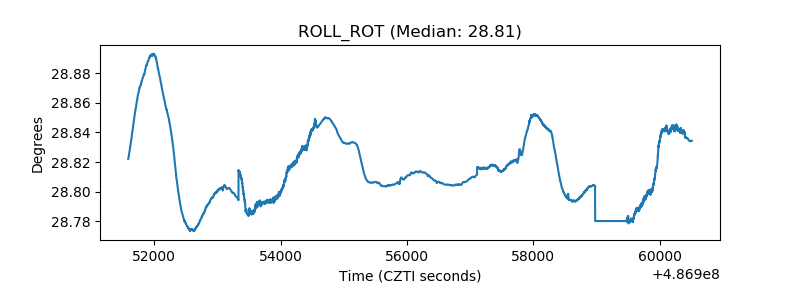 |
| _Roll_DEC | 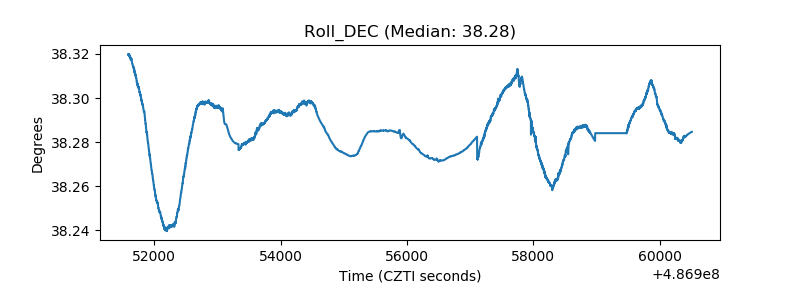 |
| _Roll_RA | 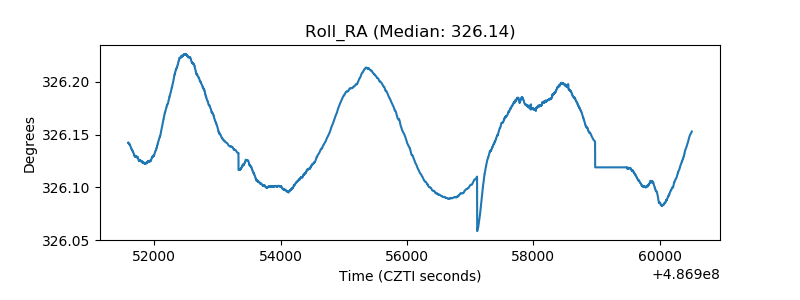 |
| Veto Counter | 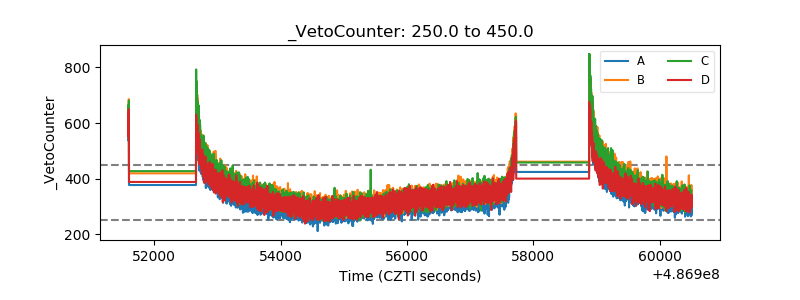 |