| Param | Original file | Final file |
|---|---|---|
| Filename | modeM0/AS1A13_037T01_9000006476_52425cztM0_level2.fits | modeM0/AS1A13_037T01_9000006476_52425cztM0_level2_quad_clean.evt |
| Size (bytes) | 811,719,360 | 67,754,880 |
| Size | 774.1 MB | 64.6 MB |
| Events in quadrant A | 3,262,553 | 565,152 |
| Events in quadrant B | 3,045,238 | 619,719 |
| Events in quadrant C | 12,553,475 | 243,821 |
| Events in quadrant D | 10,723,138 | 205,416 |
| Mode M9 | |||
|---|---|---|---|
| Quadrant | BADHDUFLAG | Total packets | Discarded packets |
| A | 0 | 11 | 0 |
| B | 0 | 11 | 0 |
| C | 0 | 11 | 0 |
| D | 0 | 11 | 0 |
| Mode M0 | |||
|---|---|---|---|
| Quadrant | BADHDUFLAG | Total packets | Discarded packets |
| A | 0 | 14097 | 15 |
| B | 0 | 13483 | 3 |
| C | 0 | 41333 | 24 |
| D | 0 | 35928 | 35 |
| Mode SS | |||
|---|---|---|---|
| Quadrant | BADHDUFLAG | Total packets | Discarded packets |
| A | 0 | 122 | 0 |
| B | 0 | 122 | 0 |
| C | 0 | 122 | 0 |
| D | 0 | 122 | 0 |
| Quadrant | Total seconds | Saturated seconds | Saturation percentage |
|---|---|---|---|
| A | 5970 | 128 | 2.144054% |
| B | 5974 | 79 | 1.322397% |
| C | 5970 | 3653 | 61.189280% |
| D | 5968 | 3732 | 62.533512% |
Noise dominated data is calculated using 1-second bins in cleaned event files. If a bin has >2000 counts, and if more than 50% of those come from <1% of pixels, then it is considered to be noise-dominated and hence unusable.
| Quadrant | # 1 sec bins | Bins with >0 counts | Bins with >2000 counts | High rate bins dominated by noise | Noise dominated (total time) | Noise dominated (detector-on time) | Marked lightcurve |
|---|---|---|---|---|---|---|---|
| A | 7160 | 5975 | 52 | 52 | 0.73% | 0.87% | 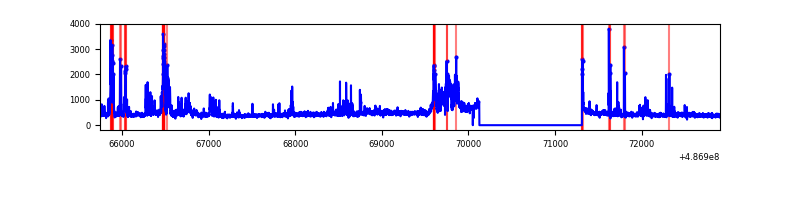 |
| B | 7160 | 5976 | 31 | 31 | 0.43% | 0.52% | 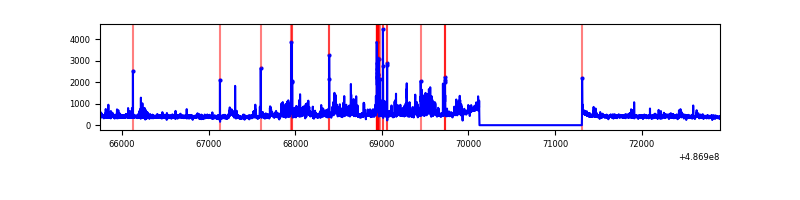 |
| C | 7159 | 5975 | 3624 | 3624 | 50.62% | 60.65% | 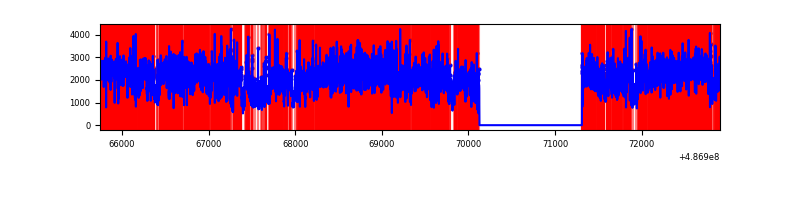 |
| D | 7159 | 5968 | 2697 | 2697 | 37.67% | 45.19% | 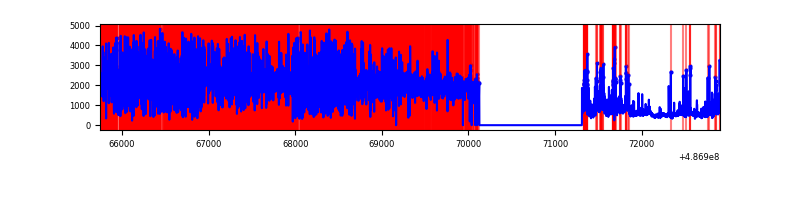 |
Top three noisy pixels from each quadrant. If the there are fewer than three noisy pixels in the level2.evt file, extra rows are filled as -1
| Pixel properties | Quadrant properties | ||||||
|---|---|---|---|---|---|---|---|
| Quadrant | DetID | PixID | Counts | Sigma | Mean | Median | Sigma |
| A | 8 | 26 | 440339 | 2821.82 | 621 | 605 | 155.8 |
| A | 15 | 174 | 157527 | 1006.98 | 621 | 605 | 155.8 |
| A | 5 | 240 | 59275 | 376.49 | 621 | 605 | 155.8 |
| B | 4 | 171 | 207719 | 1549.38 | 618 | 596 | 133.7 |
| B | 4 | 81 | 112690 | 838.51 | 618 | 596 | 133.7 |
| B | 7 | 0 | 101585 | 755.44 | 618 | 596 | 133.7 |
| C | 9 | 38 | 3881440 | 28418.59 | 487 | 483 | 136.6 |
| C | 1 | 45 | 3420393 | 25042.54 | 487 | 483 | 136.6 |
| C | 15 | 248 | 1008678 | 7382.58 | 487 | 483 | 136.6 |
| D | 12 | 18 | 8034820 | 85874.1 | 317 | 302 | 93.6 |
| D | 12 | 17 | 354304 | 3783.63 | 317 | 302 | 93.6 |
| D | 6 | 42 | 281866 | 3009.4 | 317 | 302 | 93.6 |
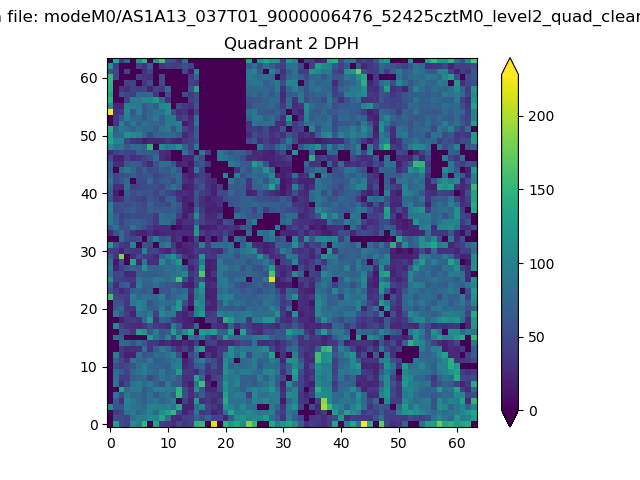
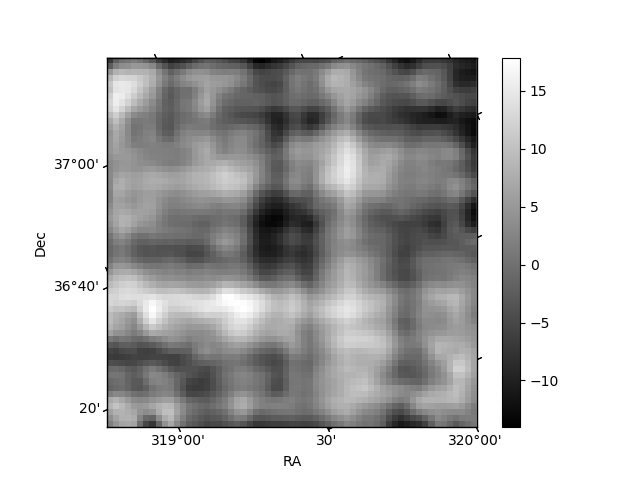
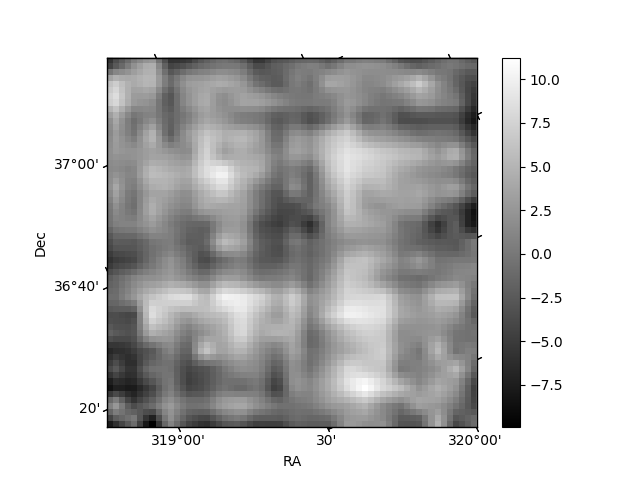
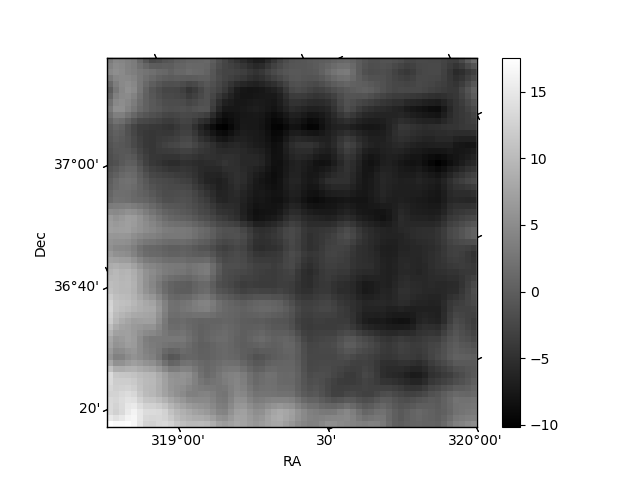
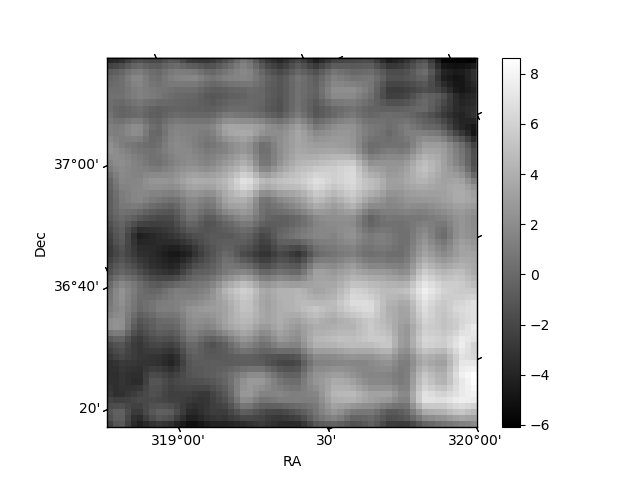
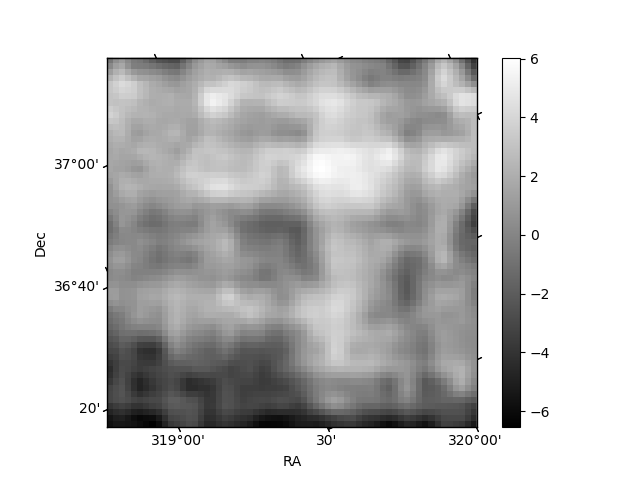
Histogram calculated using DETX and DETY for each event in the final _common_clean file
| Quadrant A | 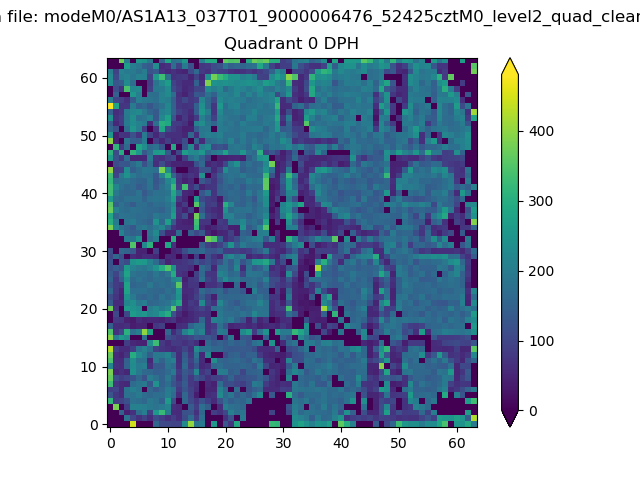 |
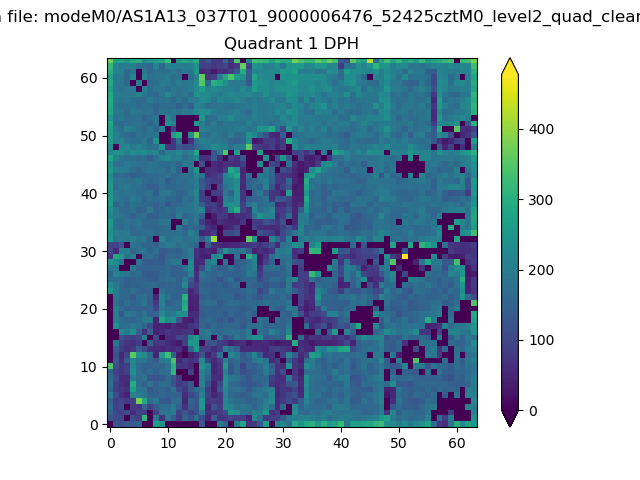 |
Quadrant B |
|---|---|---|---|
| Quadrant D | 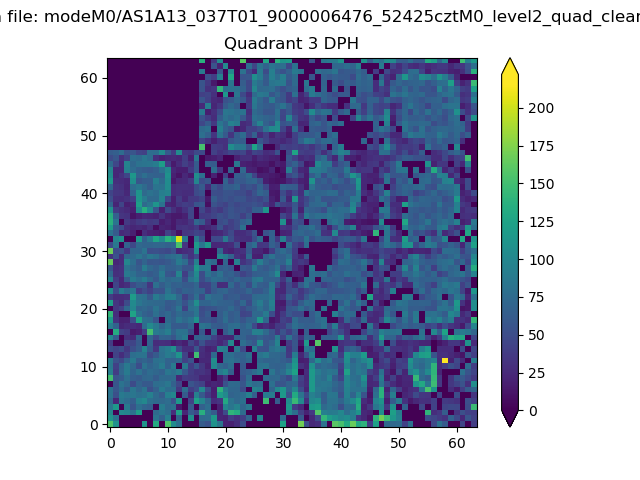 |
 |
Quadrant C |
| Plot type | Count rate plots | Images |
|---|---|---|
| Comparison with Poisson distribution Blue bars denote a histogram of data divided into 1 sec bins. Red curve is a Poisson curve with rate = median count rate of data. |
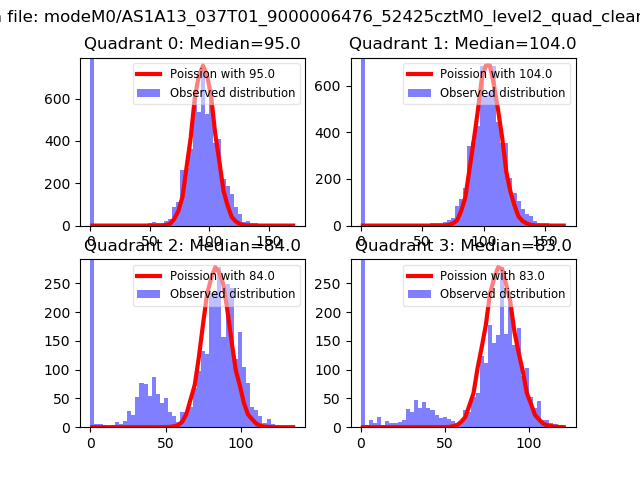 |
 |
| Quadrant-wise count rates Data is divided into 100 sec bins |
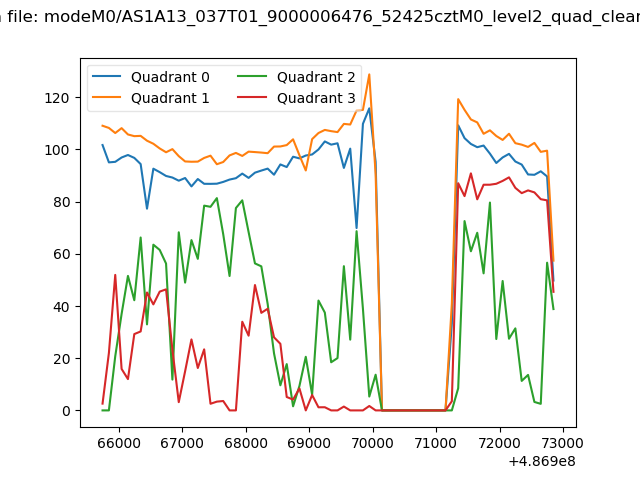 |
|
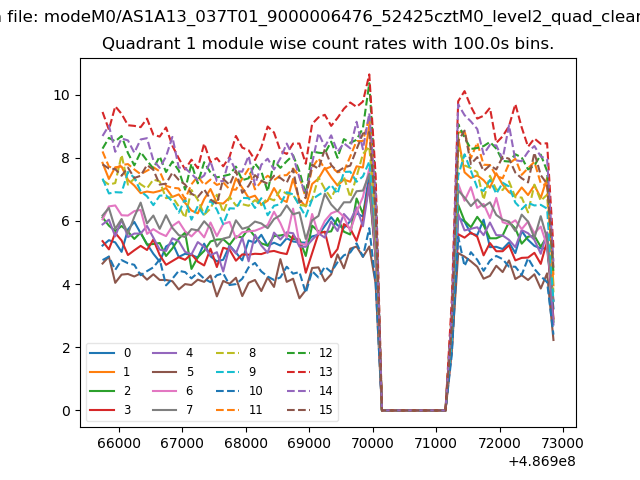
| Module-wise count rates for Quadrant A Data is divided into 100 sec bins |
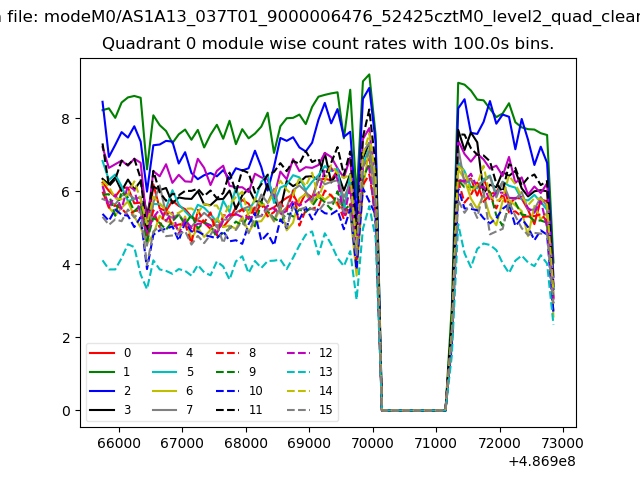 |
 |
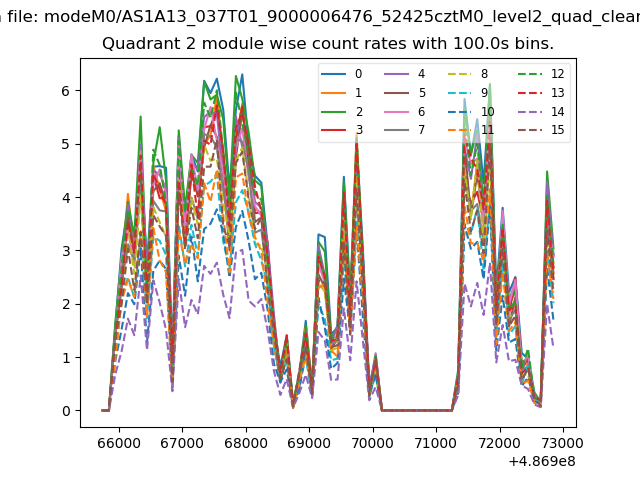
| Module-wise count rates for Quadrant B Data is divided into 100 sec bins |
 |
 |
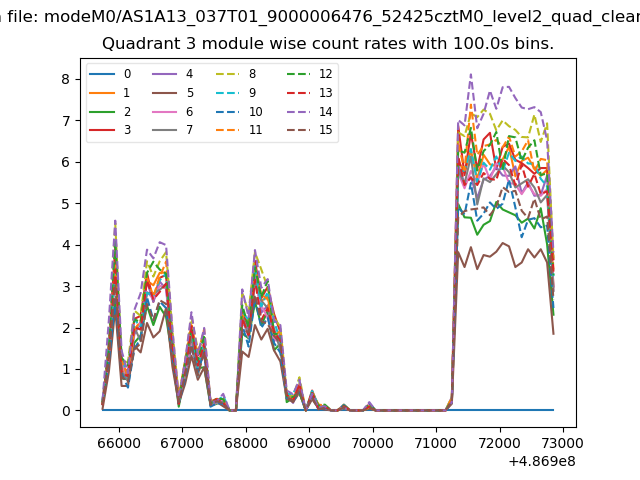
| Module-wise count rates for Quadrant C Data is divided into 100 sec bins |
 |
 |
| Module-wise count rates for Quadrant D Data is divided into 100 sec bins |
 |
 |
| Parameter | Plot |
|---|---|
| CZT HV Monitor |  |
| D_VDD | 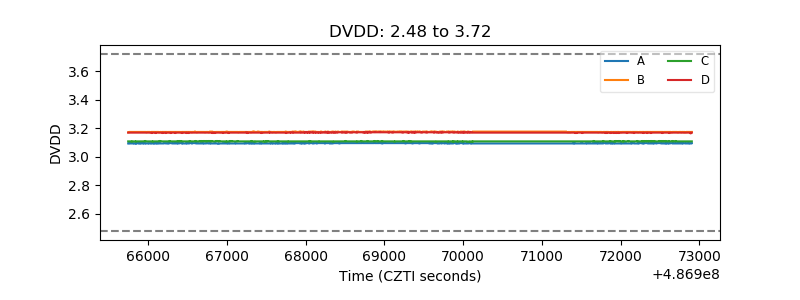 |
| Temperature 1 | 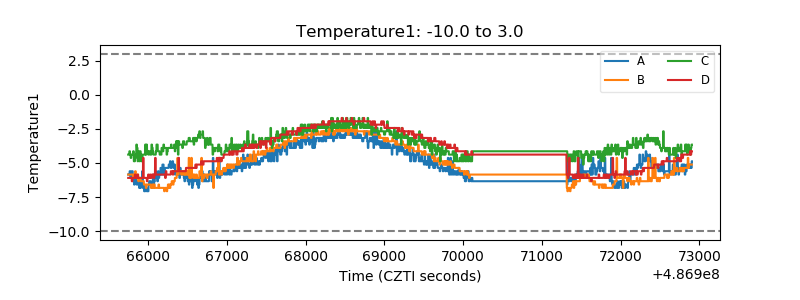 |
| Veto HV Monitor | 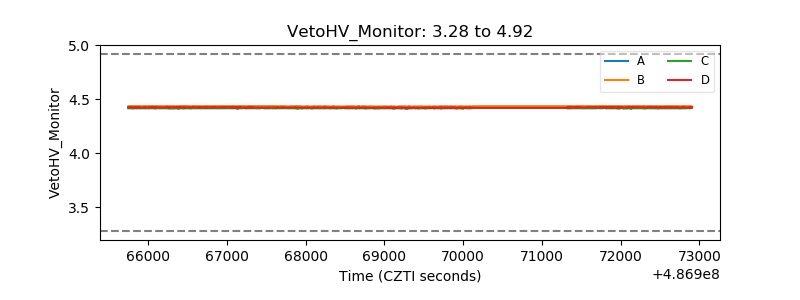 |
| Veto LLD | 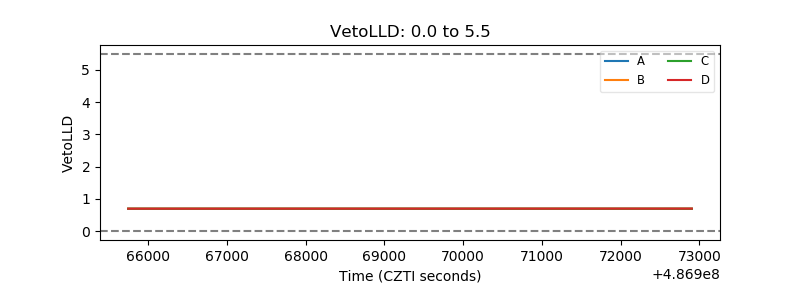 |
| Alpha Counter | 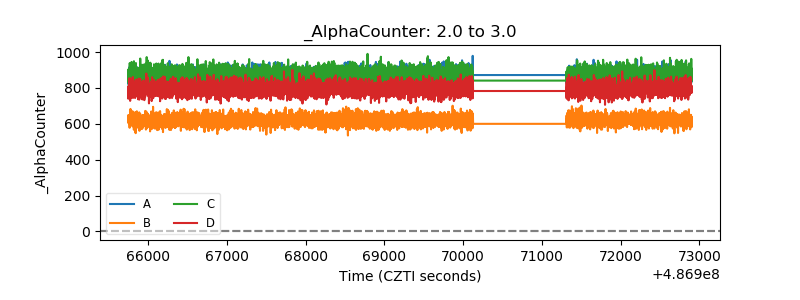 |
| _CPM_Rate | 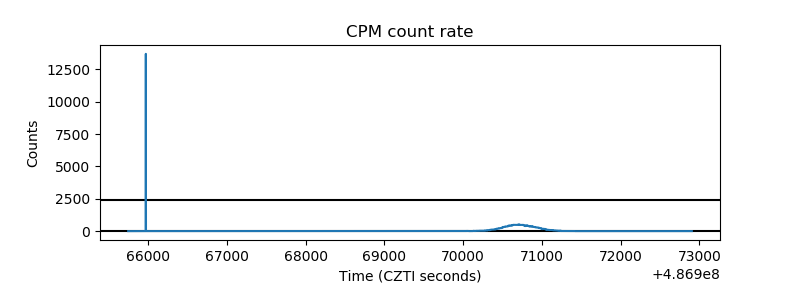 |
| CZT Counter | 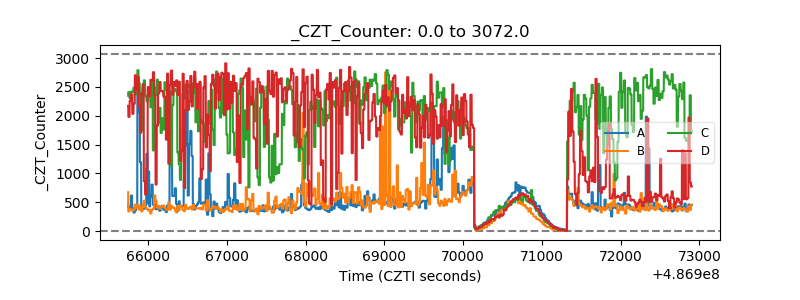 |
| +2.5 Volts monitor | 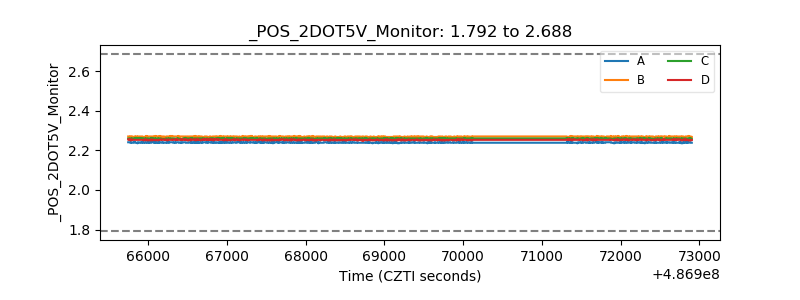 |
| +5 Volts monitor |  |
| _ROLL_ROT | 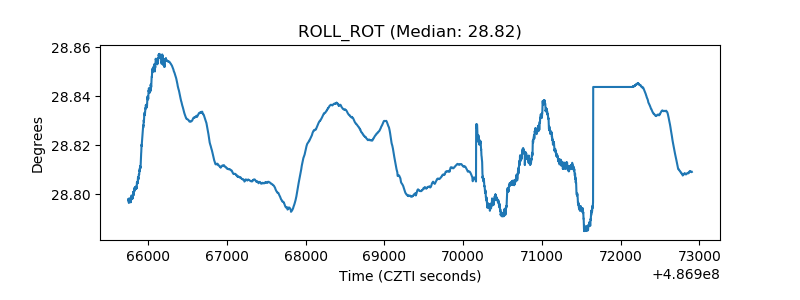 |
| _Roll_DEC | 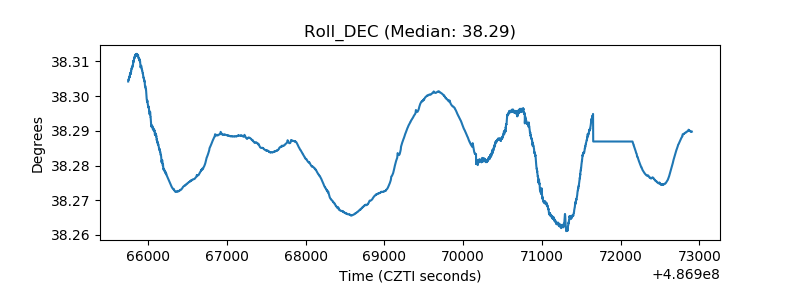 |
| _Roll_RA | 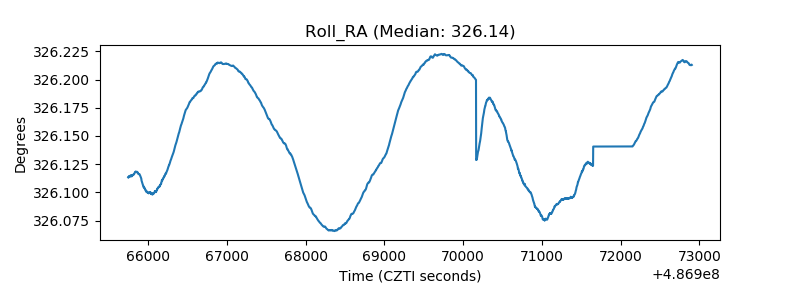 |
| Veto Counter | 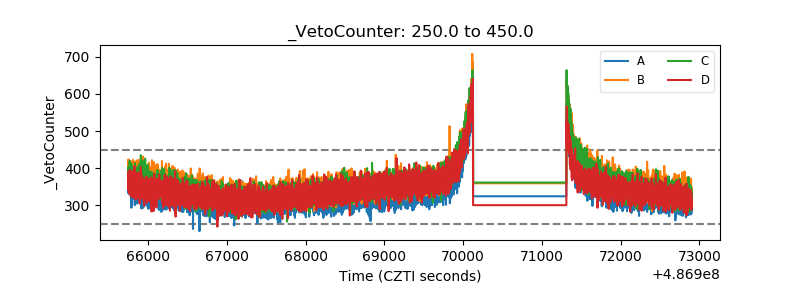 |