| Param | Original file | Final file |
|---|---|---|
| Filename | modeM0/AS1A13_037T01_9000006476_52426cztM0_level2.fits | modeM0/AS1A13_037T01_9000006476_52426cztM0_level2_quad_clean.evt |
| Size (bytes) | 718,254,720 | 69,782,400 |
| Size | 685.0 MB | 66.5 MB |
| Events in quadrant A | 2,736,639 | 559,492 |
| Events in quadrant B | 3,028,009 | 604,596 |
| Events in quadrant C | 9,904,447 | 399,147 |
| Events in quadrant D | 10,455,207 | 132,971 |
| Mode M9 | |||
|---|---|---|---|
| Quadrant | BADHDUFLAG | Total packets | Discarded packets |
| A | 0 | 10 | 0 |
| B | 0 | 10 | 0 |
| C | 0 | 10 | 0 |
| D | 0 | 10 | 0 |
| Mode M0 | |||
|---|---|---|---|
| Quadrant | BADHDUFLAG | Total packets | Discarded packets |
| A | 0 | 12552 | 1 |
| B | 0 | 13540 | 1 |
| C | 0 | 33473 | 1 |
| D | 0 | 35150 | 3 |
| Mode SS | |||
|---|---|---|---|
| Quadrant | BADHDUFLAG | Total packets | Discarded packets |
| A | 0 | 122 | 0 |
| B | 0 | 122 | 0 |
| C | 0 | 122 | 0 |
| D | 0 | 122 | 0 |
| Quadrant | Total seconds | Saturated seconds | Saturation percentage |
|---|---|---|---|
| A | 5960 | 53 | 0.889262% |
| B | 5961 | 79 | 1.325281% |
| C | 5961 | 1809 | 30.347257% |
| D | 5960 | 4431 | 74.345638% |
Noise dominated data is calculated using 1-second bins in cleaned event files. If a bin has >2000 counts, and if more than 50% of those come from <1% of pixels, then it is considered to be noise-dominated and hence unusable.
| Quadrant | # 1 sec bins | Bins with >0 counts | Bins with >2000 counts | High rate bins dominated by noise | Noise dominated (total time) | Noise dominated (detector-on time) | Marked lightcurve |
|---|---|---|---|---|---|---|---|
| A | 7000 | 5962 | 9 | 9 | 0.13% | 0.15% | 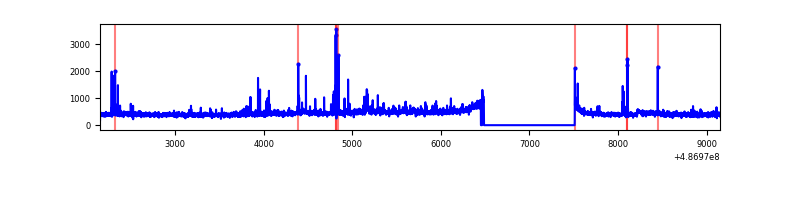 |
| B | 7001 | 5963 | 8 | 8 | 0.11% | 0.13% | 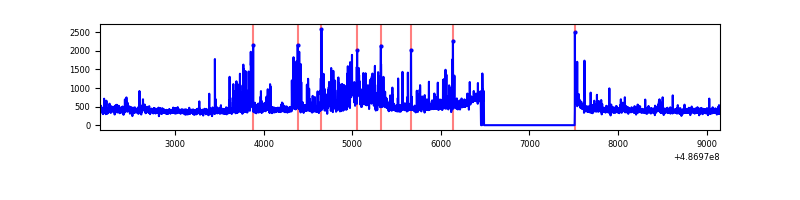 |
| C | 7001 | 5962 | 2011 | 2011 | 28.72% | 33.73% | 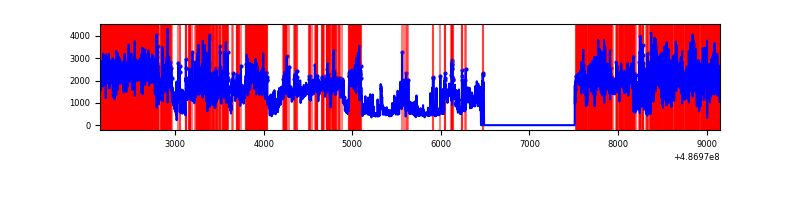 |
| D | 6999 | 5959 | 2496 | 2496 | 35.66% | 41.89% | 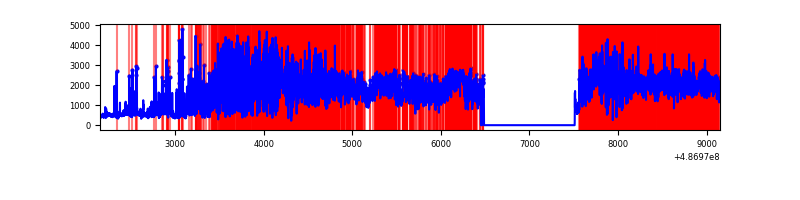 |
Top three noisy pixels from each quadrant. If the there are fewer than three noisy pixels in the level2.evt file, extra rows are filled as -1
| Pixel properties | Quadrant properties | ||||||
|---|---|---|---|---|---|---|---|
| Quadrant | DetID | PixID | Counts | Sigma | Mean | Median | Sigma |
| A | 4 | 3 | 49598 | 312.66 | 628 | 611 | 156.7 |
| A | 3 | 14 | 47289 | 297.92 | 628 | 611 | 156.7 |
| A | 8 | 26 | 32809 | 205.5 | 628 | 611 | 156.7 |
| B | 4 | 171 | 254301 | 1911.18 | 619 | 597 | 132.7 |
| B | 7 | 0 | 111842 | 838.02 | 619 | 597 | 132.7 |
| B | 4 | 81 | 70927 | 529.8 | 619 | 597 | 132.7 |
| C | 1 | 45 | 3578915 | 23717.73 | 547 | 543 | 150.9 |
| C | 9 | 38 | 1850660 | 12262.72 | 547 | 543 | 150.9 |
| C | 15 | 248 | 854288 | 5658.69 | 547 | 543 | 150.9 |
| D | 12 | 18 | 8076054 | 122805.96 | 224 | 214 | 65.8 |
| D | 12 | 17 | 843773 | 12827.65 | 224 | 214 | 65.8 |
| D | 12 | 6 | 164857 | 2503.66 | 224 | 214 | 65.8 |
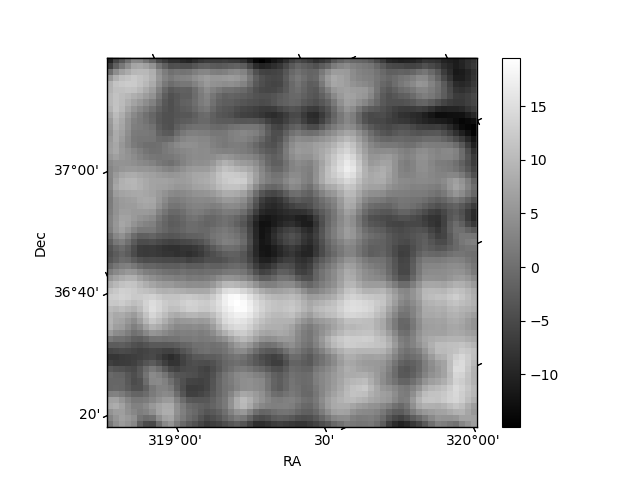
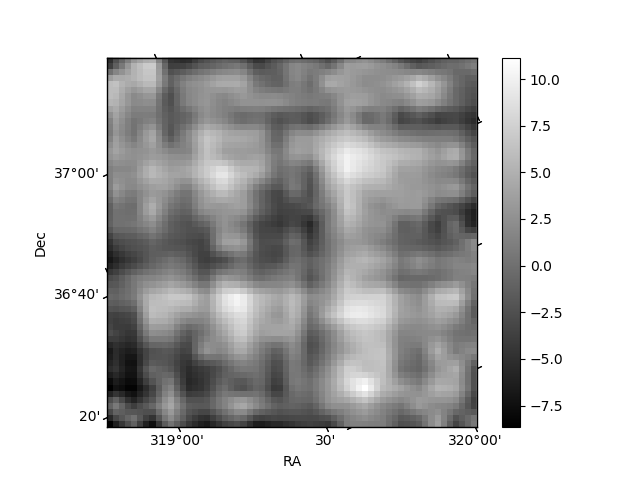
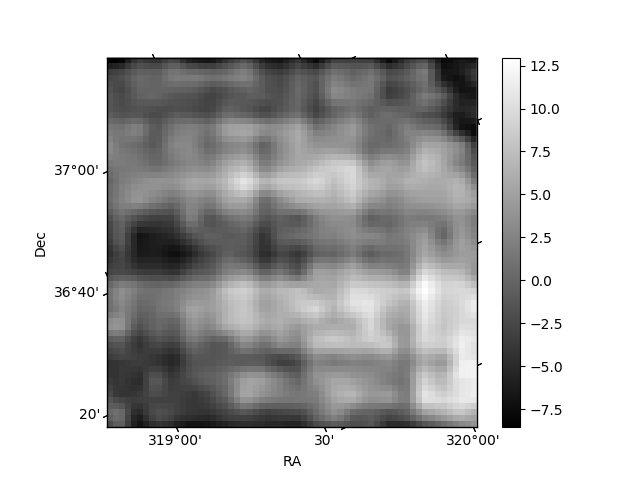
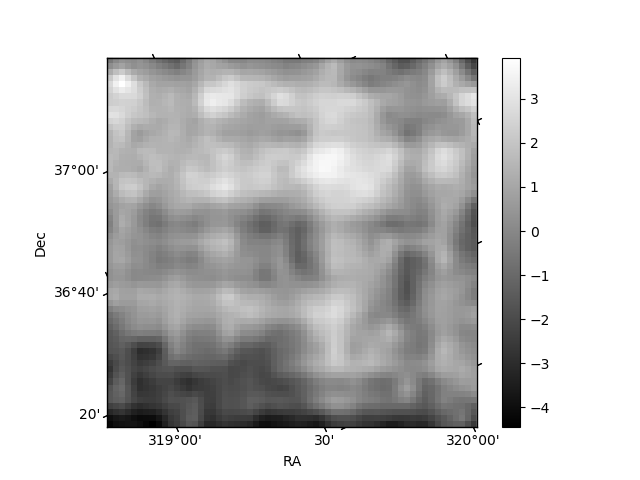
Histogram calculated using DETX and DETY for each event in the final _common_clean file
| Quadrant A | 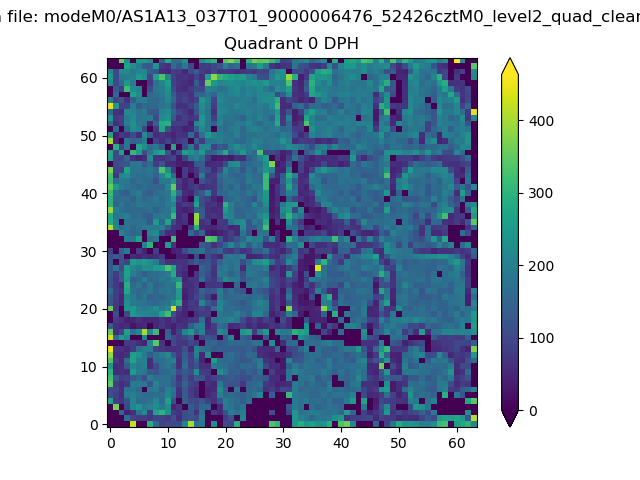 |
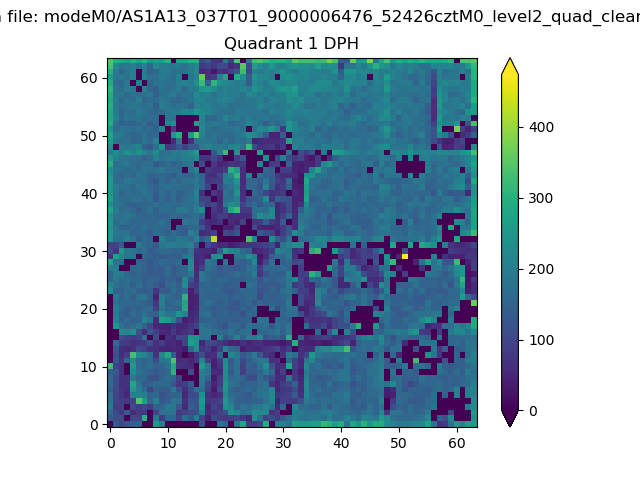 |
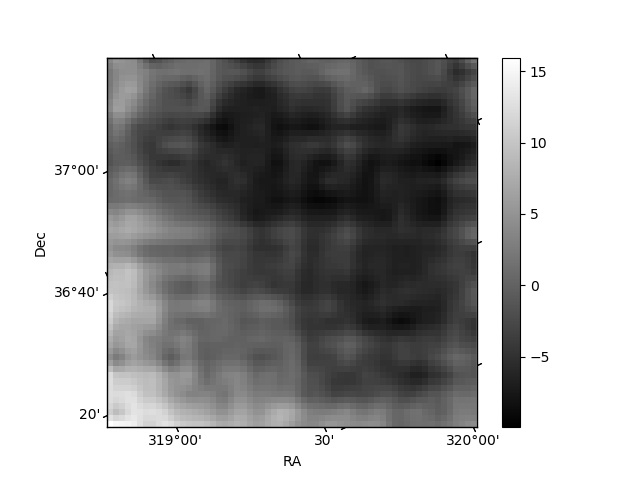
Quadrant B |
|---|---|---|---|
| Quadrant D | 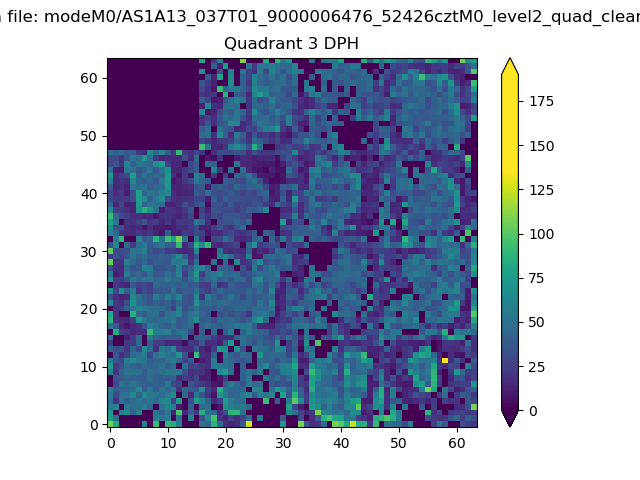 |
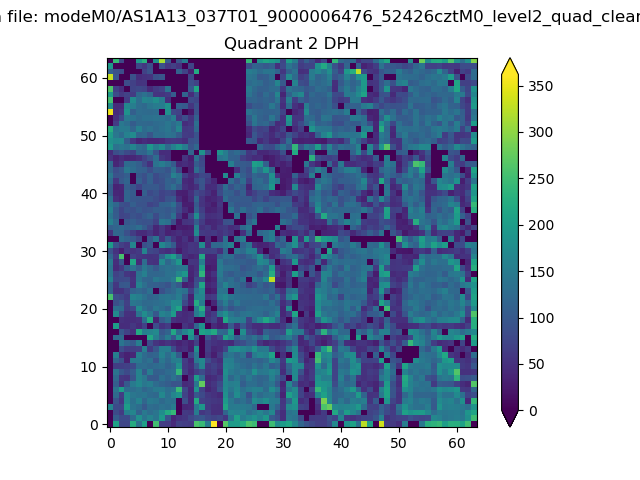 |
Quadrant C |
| Plot type | Count rate plots | Images |
|---|---|---|
| Comparison with Poisson distribution Blue bars denote a histogram of data divided into 1 sec bins. Red curve is a Poisson curve with rate = median count rate of data. |
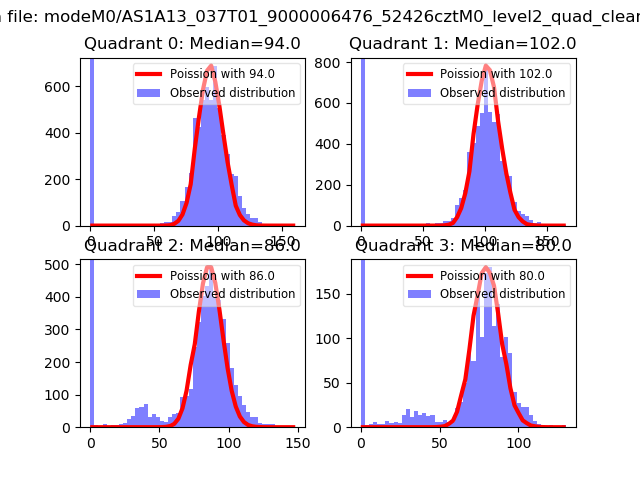 |
 |
| Quadrant-wise count rates Data is divided into 100 sec bins |
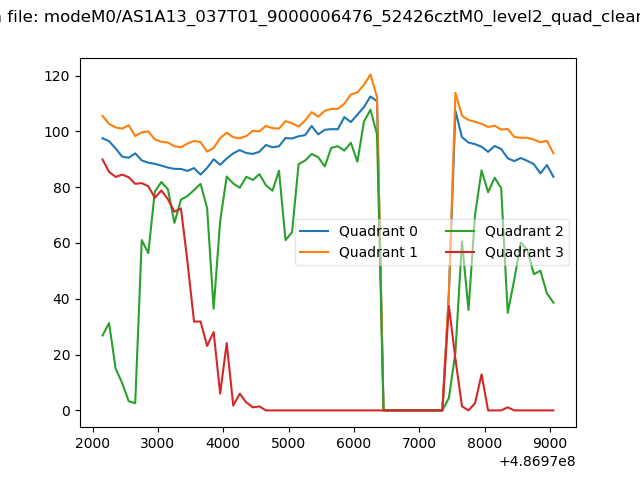 |
|
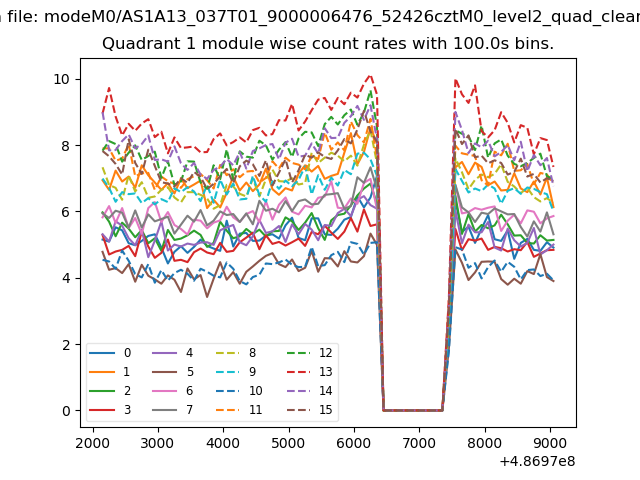
| Module-wise count rates for Quadrant A Data is divided into 100 sec bins |
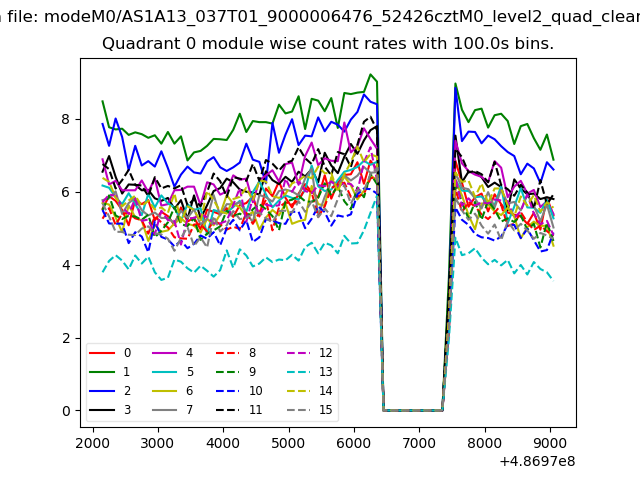 |
 |
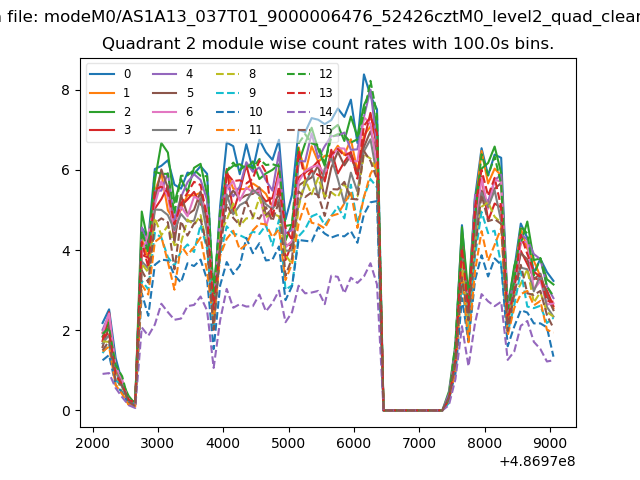
| Module-wise count rates for Quadrant B Data is divided into 100 sec bins |
 |
 |
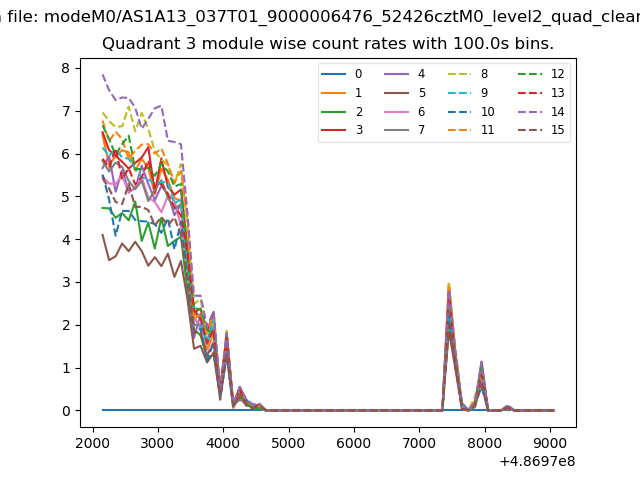
| Module-wise count rates for Quadrant C Data is divided into 100 sec bins |
 |
 |
| Module-wise count rates for Quadrant D Data is divided into 100 sec bins |
 |
 |
| Parameter | Plot |
|---|---|
| CZT HV Monitor | 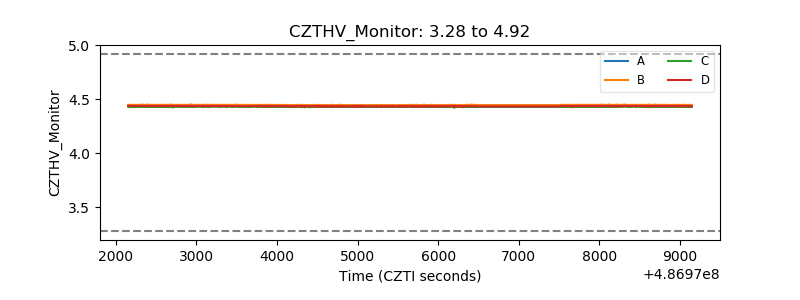 |
| D_VDD | 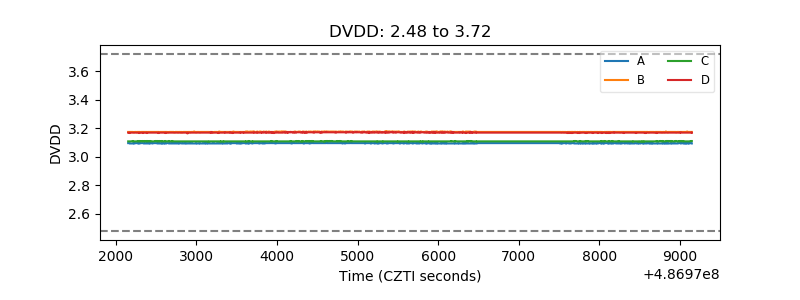 |
| Temperature 1 | 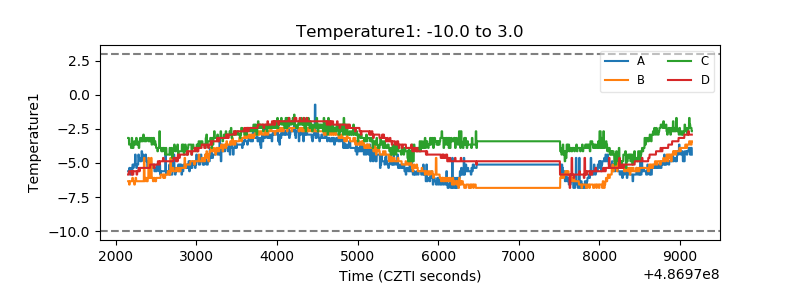 |
| Veto HV Monitor | 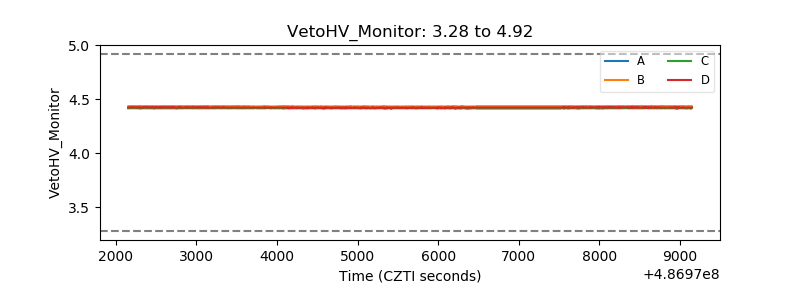 |
| Veto LLD | 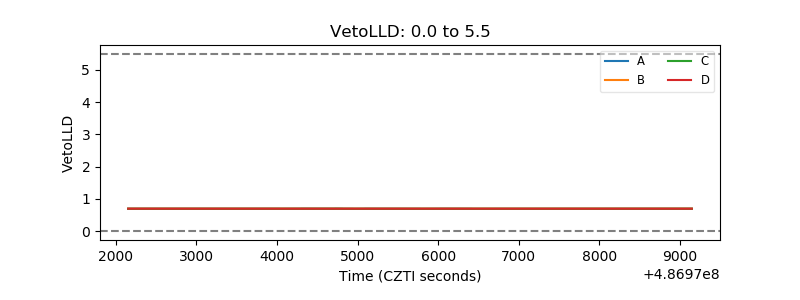 |
| Alpha Counter | 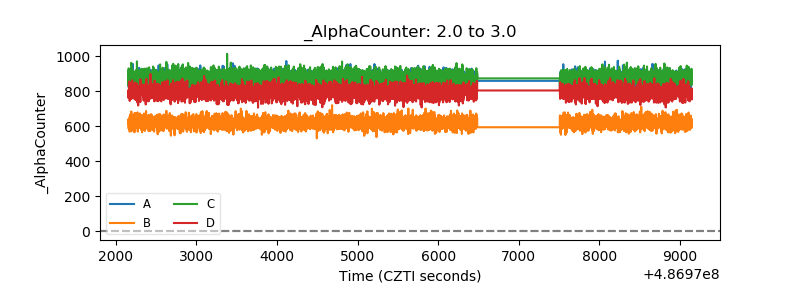 |
| _CPM_Rate | 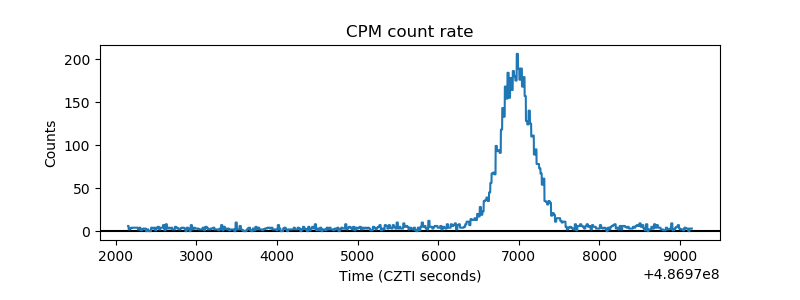 |
| CZT Counter | 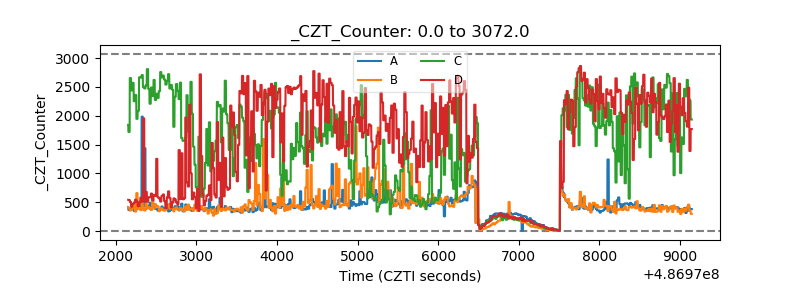 |
| +2.5 Volts monitor | 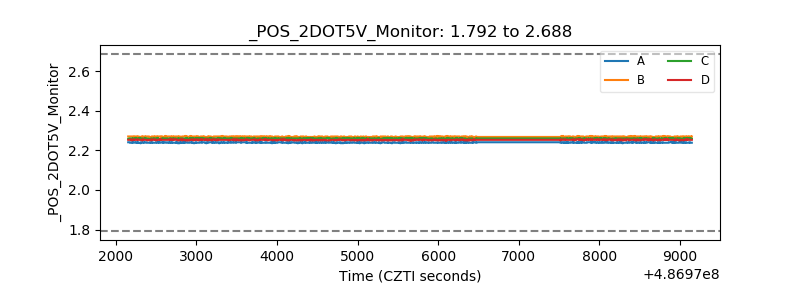 |
| +5 Volts monitor |  |
| _ROLL_ROT | 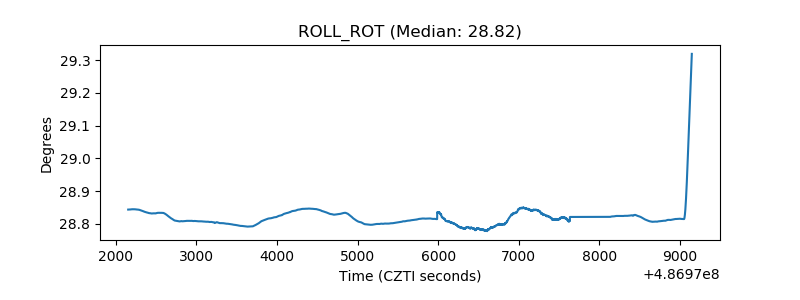 |
| _Roll_DEC | 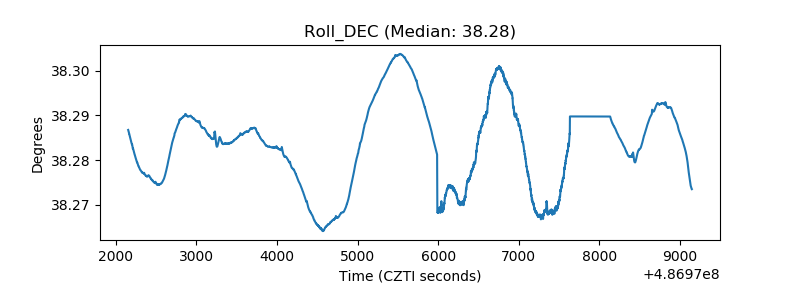 |
| _Roll_RA | 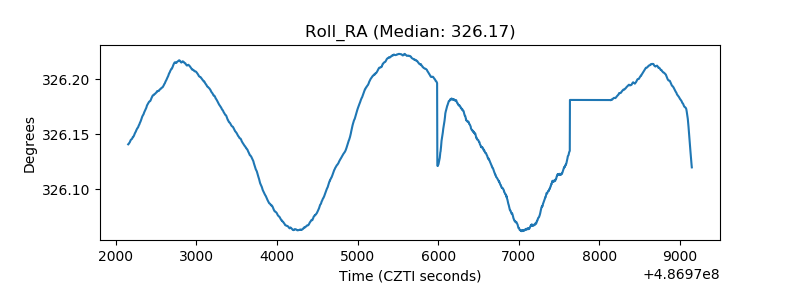 |
| Veto Counter | 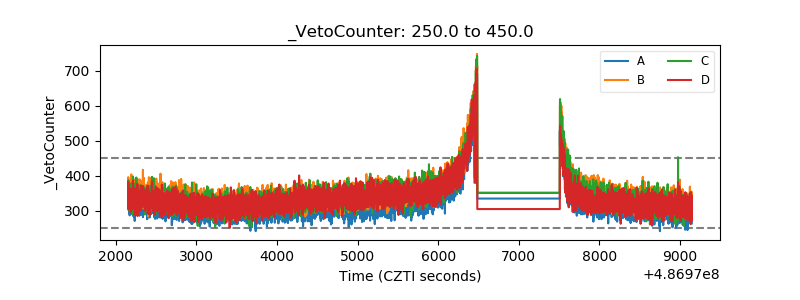 |