| Param | Original file | Final file |
|---|---|---|
| Filename | modeM0/AS1A13_037T01_9000006476_52427cztM0_level2.fits | modeM0/AS1A13_037T01_9000006476_52427cztM0_level2_quad_clean.evt |
| Size (bytes) | 911,053,440 | 64,071,360 |
| Size | 868.8 MB | 61.1 MB |
| Events in quadrant A | 3,331,096 | 613,918 |
| Events in quadrant B | 3,355,717 | 663,852 |
| Events in quadrant C | 13,697,265 | 203,202 |
| Events in quadrant D | 12,828,835 | 238 |
| Mode M9 | |||
|---|---|---|---|
| Quadrant | BADHDUFLAG | Total packets | Discarded packets |
| A | 0 | 7 | 0 |
| B | 0 | 7 | 0 |
| C | 0 | 7 | 0 |
| D | 0 | 7 | 0 |
| Mode M0 | |||
|---|---|---|---|
| Quadrant | BADHDUFLAG | Total packets | Discarded packets |
| A | 0 | 14724 | 1 |
| B | 0 | 14801 | 1 |
| C | 0 | 45161 | 1 |
| D | 0 | 42631 | 7 |
| Mode SS | |||
|---|---|---|---|
| Quadrant | BADHDUFLAG | Total packets | Discarded packets |
| A | 0 | 134 | 0 |
| B | 0 | 134 | 0 |
| C | 0 | 134 | 0 |
| D | 0 | 134 | 0 |
| Quadrant | Total seconds | Saturated seconds | Saturation percentage |
|---|---|---|---|
| A | 6575 | 202 | 3.072243% |
| B | 6576 | 141 | 2.144161% |
| C | 6576 | 4457 | 67.776764% |
| D | 6575 | 6573 | 99.969582% |
Noise dominated data is calculated using 1-second bins in cleaned event files. If a bin has >2000 counts, and if more than 50% of those come from <1% of pixels, then it is considered to be noise-dominated and hence unusable.
| Quadrant | # 1 sec bins | Bins with >0 counts | Bins with >2000 counts | High rate bins dominated by noise | Noise dominated (total time) | Noise dominated (detector-on time) | Marked lightcurve |
|---|---|---|---|---|---|---|---|
| A | 7295 | 6576 | 90 | 90 | 1.23% | 1.37% | 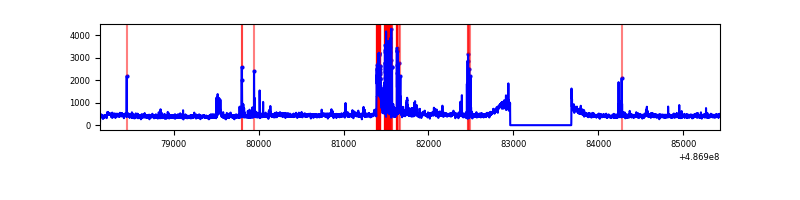 |
| B | 7296 | 6577 | 29 | 29 | 0.40% | 0.44% | 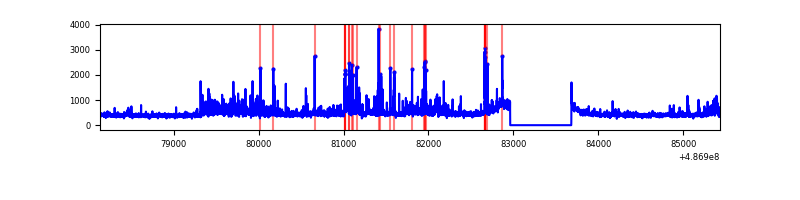 |
| C | 7295 | 6576 | 3963 | 3963 | 54.32% | 60.26% | 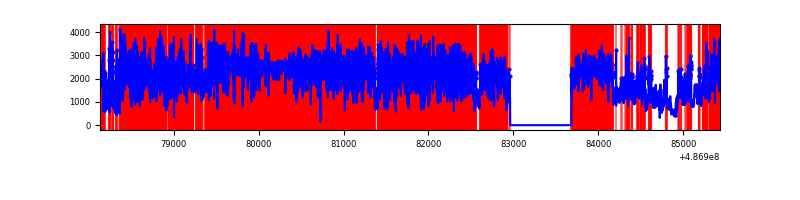 |
| D | 7294 | 6574 | 3187 | 3187 | 43.69% | 48.48% | 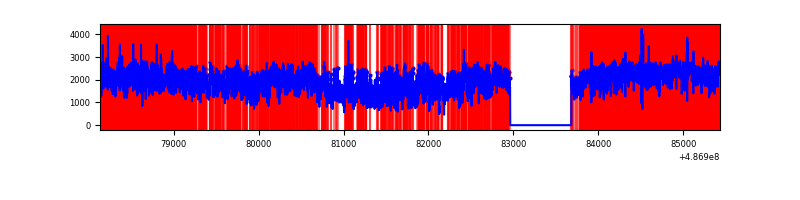 |
Top three noisy pixels from each quadrant. If the there are fewer than three noisy pixels in the level2.evt file, extra rows are filled as -1
| Pixel properties | Quadrant properties | ||||||
|---|---|---|---|---|---|---|---|
| Quadrant | DetID | PixID | Counts | Sigma | Mean | Median | Sigma |
| A | 3 | 14 | 309362 | 1760.99 | 694 | 677 | 175.3 |
| A | 5 | 240 | 57562 | 324.52 | 694 | 677 | 175.3 |
| A | 4 | 3 | 57074 | 321.73 | 694 | 677 | 175.3 |
| B | 4 | 171 | 184144 | 1231.73 | 685 | 660 | 149.0 |
| B | 4 | 81 | 143213 | 956.96 | 685 | 660 | 149.0 |
| B | 4 | 173 | 66531 | 442.19 | 685 | 660 | 149.0 |
| C | 9 | 38 | 6537813 | 52383.61 | 450 | 446 | 124.8 |
| C | 15 | 248 | 2154500 | 17260.33 | 450 | 446 | 124.8 |
| C | 1 | 45 | 1488391 | 11922.83 | 450 | 446 | 124.8 |
| D | 12 | 18 | 10270259 | 394412.22 | 71 | 66 | 26.0 |
| D | 12 | 17 | 995975 | 38246.47 | 71 | 66 | 26.0 |
| D | 15 | 93 | 753154 | 28921.28 | 71 | 66 | 26.0 |
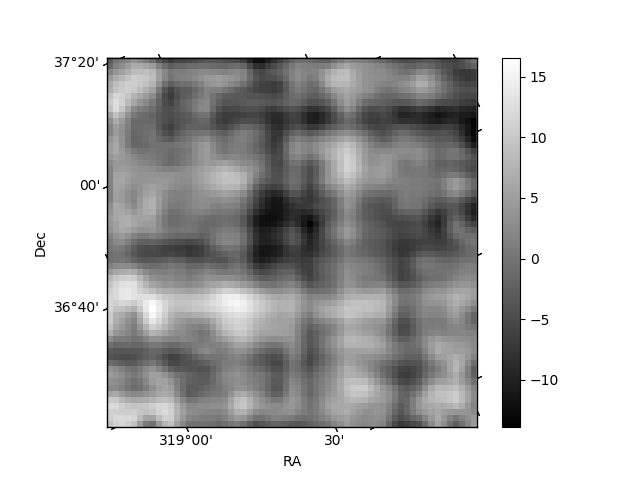
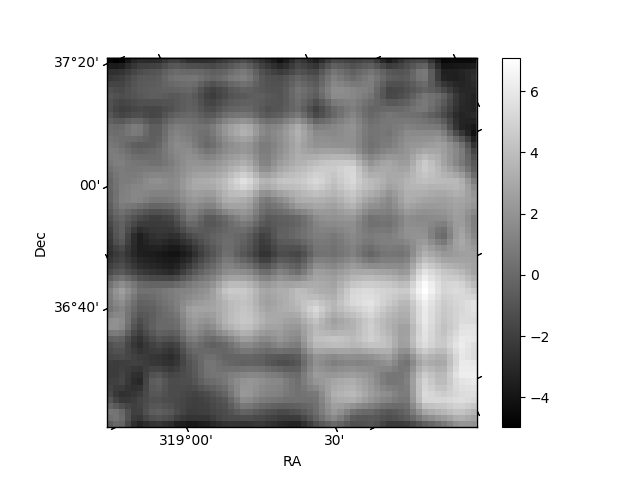
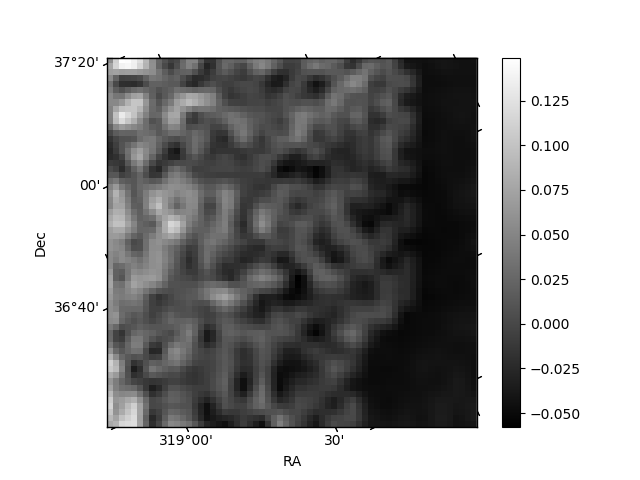
Histogram calculated using DETX and DETY for each event in the final _common_clean file
| Quadrant A | 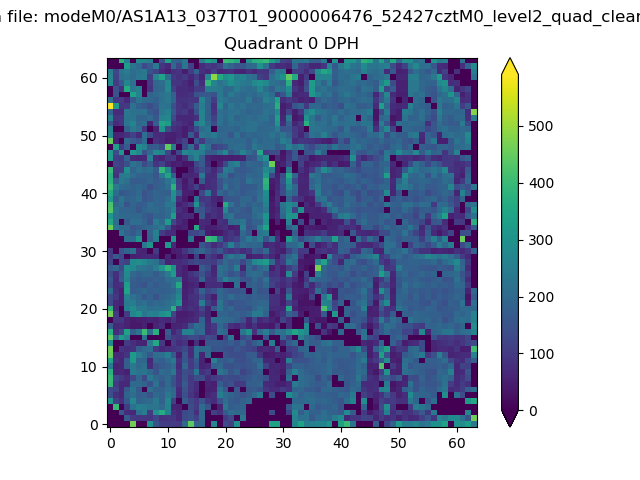 |
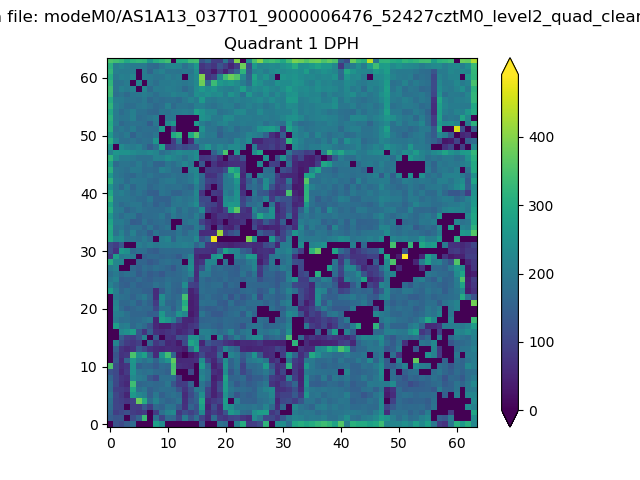 |
Quadrant B |
|---|---|---|---|
| Quadrant D | 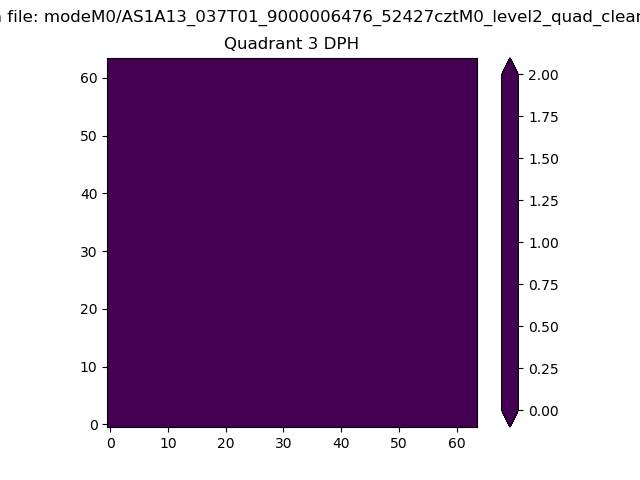 |
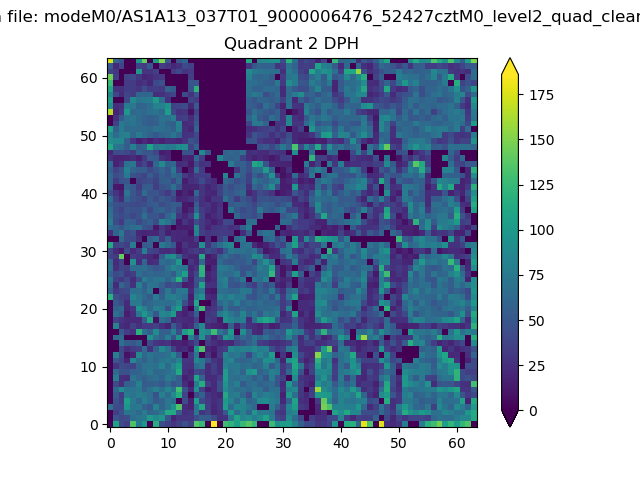 |
Quadrant C |
| Plot type | Count rate plots | Images |
|---|---|---|
| Comparison with Poisson distribution Blue bars denote a histogram of data divided into 1 sec bins. Red curve is a Poisson curve with rate = median count rate of data. |
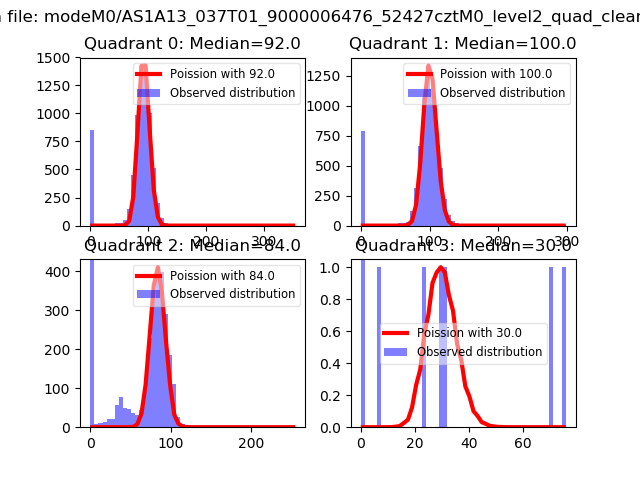 |
 |
| Quadrant-wise count rates Data is divided into 100 sec bins |
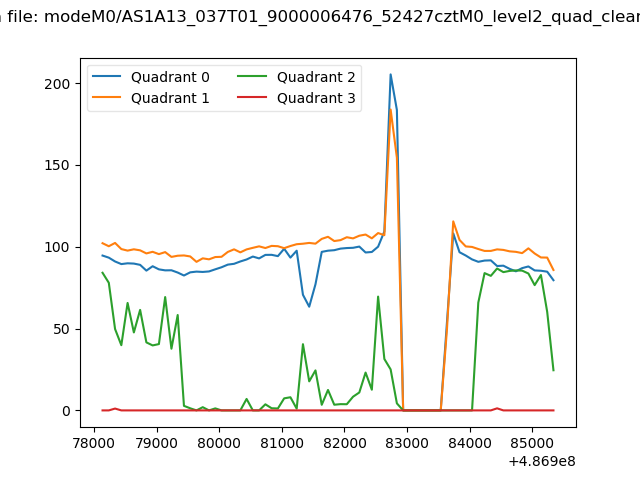 |
|
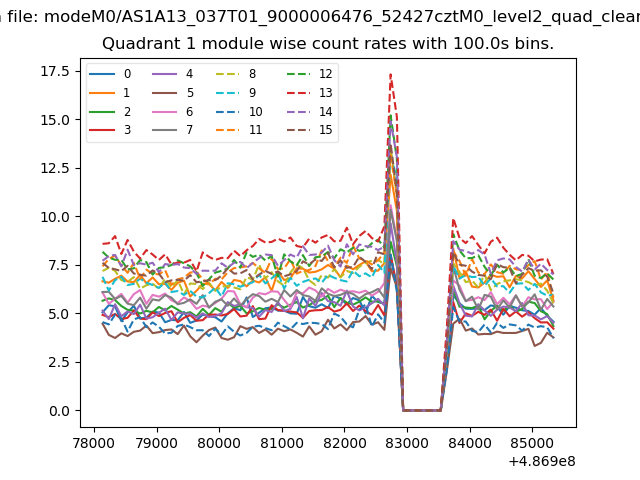
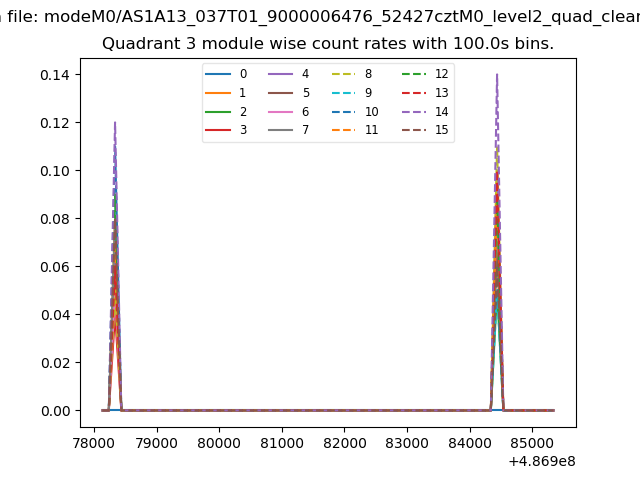
| Module-wise count rates for Quadrant A Data is divided into 100 sec bins |
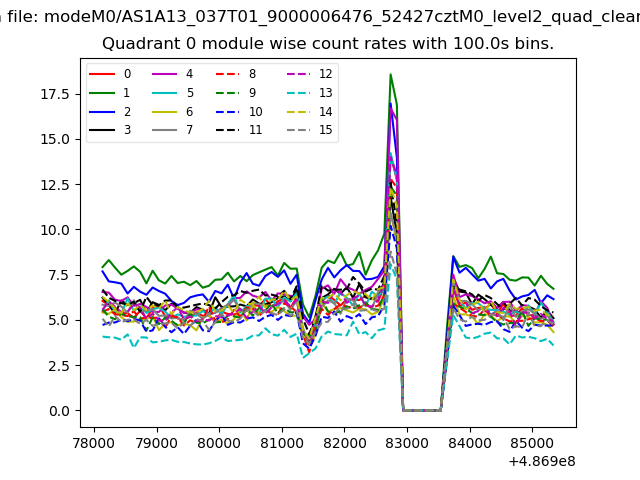 |
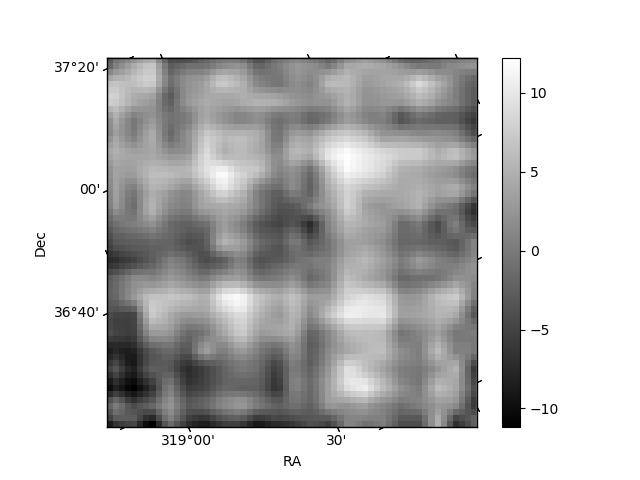 |
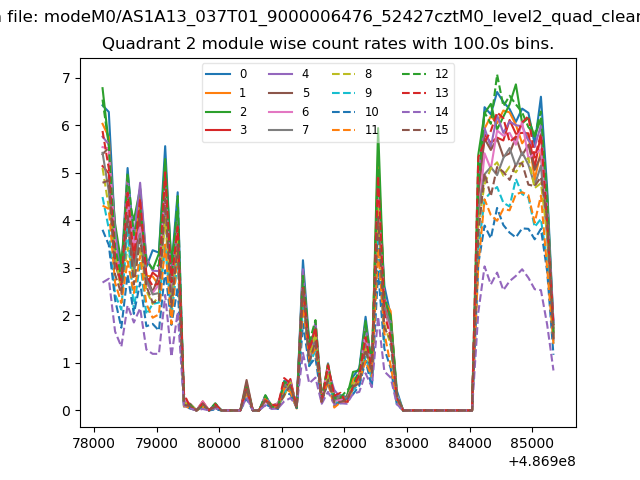
| Module-wise count rates for Quadrant B Data is divided into 100 sec bins |
 |
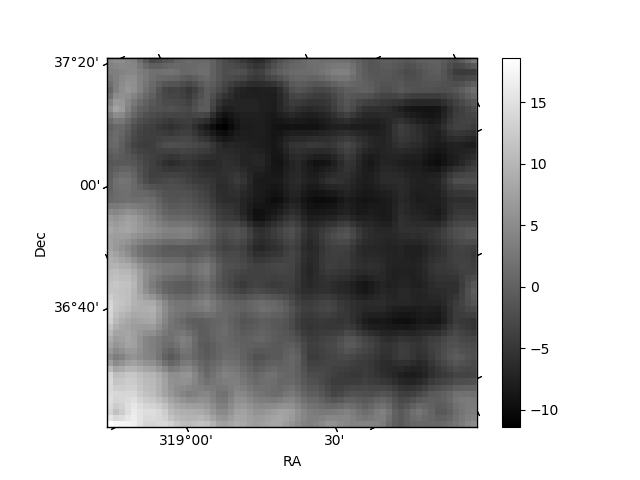 |
| Module-wise count rates for Quadrant C Data is divided into 100 sec bins |
 |
 |
| Module-wise count rates for Quadrant D Data is divided into 100 sec bins |
 |
 |
| Parameter | Plot |
|---|---|
| CZT HV Monitor | 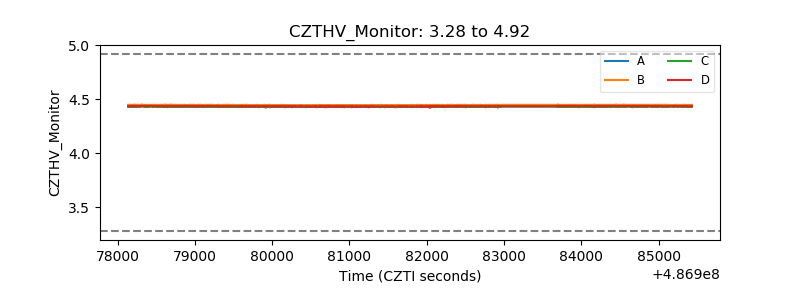 |
| D_VDD | 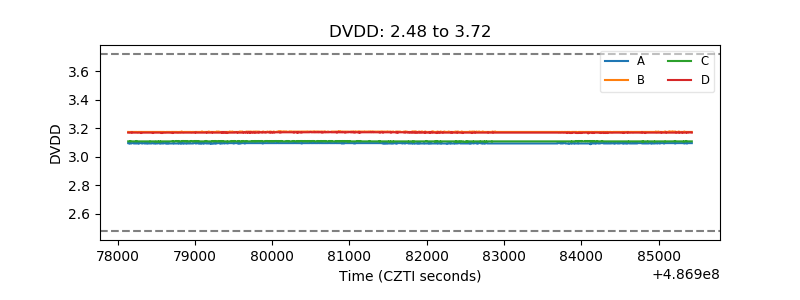 |
| Temperature 1 | 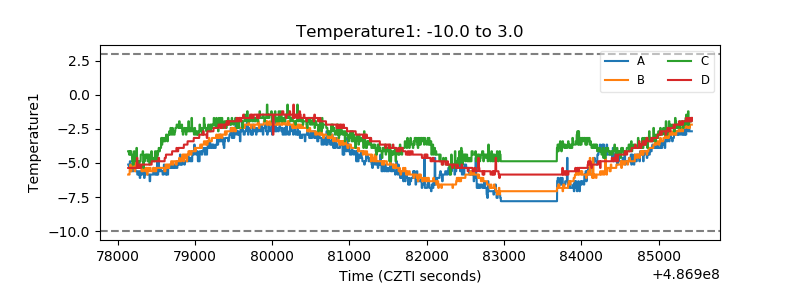 |
| Veto HV Monitor | 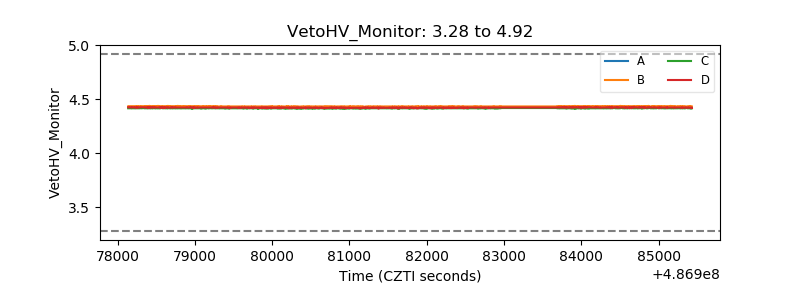 |
| Veto LLD | 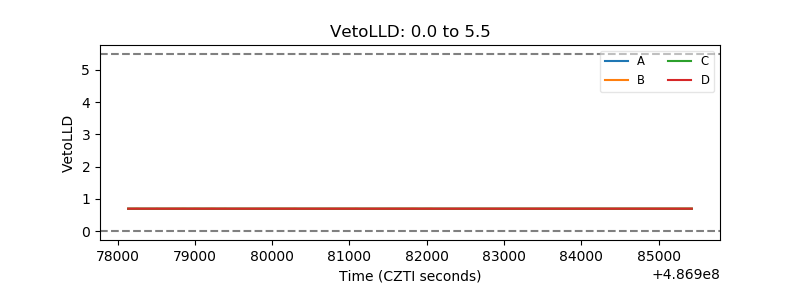 |
| Alpha Counter | 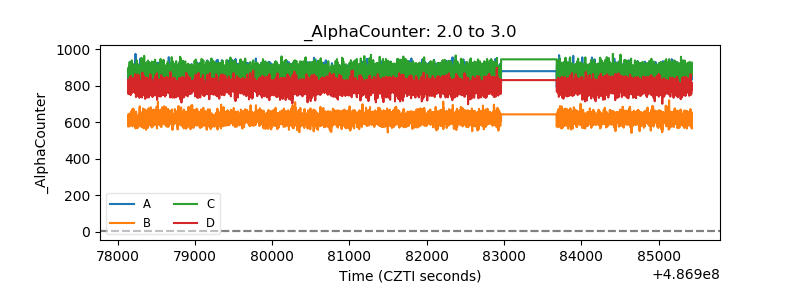 |
| _CPM_Rate | 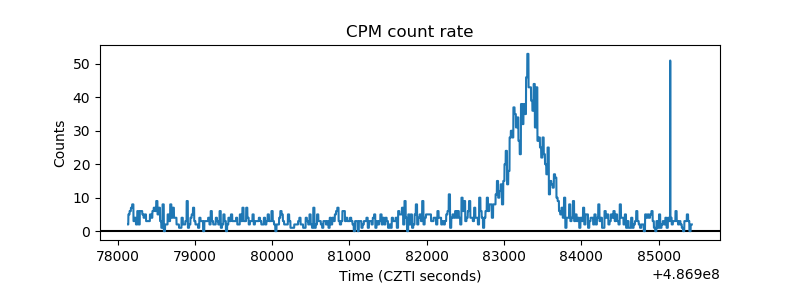 |
| CZT Counter | 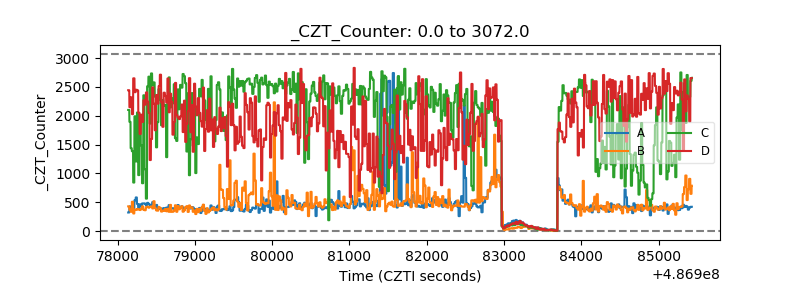 |
| +2.5 Volts monitor | 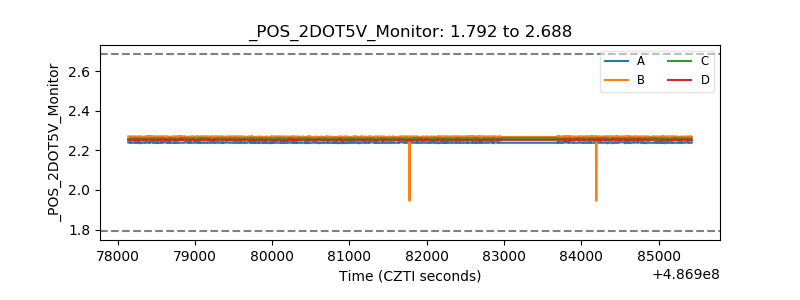 |
| +5 Volts monitor |  |
| _ROLL_ROT | 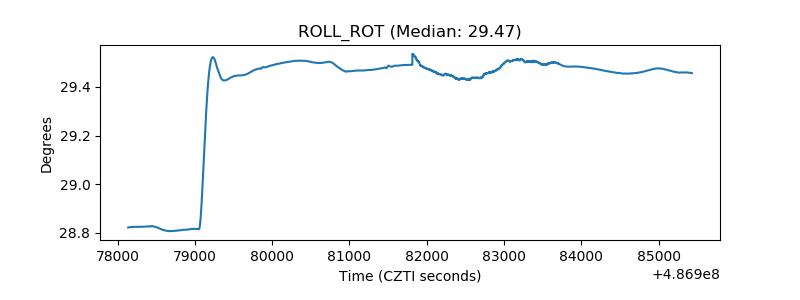 |
| _Roll_DEC | 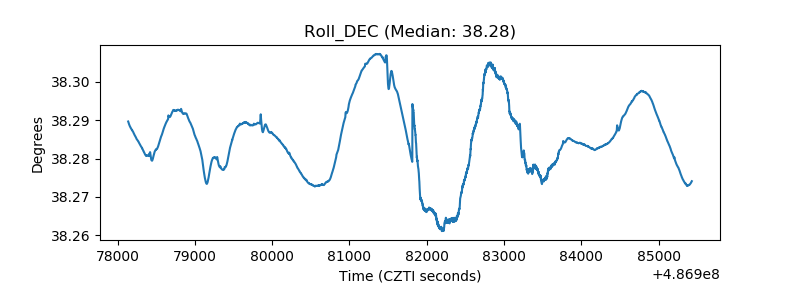 |
| _Roll_RA | 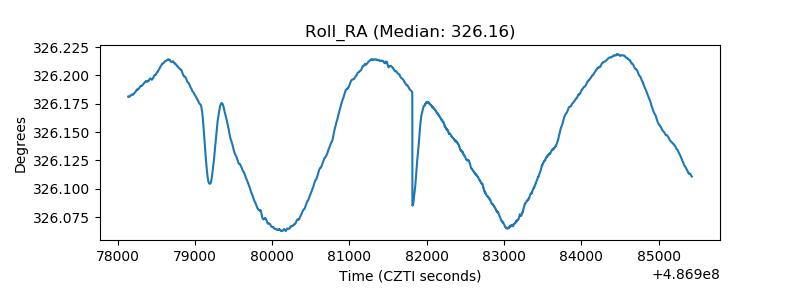 |
| Veto Counter | 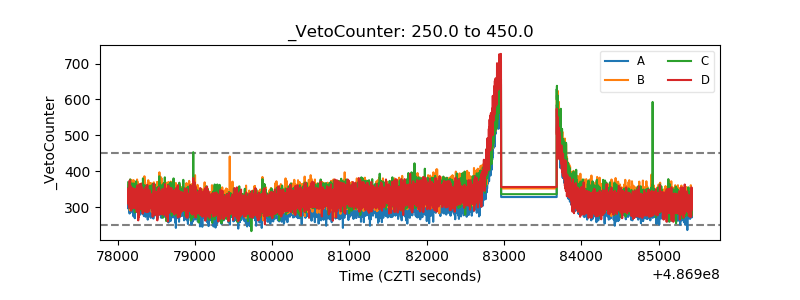 |