| Param | Original file | Final file |
|---|---|---|
| Filename | modeM0/AS1A13_037T01_9000006476_52428cztM0_level2.fits | modeM0/AS1A13_037T01_9000006476_52428cztM0_level2_quad_clean.evt |
| Size (bytes) | 804,916,800 | 88,007,040 |
| Size | 767.6 MB | 83.9 MB |
| Events in quadrant A | 3,803,539 | 656,219 |
| Events in quadrant B | 3,595,452 | 701,944 |
| Events in quadrant C | 9,679,563 | 490,469 |
| Events in quadrant D | 12,153,418 | 310,148 |
| Mode M0 | |||
|---|---|---|---|
| Quadrant | BADHDUFLAG | Total packets | Discarded packets |
| A | 0 | 16497 | 0 |
| B | 0 | 15969 | 0 |
| C | 0 | 33808 | 0 |
| D | 0 | 41192 | 3 |
| Mode SS | |||
|---|---|---|---|
| Quadrant | BADHDUFLAG | Total packets | Discarded packets |
| A | 0 | 144 | 0 |
| B | 0 | 144 | 0 |
| C | 0 | 144 | 0 |
| D | 0 | 144 | 0 |
| Quadrant | Total seconds | Saturated seconds | Saturation percentage |
|---|---|---|---|
| A | 7267 | 229 | 3.151232% |
| B | 7268 | 277 | 3.811227% |
| C | 7268 | 1756 | 24.160704% |
| D | 7267 | 3792 | 52.181093% |
Noise dominated data is calculated using 1-second bins in cleaned event files. If a bin has >2000 counts, and if more than 50% of those come from <1% of pixels, then it is considered to be noise-dominated and hence unusable.
| Quadrant | # 1 sec bins | Bins with >0 counts | Bins with >2000 counts | High rate bins dominated by noise | Noise dominated (total time) | Noise dominated (detector-on time) | Marked lightcurve |
|---|---|---|---|---|---|---|---|
| A | 7267 | 7267 | 24 | 24 | 0.33% | 0.33% | 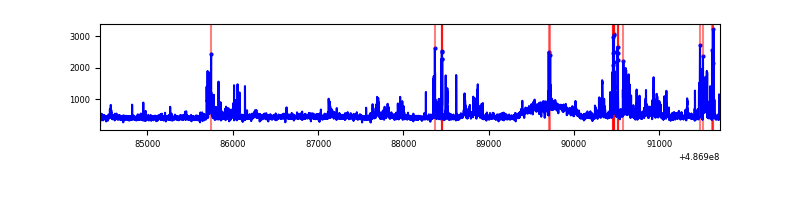 |
| B | 7268 | 7268 | 24 | 24 | 0.33% | 0.33% | 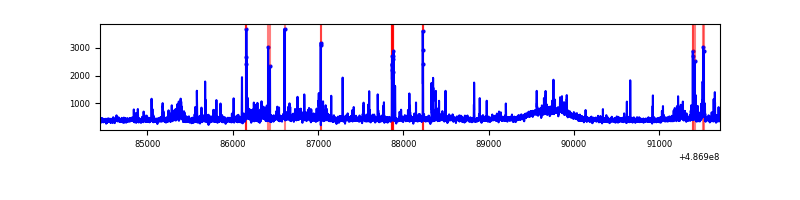 |
| C | 7267 | 7267 | 1367 | 1367 | 18.81% | 18.81% | 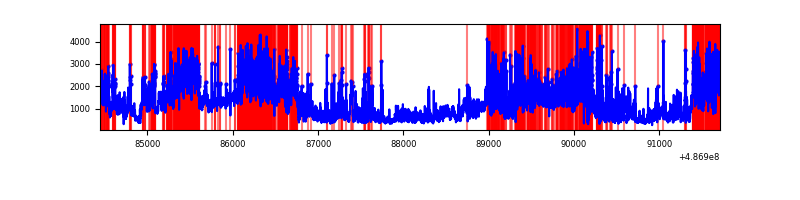 |
| D | 7267 | 7267 | 2676 | 2676 | 36.82% | 36.82% | 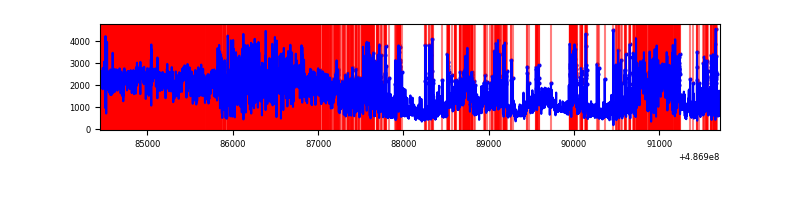 |
Top three noisy pixels from each quadrant. If the there are fewer than three noisy pixels in the level2.evt file, extra rows are filled as -1
| Pixel properties | Quadrant properties | ||||||
|---|---|---|---|---|---|---|---|
| Quadrant | DetID | PixID | Counts | Sigma | Mean | Median | Sigma |
| A | 8 | 26 | 332513 | 1723.76 | 784 | 763 | 192.5 |
| A | 4 | 3 | 111573 | 575.77 | 784 | 763 | 192.5 |
| A | 5 | 240 | 81010 | 416.96 | 784 | 763 | 192.5 |
| B | 4 | 81 | 109223 | 660.11 | 770 | 742 | 164.3 |
| B | 4 | 171 | 101945 | 615.82 | 770 | 742 | 164.3 |
| B | 4 | 170 | 89993 | 543.09 | 770 | 742 | 164.3 |
| C | 1 | 45 | 2032424 | 10879.04 | 681 | 677 | 186.8 |
| C | 15 | 248 | 1775262 | 9502.06 | 681 | 677 | 186.8 |
| C | 15 | 147 | 1071451 | 5733.48 | 681 | 677 | 186.8 |
| D | 12 | 18 | 6052841 | 42671.59 | 501 | 478 | 141.8 |
| D | 12 | 17 | 1273273 | 8973.72 | 501 | 478 | 141.8 |
| D | 15 | 93 | 615111 | 4333.41 | 501 | 478 | 141.8 |
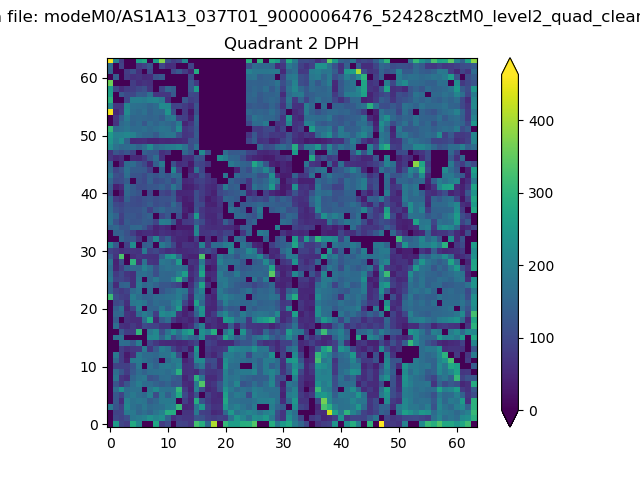
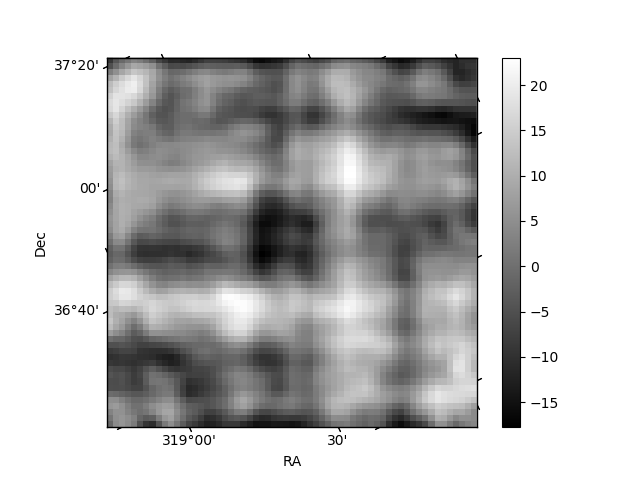
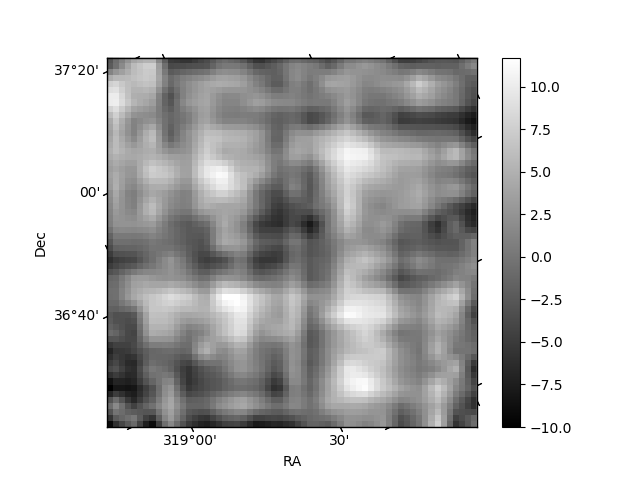
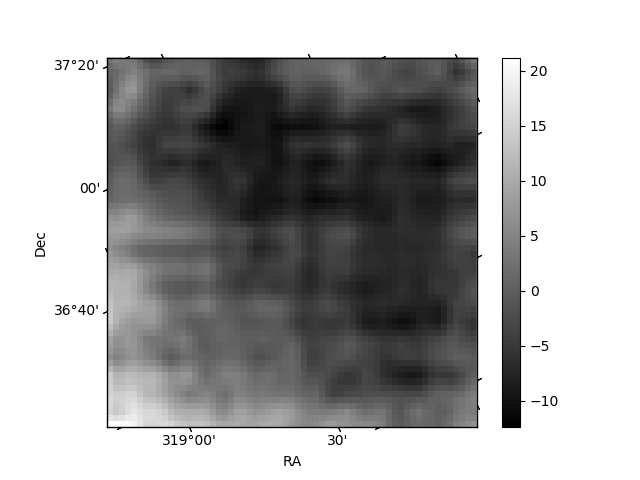
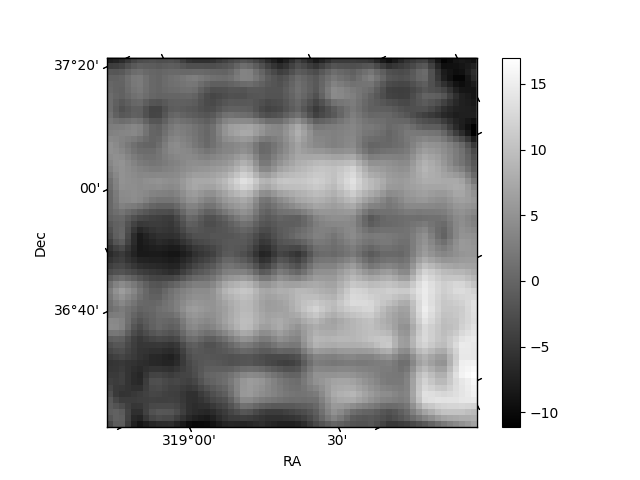
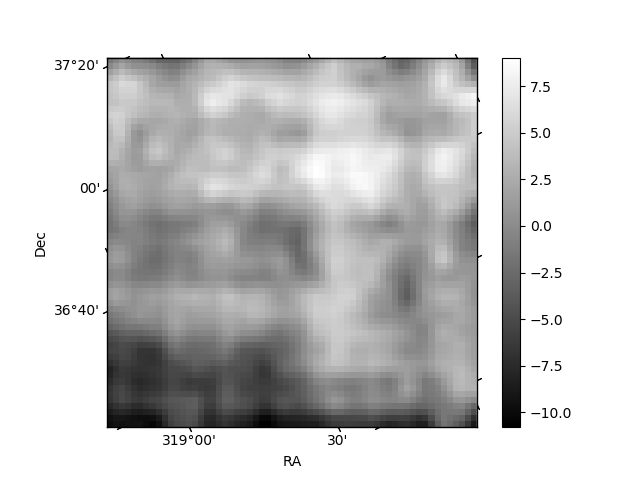
Histogram calculated using DETX and DETY for each event in the final _common_clean file
| Quadrant A | 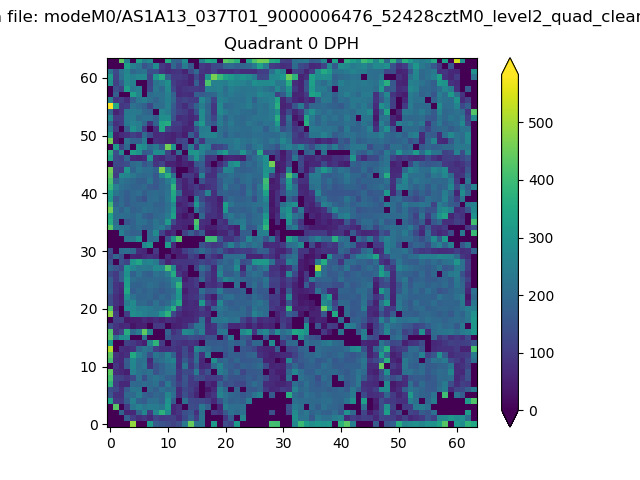 |
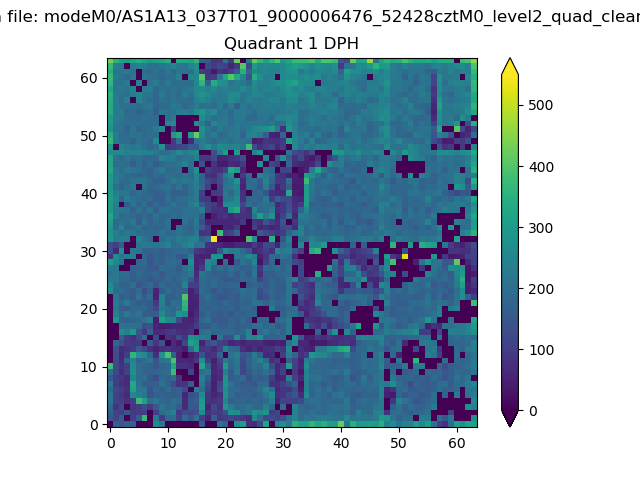 |
Quadrant B |
|---|---|---|---|
| Quadrant D | 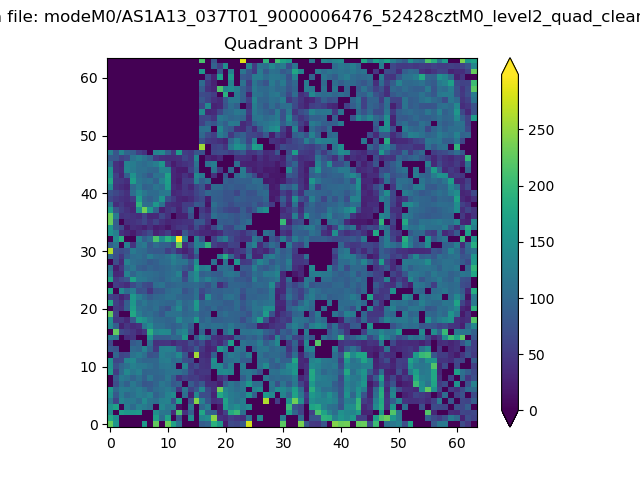 |
 |
Quadrant C |
| Plot type | Count rate plots | Images |
|---|---|---|
| Comparison with Poisson distribution Blue bars denote a histogram of data divided into 1 sec bins. Red curve is a Poisson curve with rate = median count rate of data. |
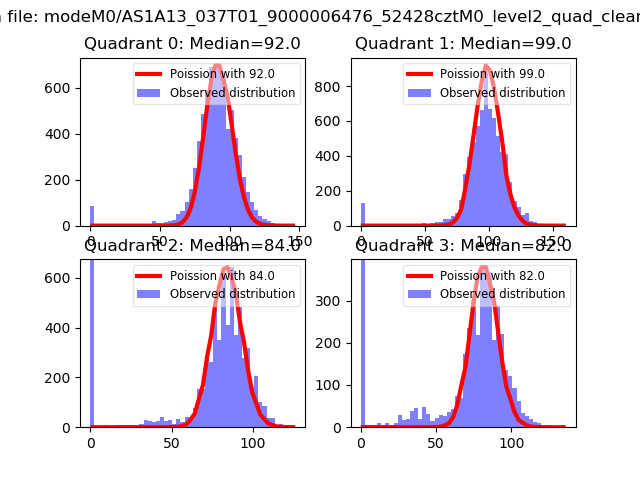 |
 |
| Quadrant-wise count rates Data is divided into 100 sec bins |
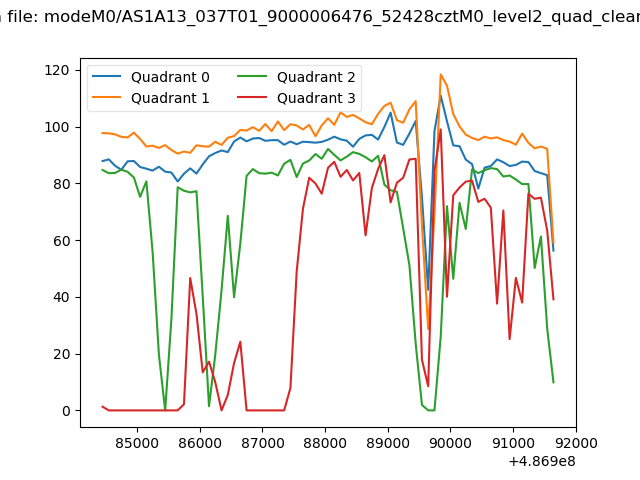 |
|
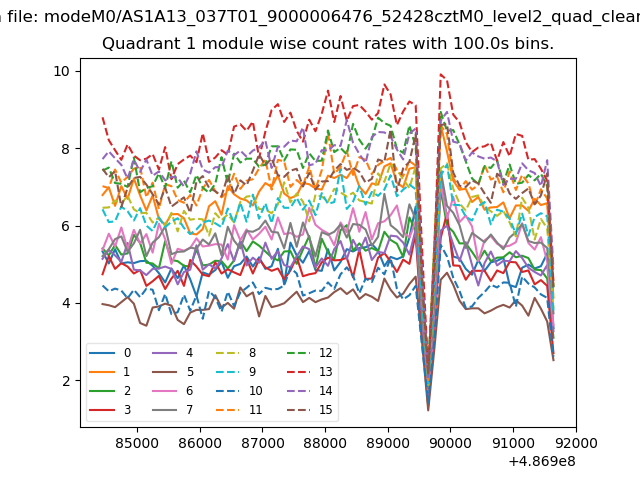
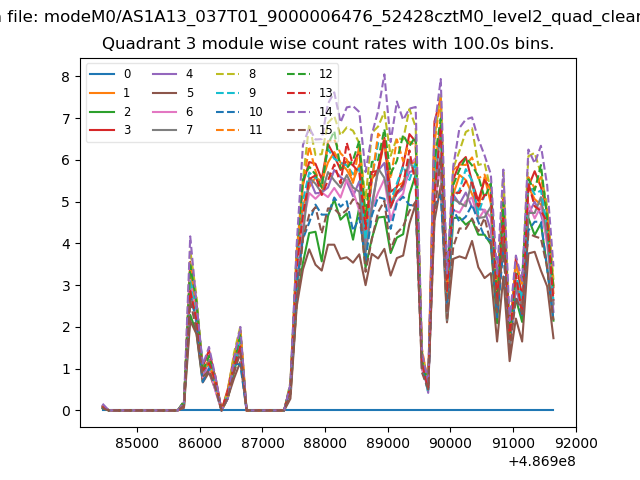
| Module-wise count rates for Quadrant A Data is divided into 100 sec bins |
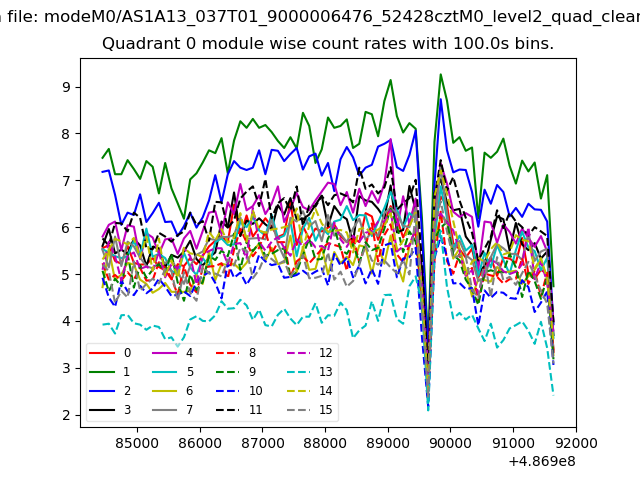 |
 |
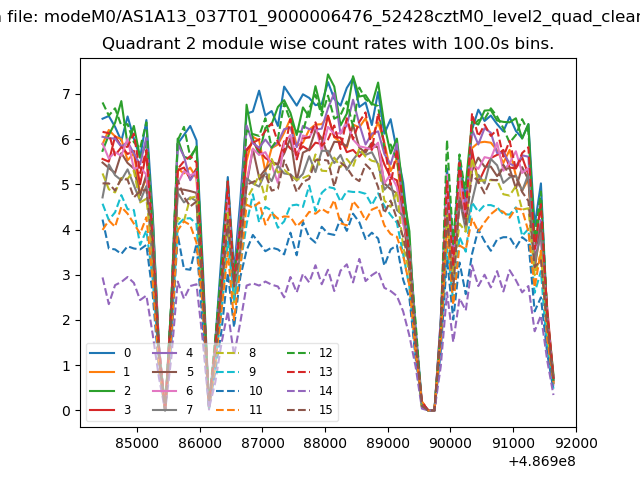
| Module-wise count rates for Quadrant B Data is divided into 100 sec bins |
 |
 |
| Module-wise count rates for Quadrant C Data is divided into 100 sec bins |
 |
 |
| Module-wise count rates for Quadrant D Data is divided into 100 sec bins |
 |
 |
| Parameter | Plot |
|---|---|
| CZT HV Monitor |  |
| D_VDD | 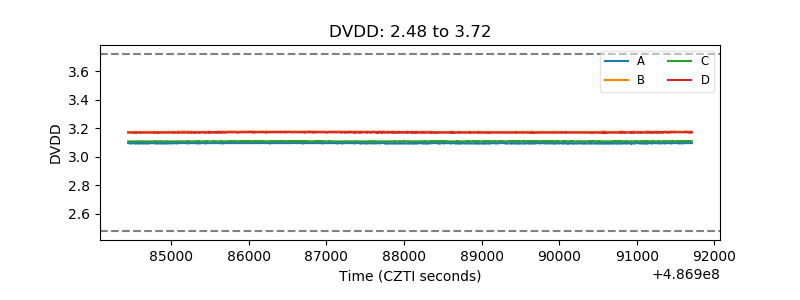 |
| Temperature 1 | 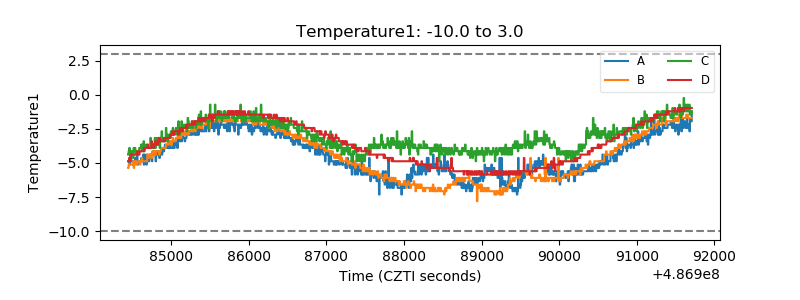 |
| Veto HV Monitor | 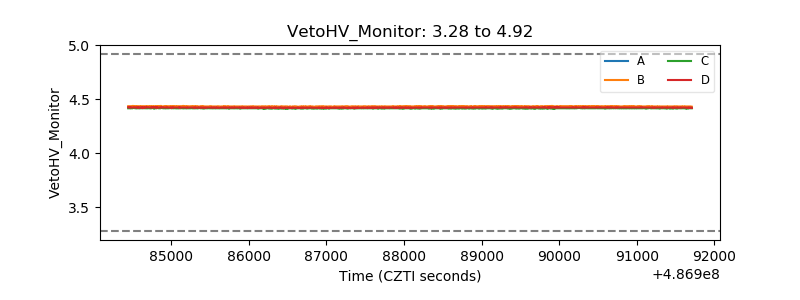 |
| Veto LLD | 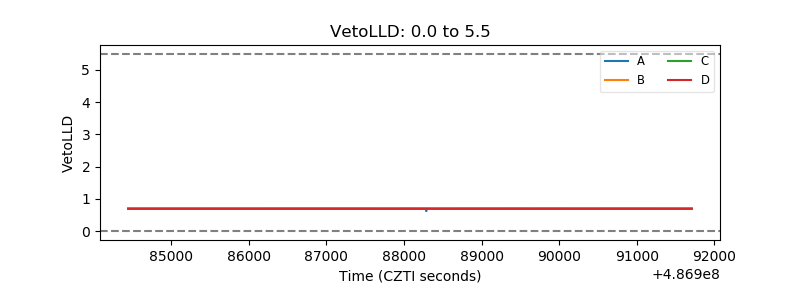 |
| Alpha Counter | 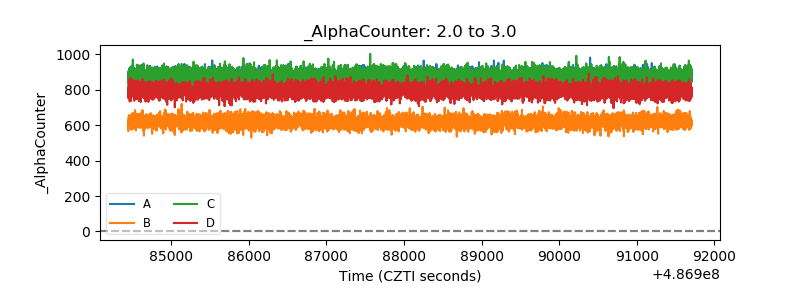 |
| _CPM_Rate | 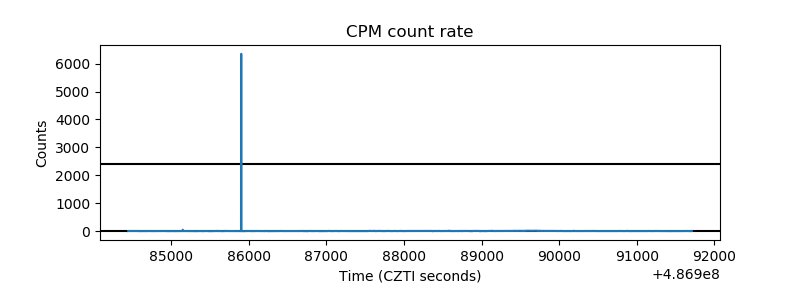 |
| CZT Counter | 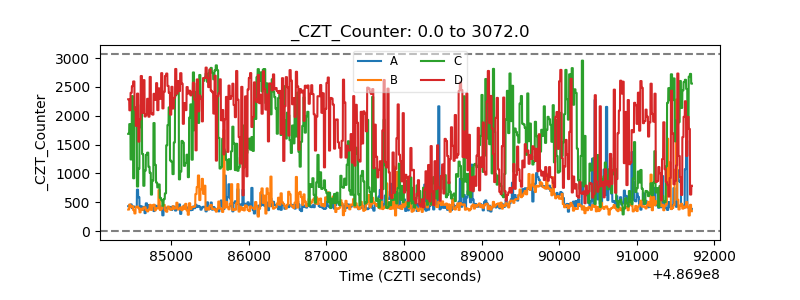 |
| +2.5 Volts monitor |  |
| +5 Volts monitor | 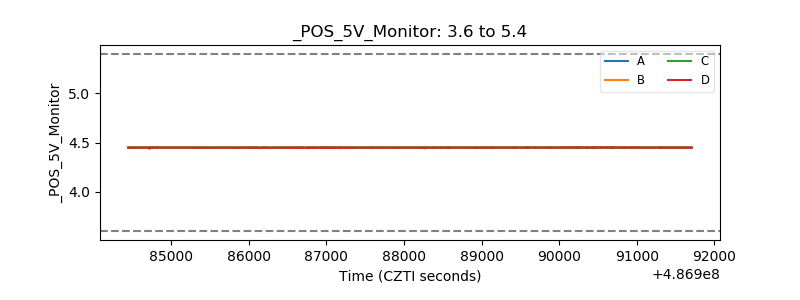 |
| _ROLL_ROT | 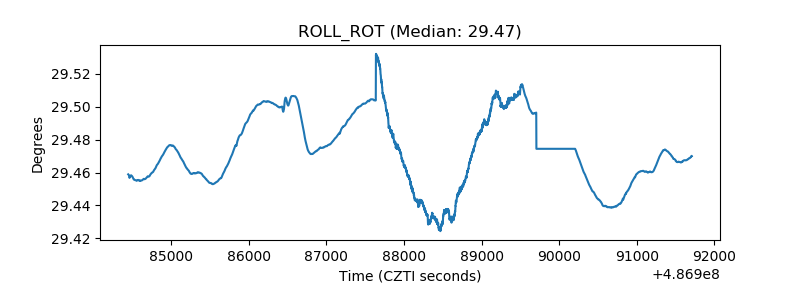 |
| _Roll_DEC | 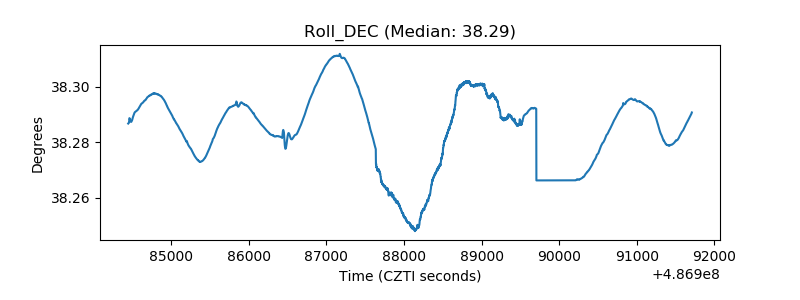 |
| _Roll_RA | 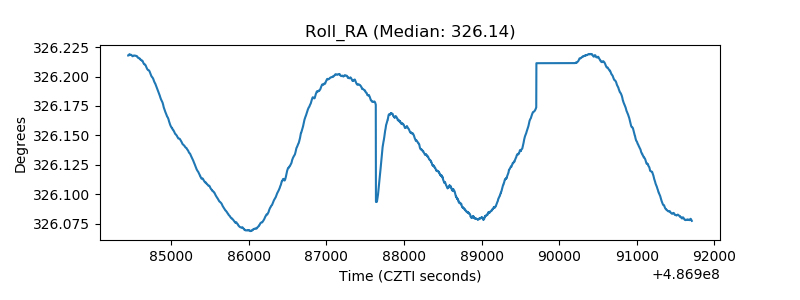 |
| Veto Counter | 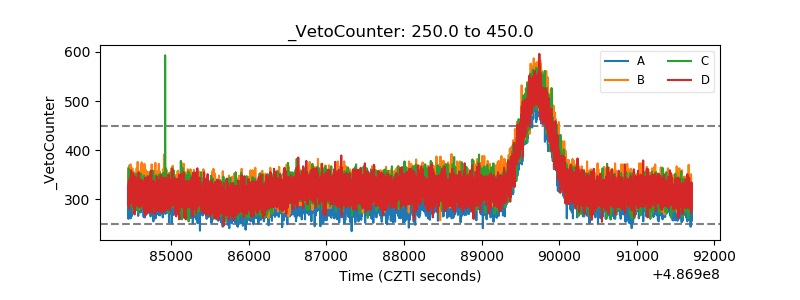 |