| Param | Original file | Final file |
|---|---|---|
| Filename | modeM0/AS1A13_037T01_9000006476_52429cztM0_level2.fits | modeM0/AS1A13_037T01_9000006476_52429cztM0_level2_quad_clean.evt |
| Size (bytes) | 830,540,160 | 96,606,720 |
| Size | 792.1 MB | 92.1 MB |
| Events in quadrant A | 4,262,795 | 699,248 |
| Events in quadrant B | 3,767,495 | 754,685 |
| Events in quadrant C | 8,628,914 | 576,820 |
| Events in quadrant D | 13,489,400 | 359,167 |
| Mode M0 | |||
|---|---|---|---|
| Quadrant | BADHDUFLAG | Total packets | Discarded packets |
| A | 0 | 17928 | 0 |
| B | 0 | 16786 | 0 |
| C | 0 | 31025 | 0 |
| D | 0 | 45388 | 0 |
| Mode SS | |||
|---|---|---|---|
| Quadrant | BADHDUFLAG | Total packets | Discarded packets |
| A | 0 | 154 | 0 |
| B | 0 | 154 | 0 |
| C | 0 | 154 | 0 |
| D | 0 | 154 | 0 |
| Quadrant | Total seconds | Saturated seconds | Saturation percentage |
|---|---|---|---|
| A | 7690 | 101 | 1.313394% |
| B | 7691 | 81 | 1.053179% |
| C | 7691 | 1190 | 15.472630% |
| D | 7691 | 3594 | 46.729944% |
Noise dominated data is calculated using 1-second bins in cleaned event files. If a bin has >2000 counts, and if more than 50% of those come from <1% of pixels, then it is considered to be noise-dominated and hence unusable.
| Quadrant | # 1 sec bins | Bins with >0 counts | Bins with >2000 counts | High rate bins dominated by noise | Noise dominated (total time) | Noise dominated (detector-on time) | Marked lightcurve |
|---|---|---|---|---|---|---|---|
| A | 7690 | 7690 | 82 | 82 | 1.07% | 1.07% | 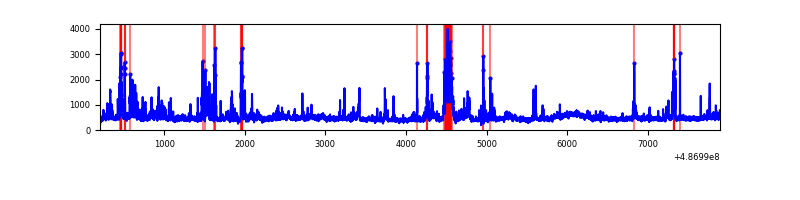 |
| B | 7691 | 7691 | 61 | 61 | 0.79% | 0.79% | 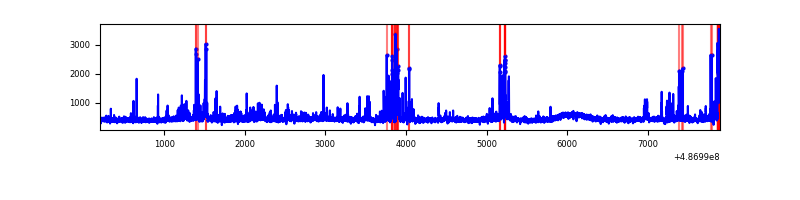 |
| C | 7691 | 7691 | 1154 | 1154 | 15.00% | 15.00% | 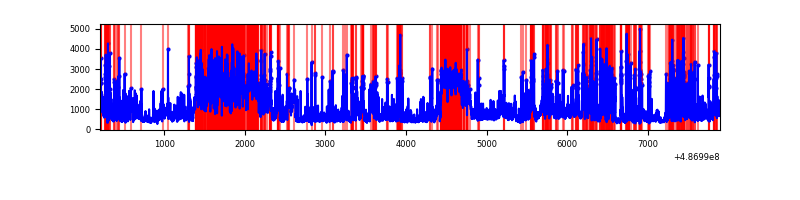 |
| D | 7691 | 7691 | 3220 | 3220 | 41.87% | 41.87% | 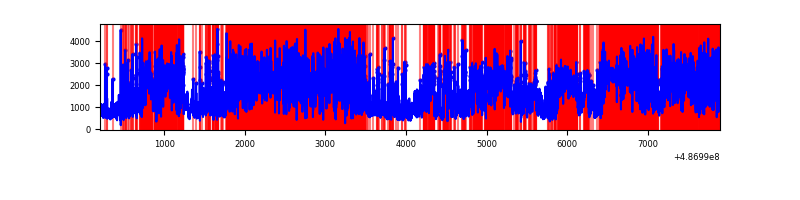 |
Top three noisy pixels from each quadrant. If the there are fewer than three noisy pixels in the level2.evt file, extra rows are filled as -1
| Pixel properties | Quadrant properties | ||||||
|---|---|---|---|---|---|---|---|
| Quadrant | DetID | PixID | Counts | Sigma | Mean | Median | Sigma |
| A | 8 | 26 | 554566 | 2778.29 | 799 | 779 | 199.3 |
| A | 4 | 3 | 175269 | 875.4 | 799 | 779 | 199.3 |
| A | 8 | 25 | 91645 | 455.86 | 799 | 779 | 199.3 |
| B | 4 | 81 | 244184 | 1430.07 | 789 | 762 | 170.2 |
| B | 4 | 171 | 87866 | 511.72 | 789 | 762 | 170.2 |
| B | 7 | 236 | 80408 | 467.91 | 789 | 762 | 170.2 |
| C | 1 | 45 | 1306375 | 6612.97 | 723 | 720 | 197.4 |
| C | 15 | 147 | 1241988 | 6286.86 | 723 | 720 | 197.4 |
| C | 15 | 231 | 1171013 | 5927.38 | 723 | 720 | 197.4 |
| D | 12 | 17 | 4390520 | 25371.52 | 596 | 569 | 173.0 |
| D | 12 | 18 | 4090651 | 23638.44 | 596 | 569 | 173.0 |
| D | 15 | 78 | 599266 | 3460.14 | 596 | 569 | 173.0 |
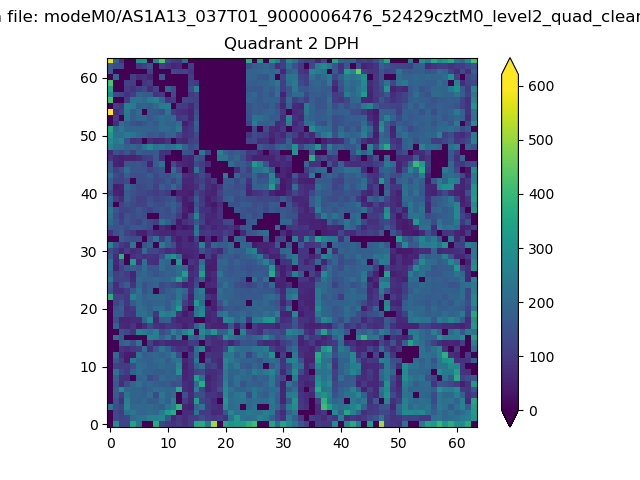
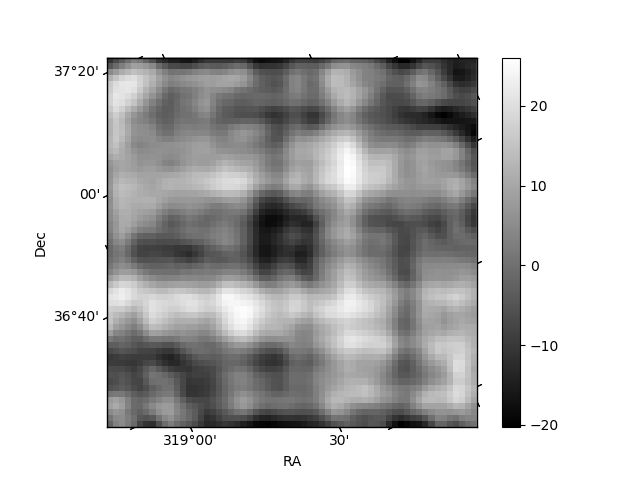
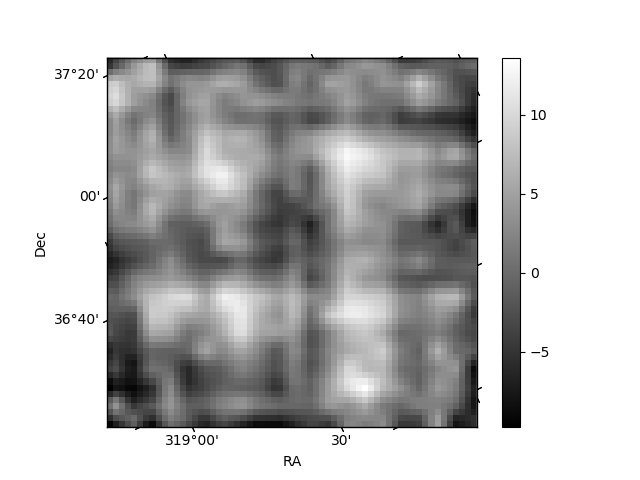
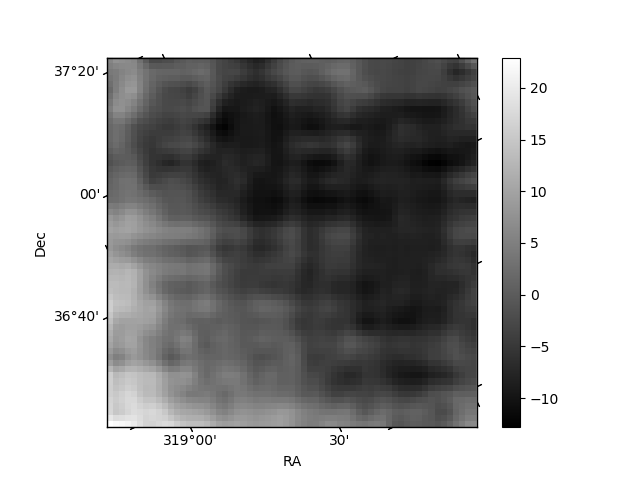
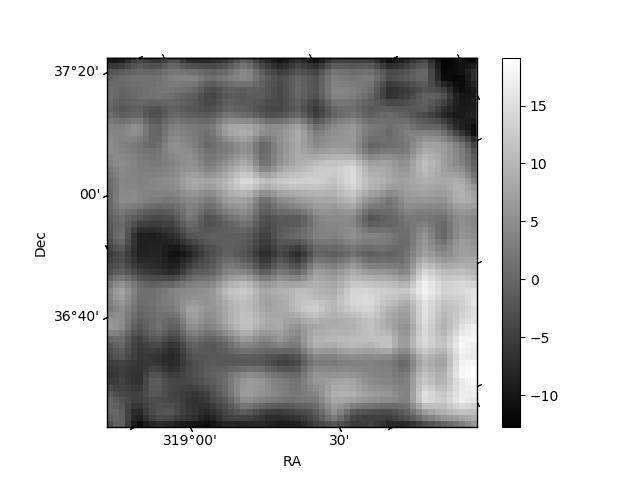
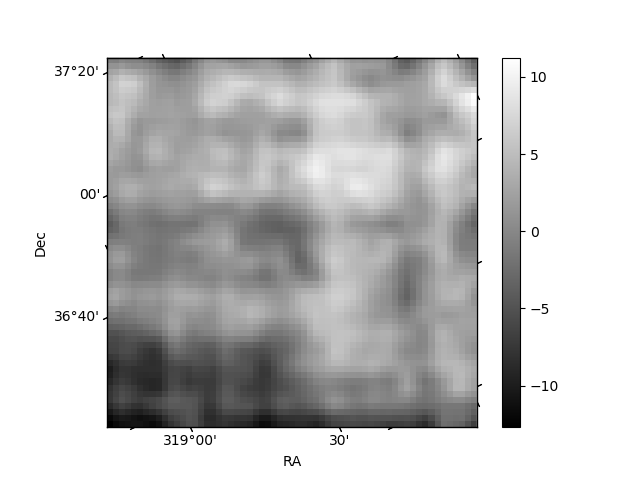
Histogram calculated using DETX and DETY for each event in the final _common_clean file
| Quadrant A | 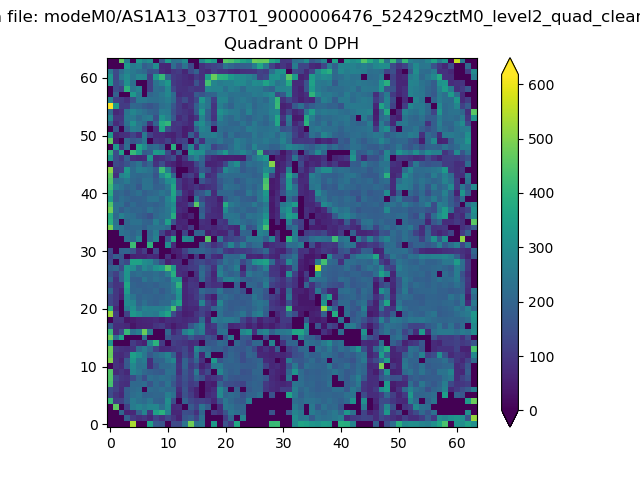 |
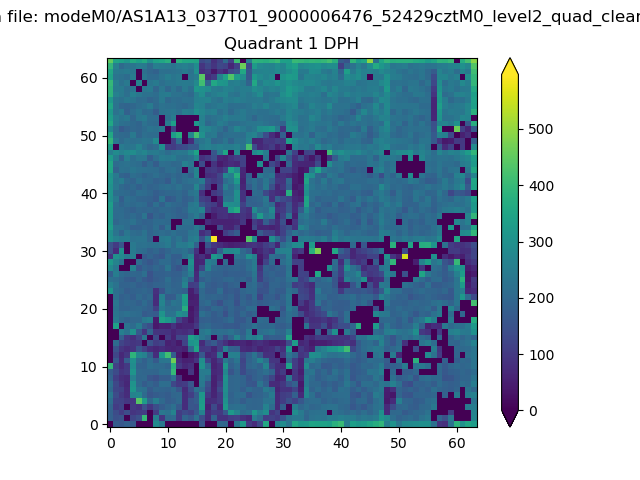 |
Quadrant B |
|---|---|---|---|
| Quadrant D | 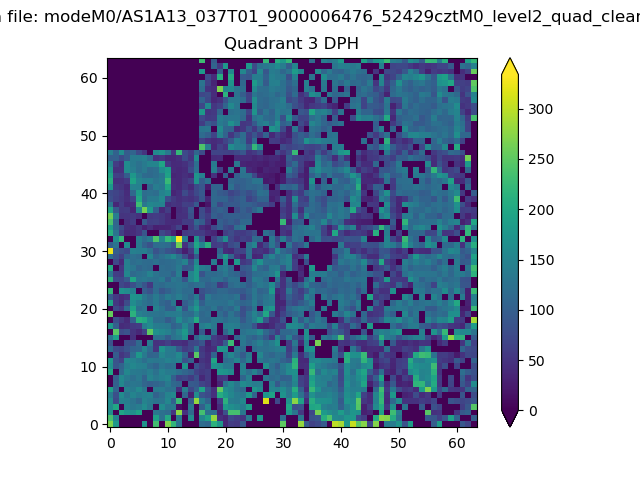 |
 |
Quadrant C |
| Plot type | Count rate plots | Images |
|---|---|---|
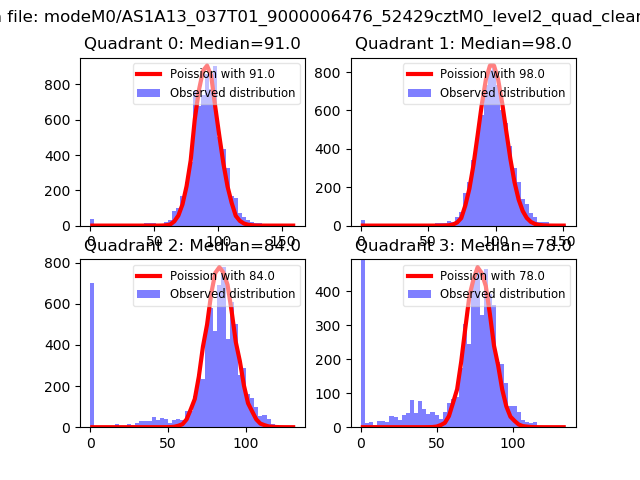
| Comparison with Poisson distribution Blue bars denote a histogram of data divided into 1 sec bins. Red curve is a Poisson curve with rate = median count rate of data. |
 |
 |
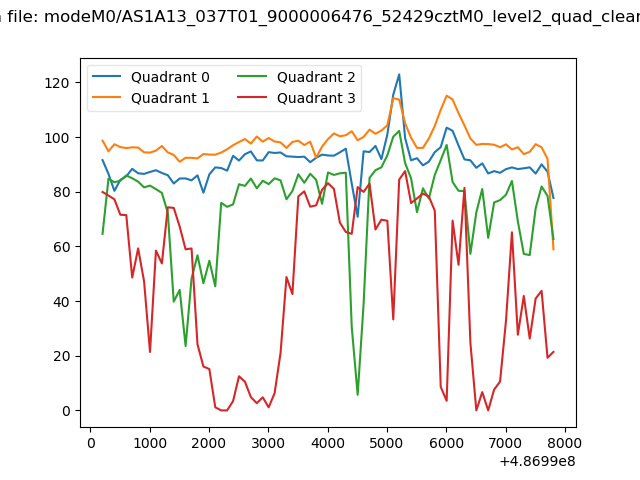
| Quadrant-wise count rates Data is divided into 100 sec bins |
 |
|
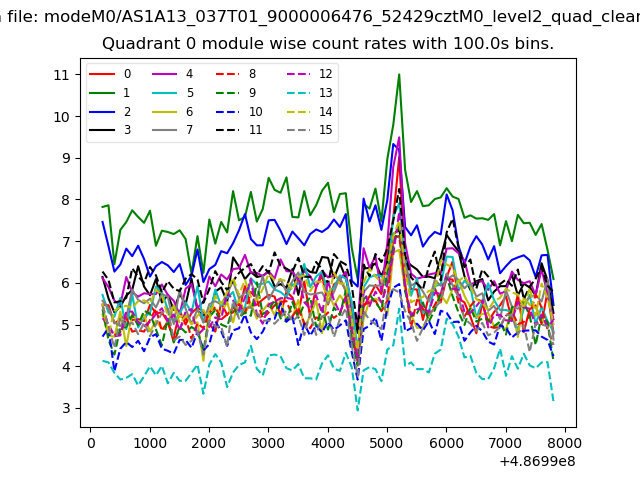
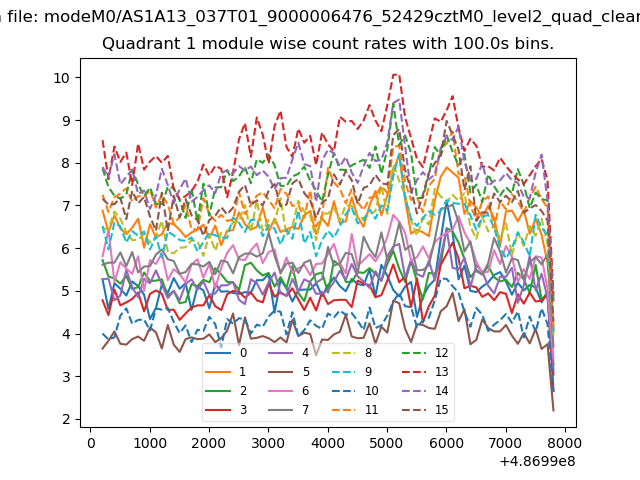
| Module-wise count rates for Quadrant A Data is divided into 100 sec bins |
 |
 |
| Module-wise count rates for Quadrant B Data is divided into 100 sec bins |
 |
 |
| Module-wise count rates for Quadrant C Data is divided into 100 sec bins |
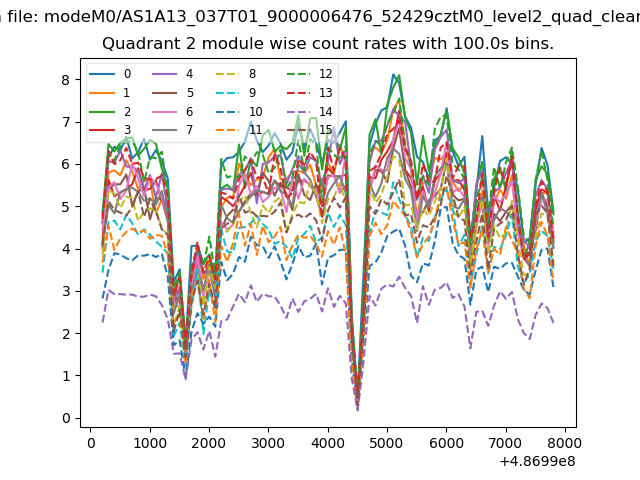 |
 |
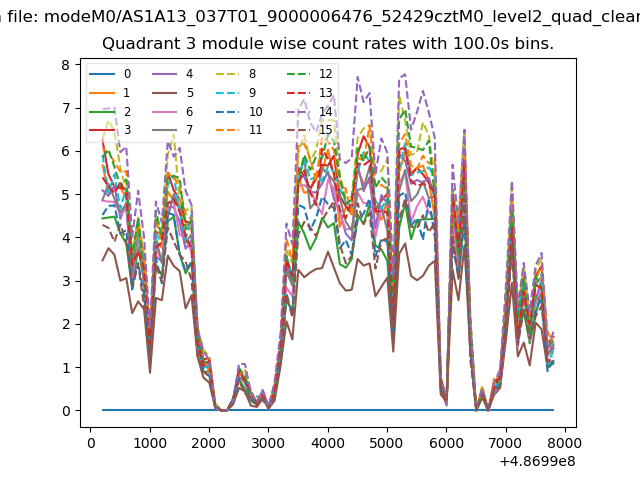
| Module-wise count rates for Quadrant D Data is divided into 100 sec bins |
 |
 |
| Parameter | Plot |
|---|---|
| CZT HV Monitor | 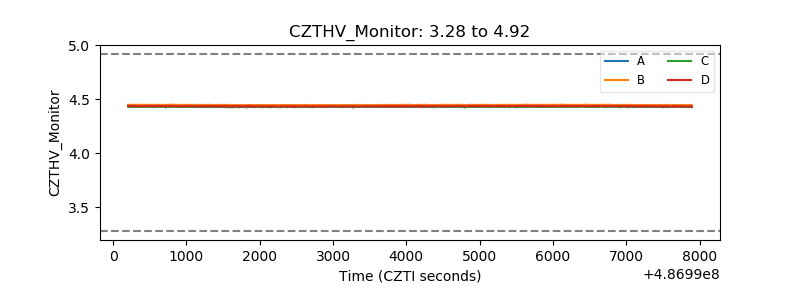 |
| D_VDD | 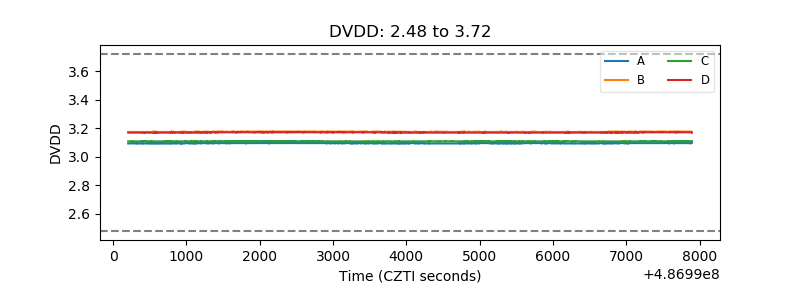 |
| Temperature 1 | 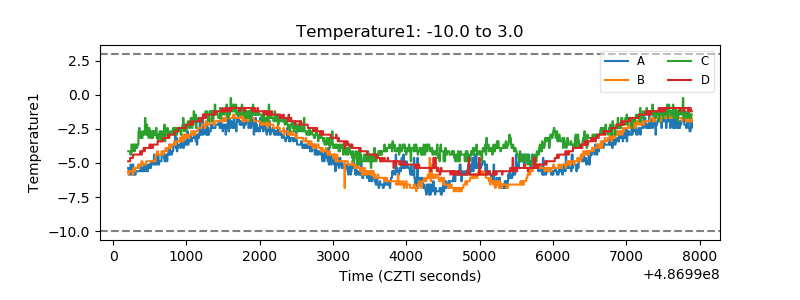 |
| Veto HV Monitor | 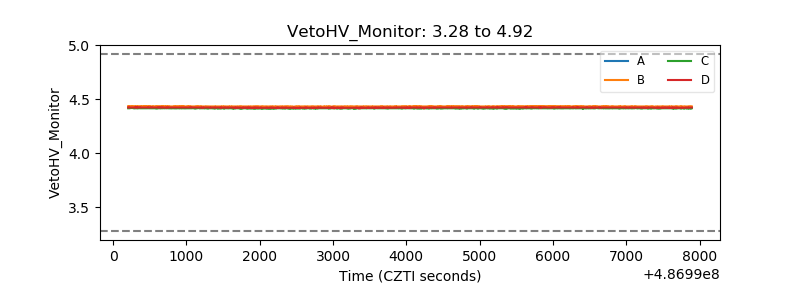 |
| Veto LLD | 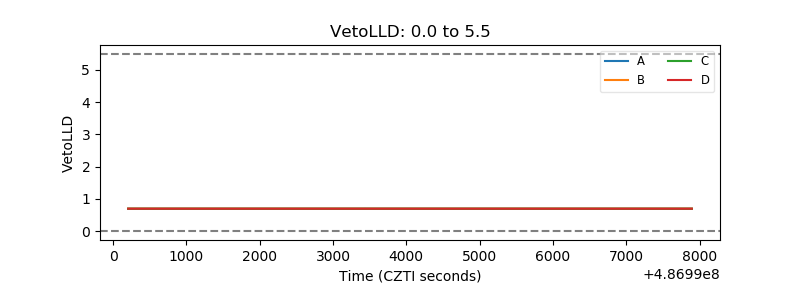 |
| Alpha Counter | 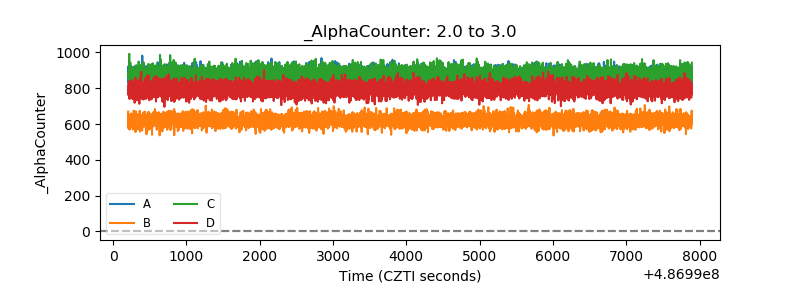 |
| _CPM_Rate | 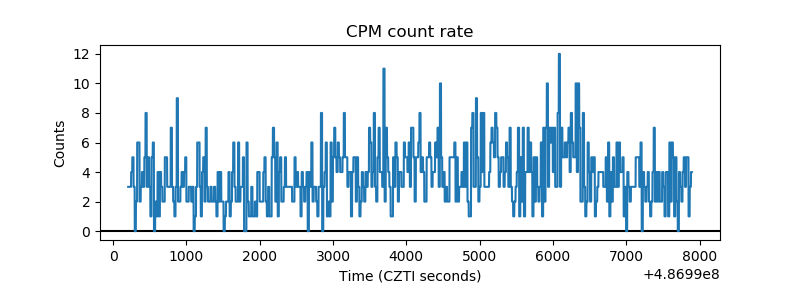 |
| CZT Counter | 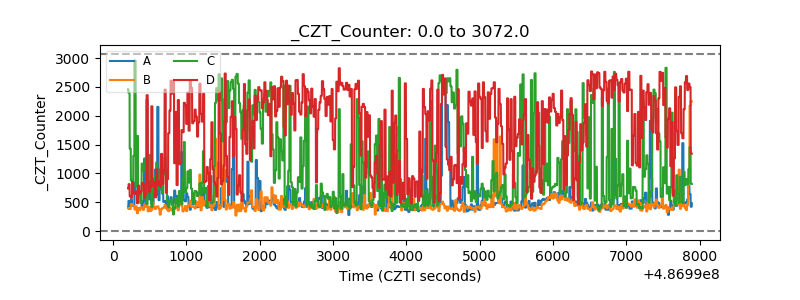 |
| +2.5 Volts monitor | 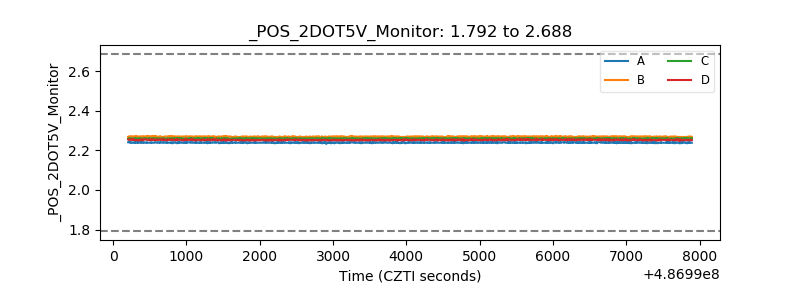 |
| +5 Volts monitor |  |
| _ROLL_ROT | 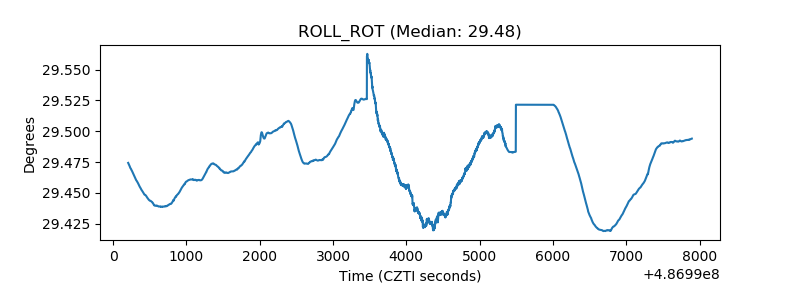 |
| _Roll_DEC | 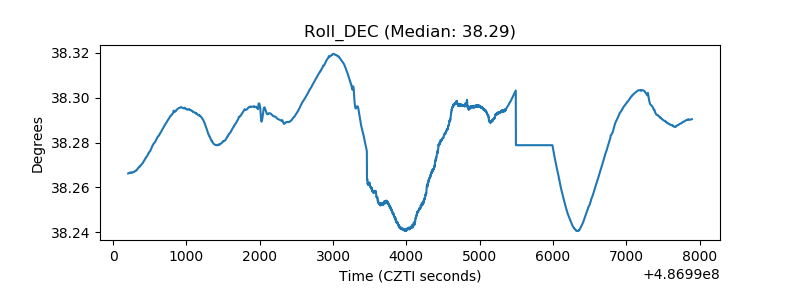 |
| _Roll_RA | 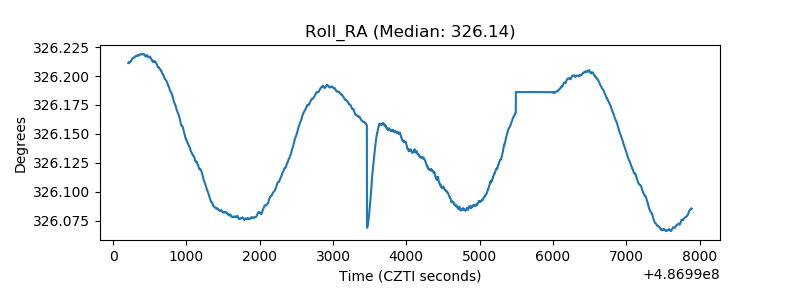 |
| Veto Counter | 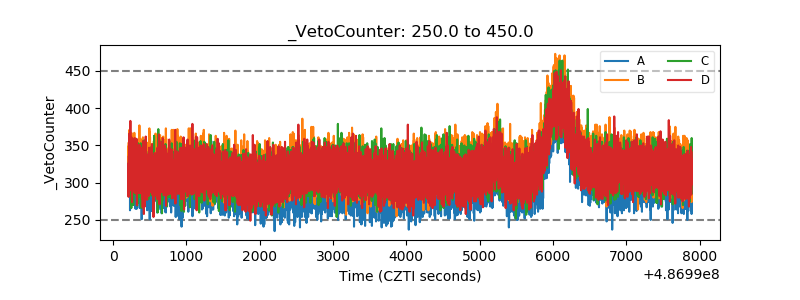 |