| Param | Original file | Final file |
|---|---|---|
| Filename | modeM0/AS1A13_037T01_9000006476_52430cztM0_level2.fits | modeM0/AS1A13_037T01_9000006476_52430cztM0_level2_quad_clean.evt |
| Size (bytes) | 870,744,960 | 102,375,360 |
| Size | 830.4 MB | 97.6 MB |
| Events in quadrant A | 4,292,108 | 746,881 |
| Events in quadrant B | 3,891,404 | 801,126 |
| Events in quadrant C | 9,157,494 | 602,547 |
| Events in quadrant D | 14,268,429 | 389,123 |
| Mode M0 | |||
|---|---|---|---|
| Quadrant | BADHDUFLAG | Total packets | Discarded packets |
| A | 0 | 18442 | 0 |
| B | 0 | 17366 | 0 |
| C | 0 | 32830 | 0 |
| D | 0 | 47925 | 3 |
| Mode SS | |||
|---|---|---|---|
| Quadrant | BADHDUFLAG | Total packets | Discarded packets |
| A | 0 | 162 | 0 |
| B | 0 | 162 | 0 |
| C | 0 | 162 | 0 |
| D | 0 | 162 | 0 |
| Quadrant | Total seconds | Saturated seconds | Saturation percentage |
|---|---|---|---|
| A | 8047 | 90 | 1.118429% |
| B | 8047 | 73 | 0.907170% |
| C | 8048 | 1435 | 17.830517% |
| D | 8047 | 3760 | 46.725488% |
Noise dominated data is calculated using 1-second bins in cleaned event files. If a bin has >2000 counts, and if more than 50% of those come from <1% of pixels, then it is considered to be noise-dominated and hence unusable.
| Quadrant | # 1 sec bins | Bins with >0 counts | Bins with >2000 counts | High rate bins dominated by noise | Noise dominated (total time) | Noise dominated (detector-on time) | Marked lightcurve |
|---|---|---|---|---|---|---|---|
| A | 8047 | 8047 | 56 | 56 | 0.70% | 0.70% | 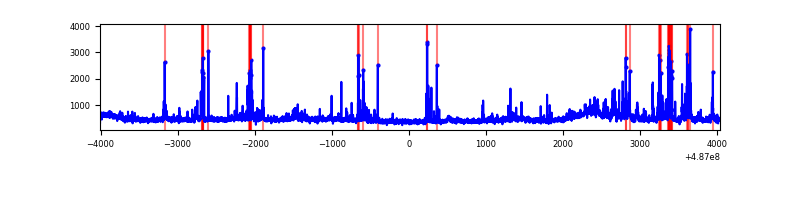 |
| B | 8047 | 8047 | 46 | 46 | 0.57% | 0.57% | 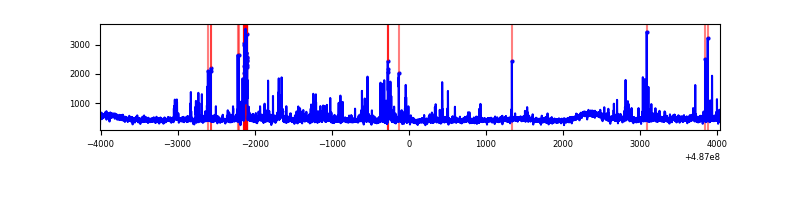 |
| C | 8048 | 8048 | 1229 | 1229 | 15.27% | 15.27% | 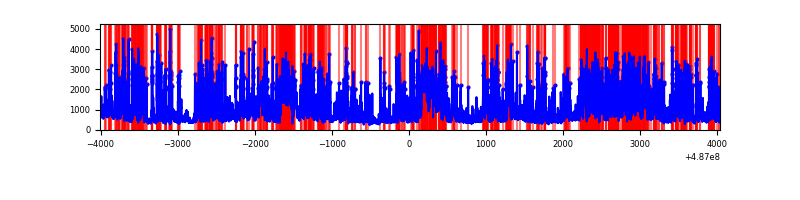 |
| D | 8046 | 8046 | 3387 | 3387 | 42.10% | 42.10% | 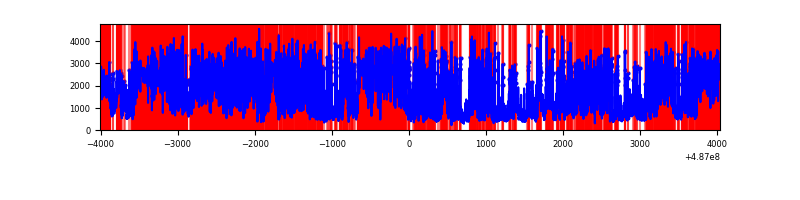 |
Top three noisy pixels from each quadrant. If the there are fewer than three noisy pixels in the level2.evt file, extra rows are filled as -1
| Pixel properties | Quadrant properties | ||||||
|---|---|---|---|---|---|---|---|
| Quadrant | DetID | PixID | Counts | Sigma | Mean | Median | Sigma |
| A | 8 | 26 | 195365 | 923.82 | 858 | 838 | 210.6 |
| A | 4 | 3 | 178784 | 845.08 | 858 | 838 | 210.6 |
| A | 7 | 206 | 154772 | 731.04 | 858 | 838 | 210.6 |
| B | 7 | 236 | 105413 | 576.03 | 846 | 817 | 181.6 |
| B | 4 | 81 | 86399 | 471.32 | 846 | 817 | 181.6 |
| B | 10 | 247 | 56656 | 307.52 | 846 | 817 | 181.6 |
| C | 15 | 231 | 1913087 | 9163.01 | 764 | 758 | 208.7 |
| C | 15 | 178 | 1847537 | 8848.92 | 764 | 758 | 208.7 |
| C | 15 | 224 | 765993 | 3666.66 | 764 | 758 | 208.7 |
| D | 12 | 2 | 3246270 | 17060.15 | 657 | 627 | 190.2 |
| D | 12 | 17 | 3233157 | 16991.22 | 657 | 627 | 190.2 |
| D | 12 | 18 | 1314518 | 6906.24 | 657 | 627 | 190.2 |
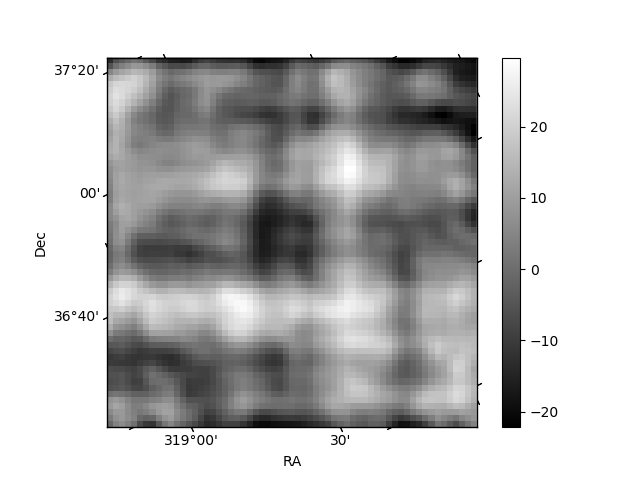
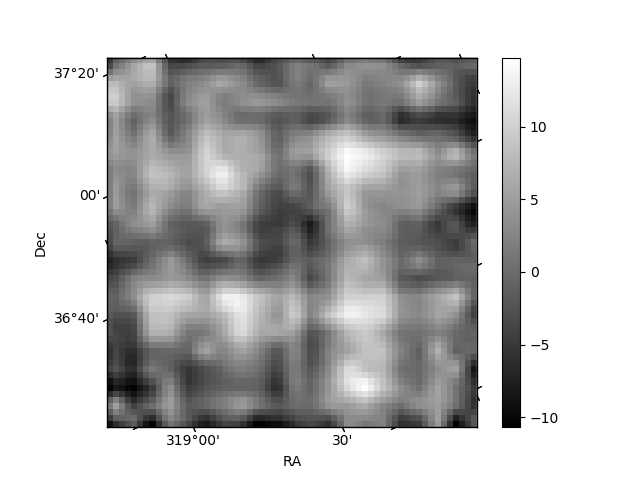
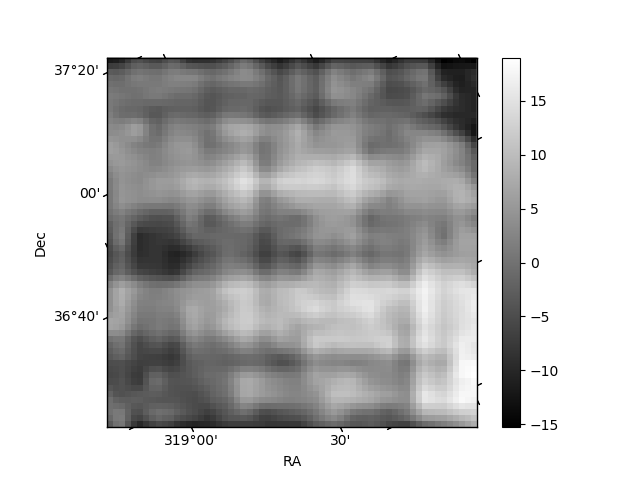
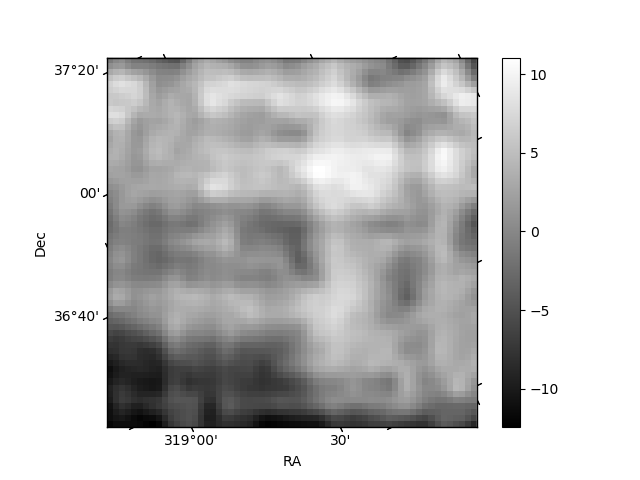
Histogram calculated using DETX and DETY for each event in the final _common_clean file
| Quadrant A | 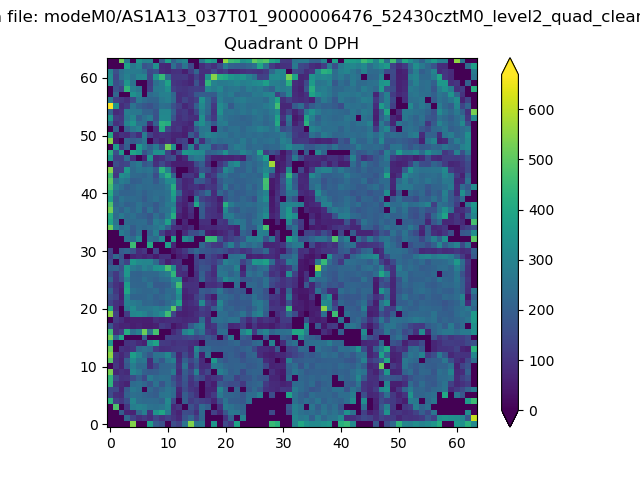 |
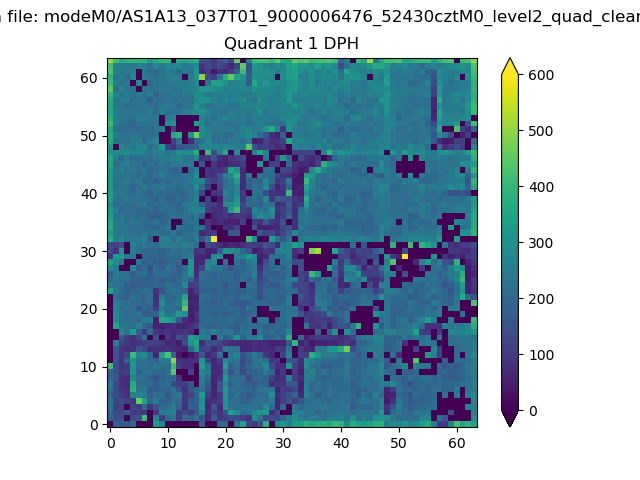 |
Quadrant B |
|---|---|---|---|
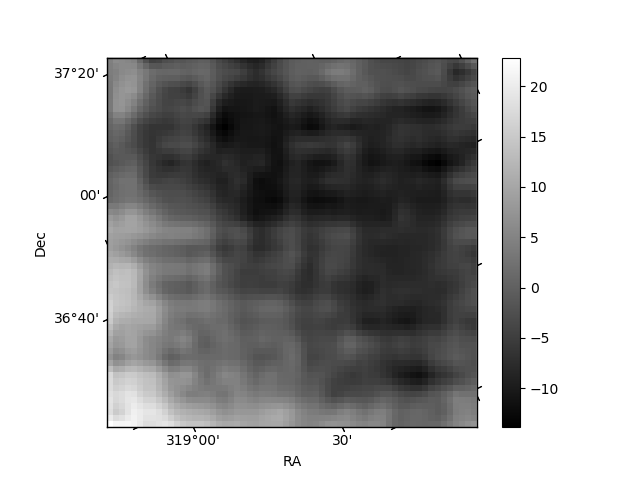
| Quadrant D | 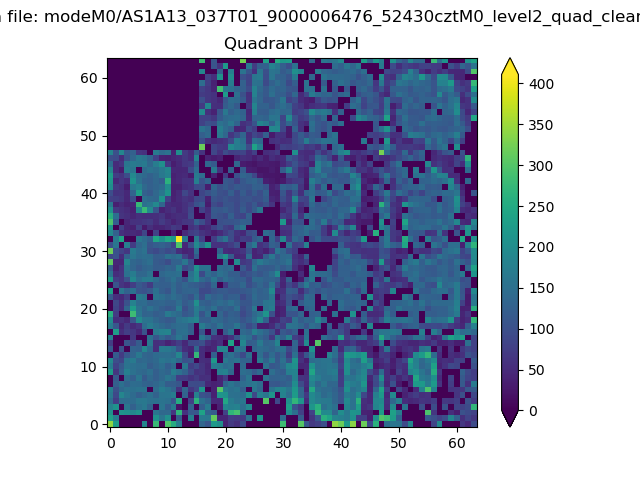 |
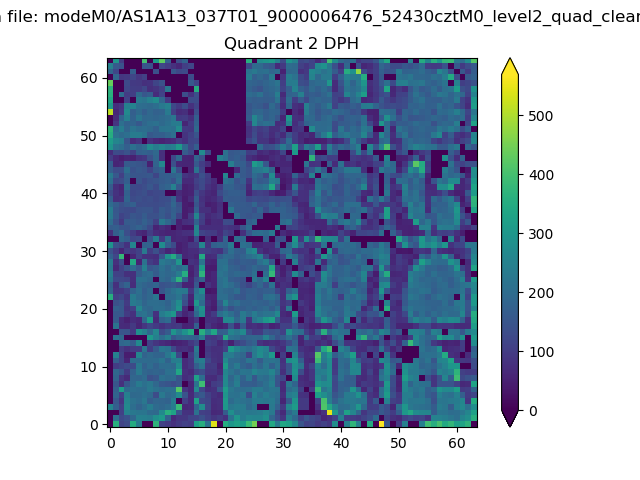 |
Quadrant C |
| Plot type | Count rate plots | Images |
|---|---|---|
| Comparison with Poisson distribution Blue bars denote a histogram of data divided into 1 sec bins. Red curve is a Poisson curve with rate = median count rate of data. |
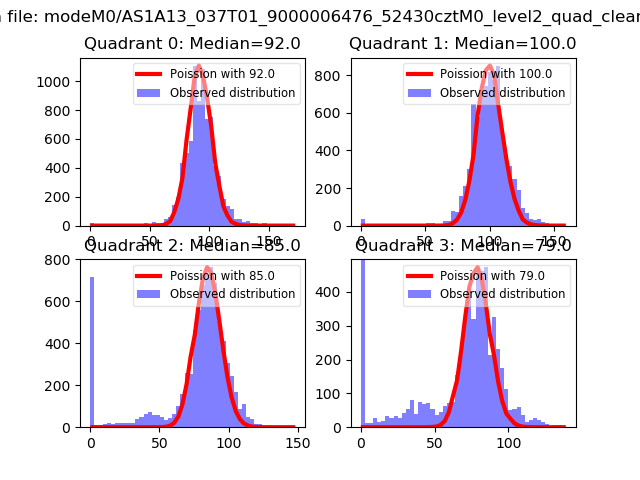 |
 |
| Quadrant-wise count rates Data is divided into 100 sec bins |
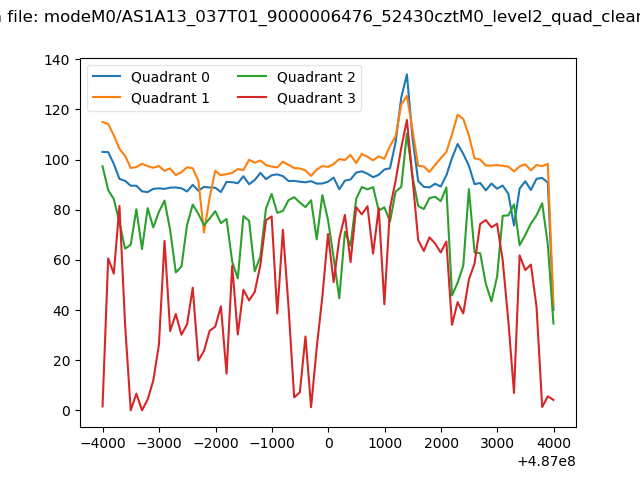 |
|
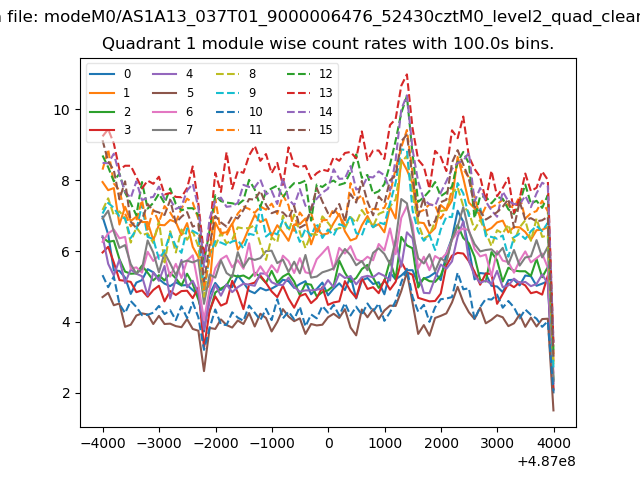
| Module-wise count rates for Quadrant A Data is divided into 100 sec bins |
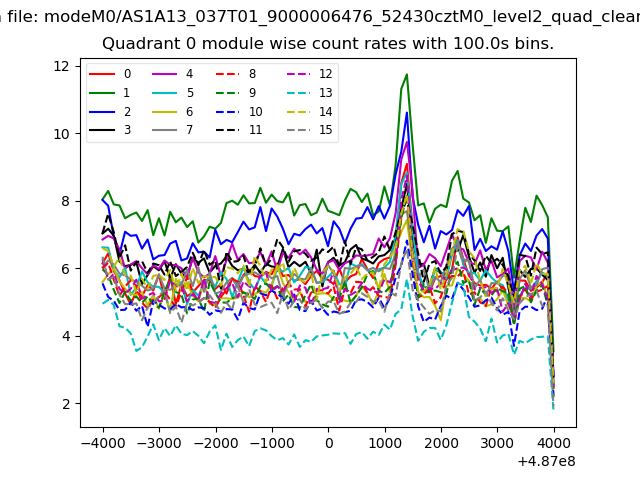 |
 |
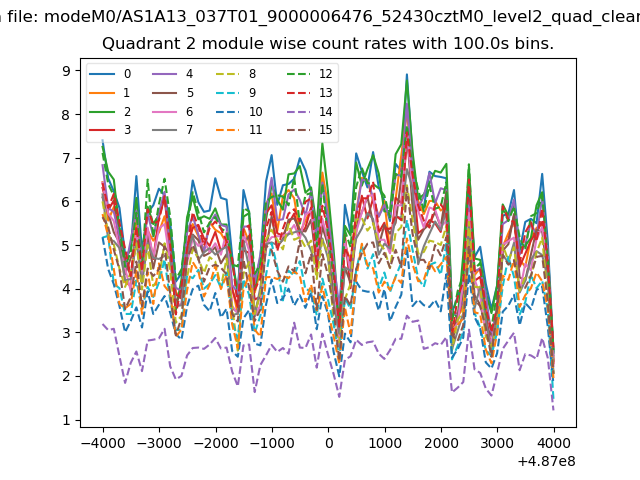
| Module-wise count rates for Quadrant B Data is divided into 100 sec bins |
 |
 |
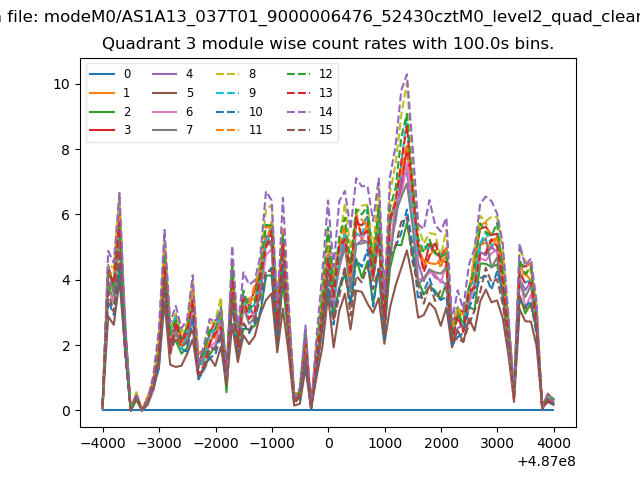
| Module-wise count rates for Quadrant C Data is divided into 100 sec bins |
 |
 |
| Module-wise count rates for Quadrant D Data is divided into 100 sec bins |
 |
 |
| Parameter | Plot |
|---|---|
| CZT HV Monitor |  |
| D_VDD | 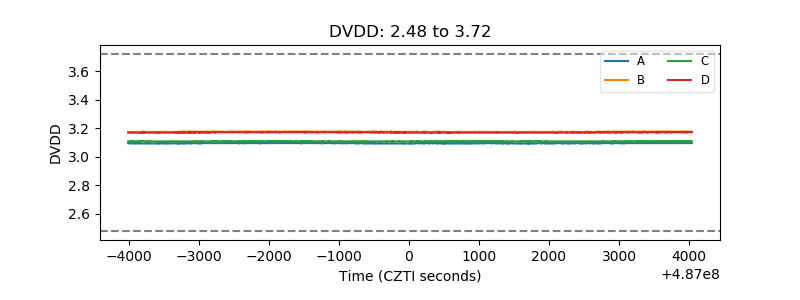 |
| Temperature 1 | 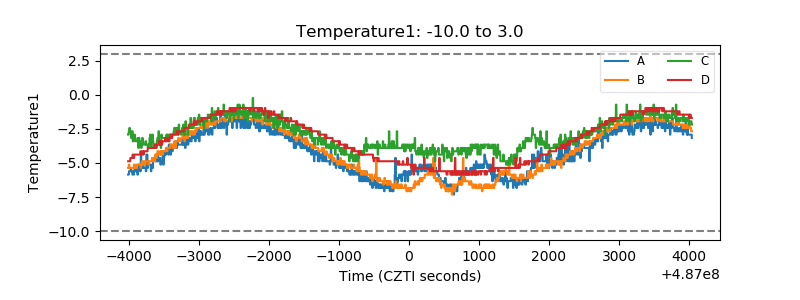 |
| Veto HV Monitor | 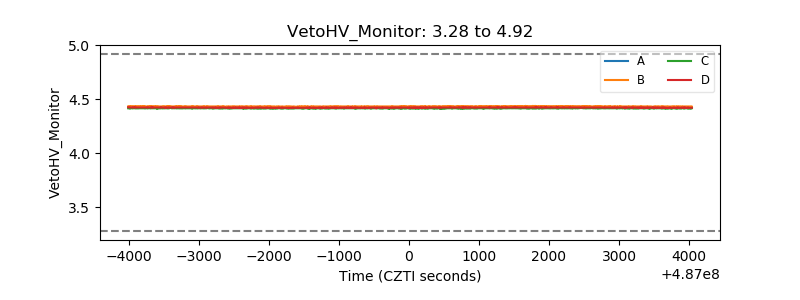 |
| Veto LLD | 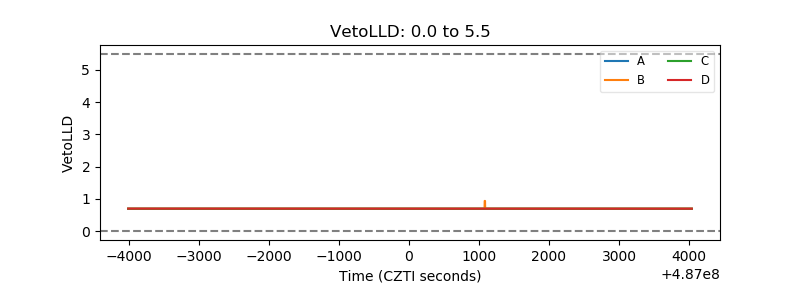 |
| Alpha Counter | 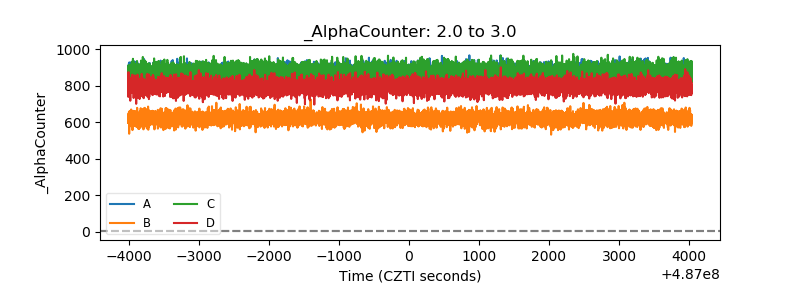 |
| _CPM_Rate | 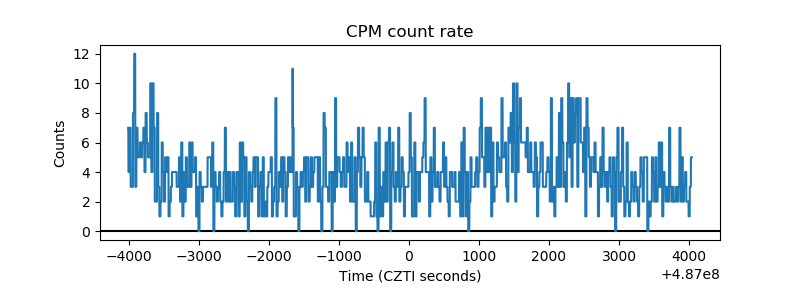 |
| CZT Counter | 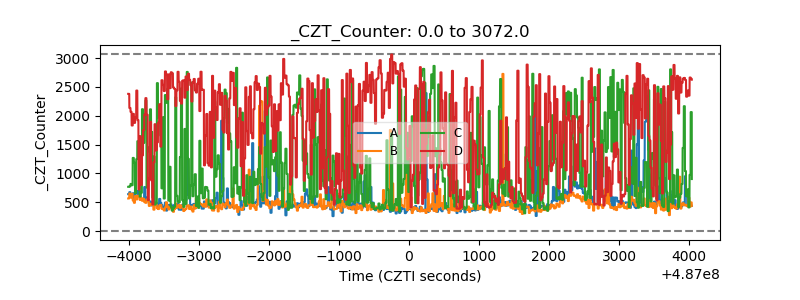 |
| +2.5 Volts monitor | 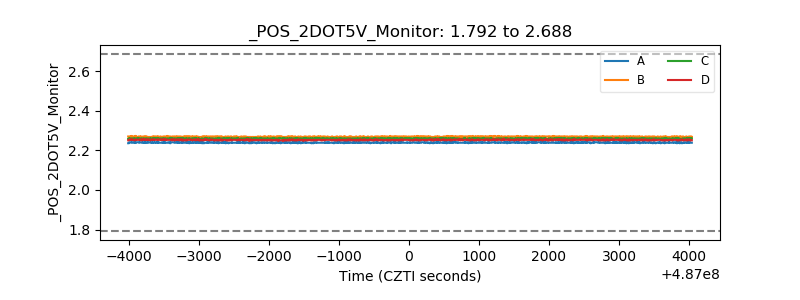 |
| +5 Volts monitor |  |
| _ROLL_ROT | 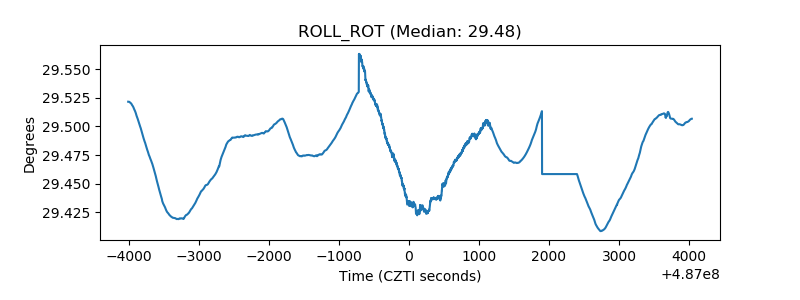 |
| _Roll_DEC | 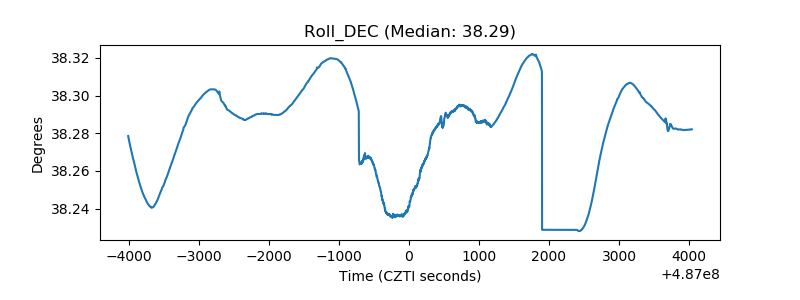 |
| _Roll_RA | 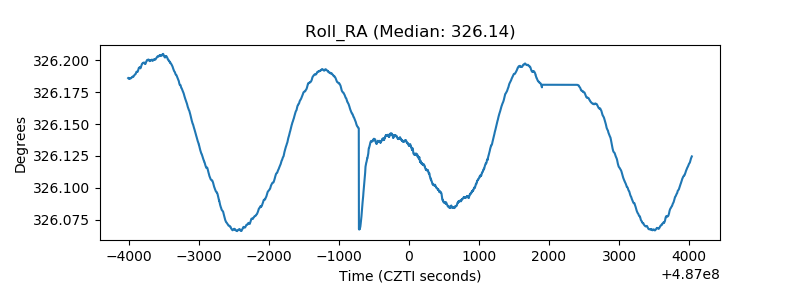 |
| Veto Counter | 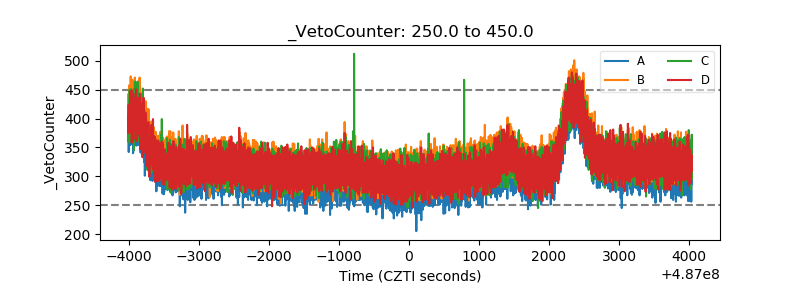 |