| Param | Original file | Final file |
|---|---|---|
| Filename | modeM0/AS1C09_011T06_9000006478_52514cztM0_level2.fits | modeM0/AS1C09_011T06_9000006478_52514cztM0_level2_quad_clean.evt |
| Size (bytes) | 818,372,160 | 82,396,800 |
| Size | 780.5 MB | 78.6 MB |
| Events in quadrant A | 3,023,114 | 691,533 |
| Events in quadrant B | 6,183,599 | 604,258 |
| Events in quadrant C | 12,259,269 | 267,579 |
| Events in quadrant D | 8,304,682 | 460,609 |
| Mode M0 | |||
|---|---|---|---|
| Quadrant | BADHDUFLAG | Total packets | Discarded packets |
| A | 0 | 14370 | 1 |
| B | 0 | 23164 | 1 |
| C | 0 | 41088 | 1 |
| D | 0 | 29373 | 1 |
| Mode M9 | |||
|---|---|---|---|
| Quadrant | BADHDUFLAG | Total packets | Discarded packets |
| A | 0 | 8 | 0 |
| B | 0 | 8 | 0 |
| C | 0 | 8 | 0 |
| D | 0 | 8 | 0 |
| Mode SS | |||
|---|---|---|---|
| Quadrant | BADHDUFLAG | Total packets | Discarded packets |
| A | 0 | 138 | 0 |
| B | 0 | 138 | 0 |
| C | 0 | 138 | 0 |
| D | 0 | 138 | 0 |
| Quadrant | Total seconds | Saturated seconds | Saturation percentage |
|---|---|---|---|
| A | 6749 | 108 | 1.600237% |
| B | 6750 | 946 | 14.014815% |
| C | 6750 | 4034 | 59.762963% |
| D | 6750 | 1328 | 19.674074% |
Noise dominated data is calculated using 1-second bins in cleaned event files. If a bin has >2000 counts, and if more than 50% of those come from <1% of pixels, then it is considered to be noise-dominated and hence unusable.
| Quadrant | # 1 sec bins | Bins with >0 counts | Bins with >2000 counts | High rate bins dominated by noise | Noise dominated (total time) | Noise dominated (detector-on time) | Marked lightcurve |
|---|---|---|---|---|---|---|---|
| A | 7544 | 6749 | 9 | 9 | 0.12% | 0.13% | 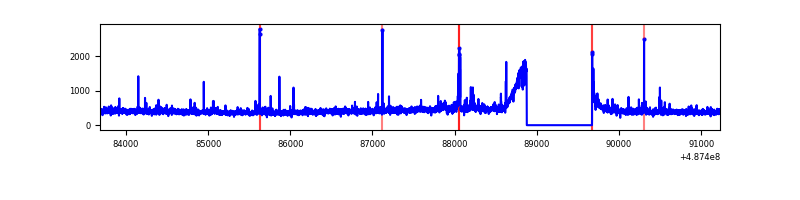 |
| B | 7545 | 6750 | 753 | 753 | 9.98% | 11.16% | 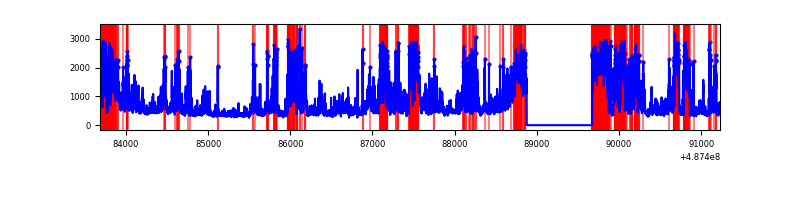 |
| C | 7544 | 6749 | 3412 | 3412 | 45.23% | 50.56% | 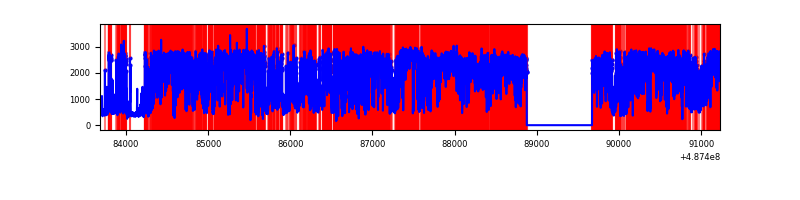 |
| D | 7545 | 6750 | 1414 | 1414 | 18.74% | 20.95% | 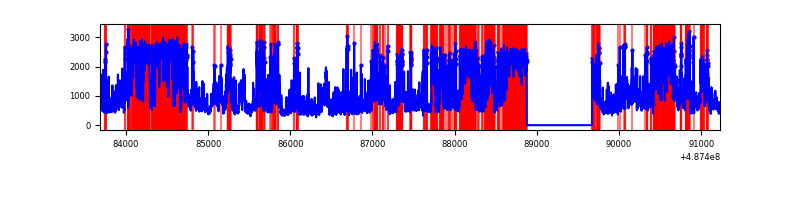 |
Top three noisy pixels from each quadrant. If the there are fewer than three noisy pixels in the level2.evt file, extra rows are filled as -1
| Pixel properties | Quadrant properties | ||||||
|---|---|---|---|---|---|---|---|
| Quadrant | DetID | PixID | Counts | Sigma | Mean | Median | Sigma |
| A | 3 | 62 | 57828 | 312.67 | 722 | 706 | 182.7 |
| A | 8 | 249 | 57287 | 309.71 | 722 | 706 | 182.7 |
| A | 11 | 3 | 27478 | 146.54 | 722 | 706 | 182.7 |
| B | 10 | 44 | 2218468 | 15760.42 | 654 | 631 | 140.7 |
| B | 4 | 171 | 472251 | 3351.43 | 654 | 631 | 140.7 |
| B | 4 | 81 | 250369 | 1774.69 | 654 | 631 | 140.7 |
| C | 15 | 224 | 8535173 | 71356.2 | 424 | 419 | 119.6 |
| C | 15 | 233 | 1232448 | 10300.58 | 424 | 419 | 119.6 |
| C | 2 | 207 | 293295 | 2448.64 | 424 | 419 | 119.6 |
| D | 6 | 42 | 3422217 | 19202.03 | 615 | 585 | 178.2 |
| D | 15 | 93 | 1197777 | 6718.58 | 615 | 585 | 178.2 |
| D | 8 | 176 | 476286 | 2669.61 | 615 | 585 | 178.2 |
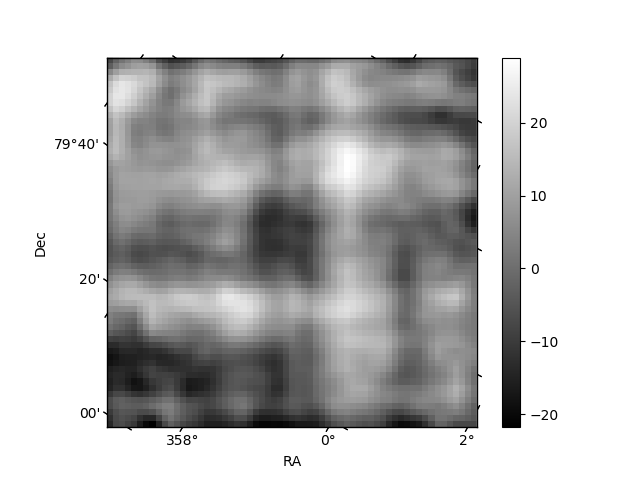
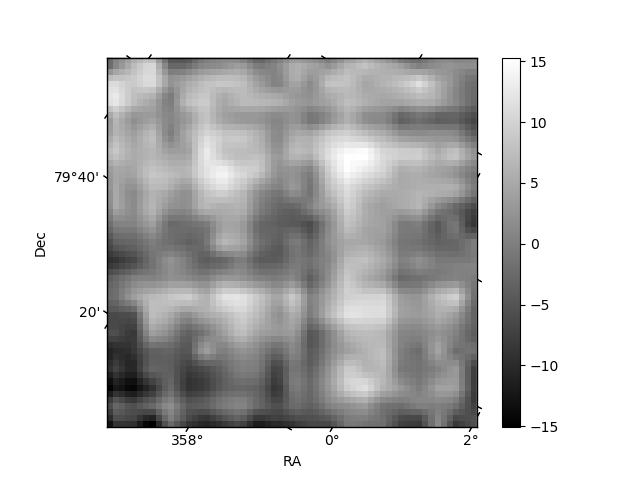
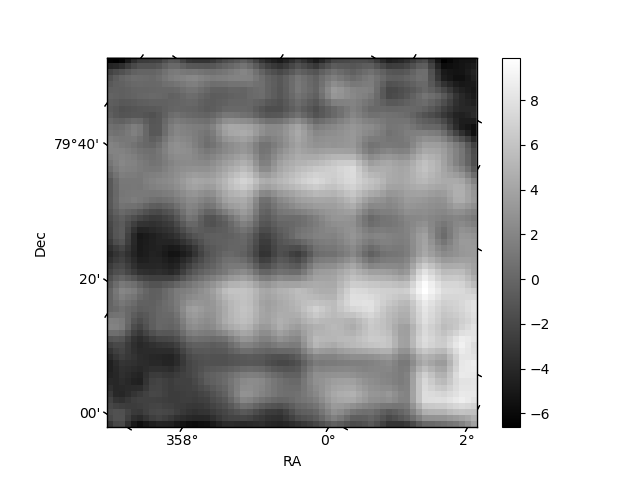
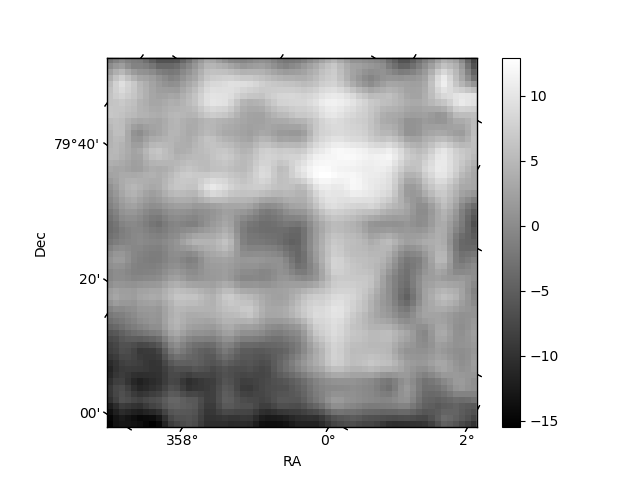
Histogram calculated using DETX and DETY for each event in the final _common_clean file
| Quadrant A | 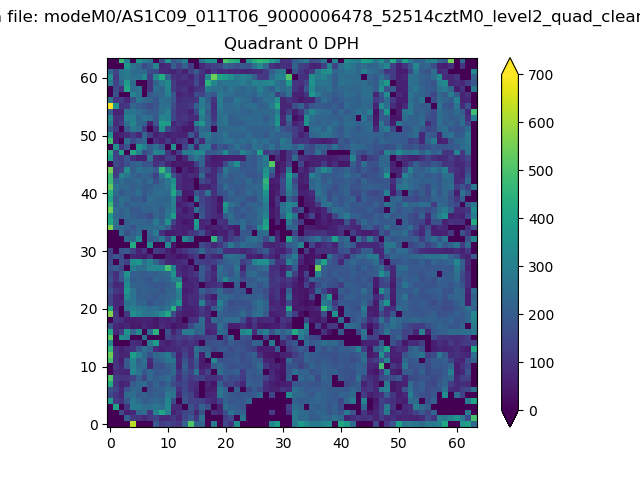 |
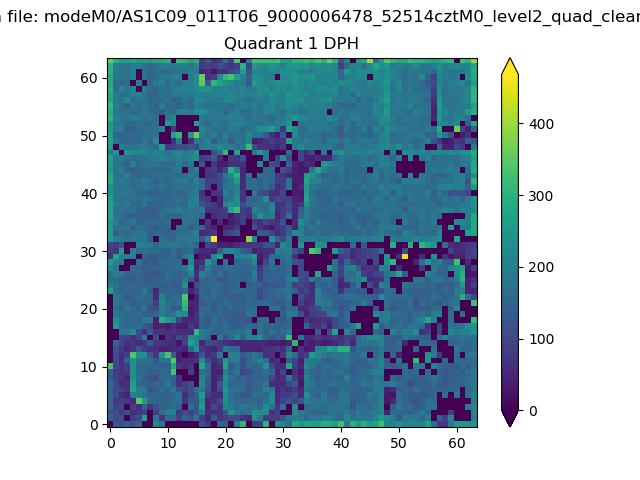 |
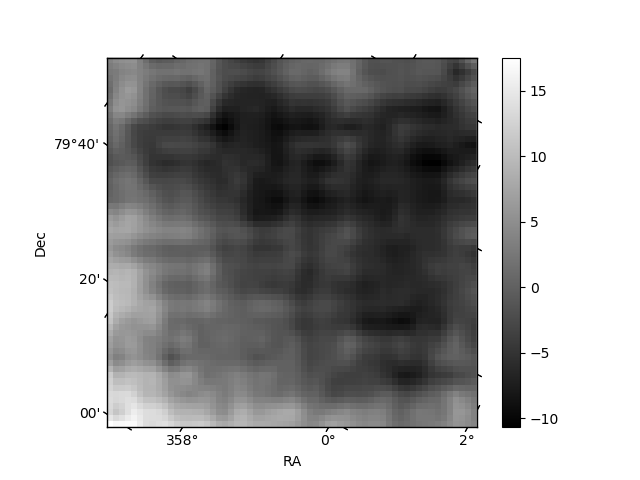
Quadrant B |
|---|---|---|---|
| Quadrant D | 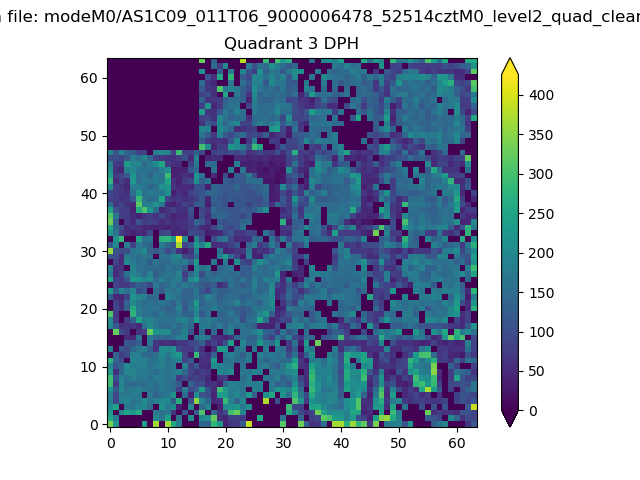 |
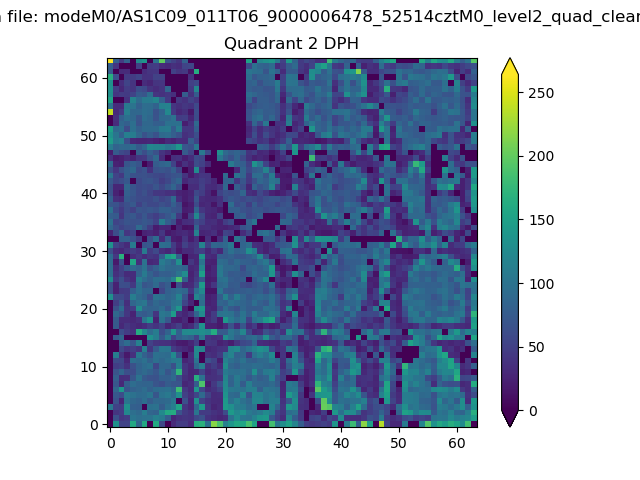 |
Quadrant C |
| Plot type | Count rate plots | Images |
|---|---|---|
| Comparison with Poisson distribution Blue bars denote a histogram of data divided into 1 sec bins. Red curve is a Poisson curve with rate = median count rate of data. |
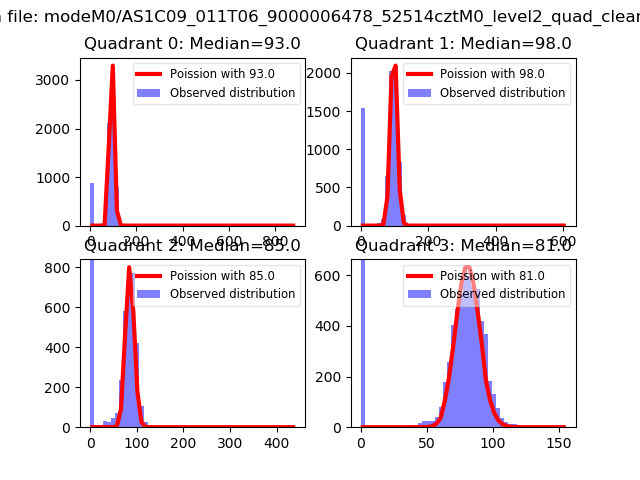 |
 |
| Quadrant-wise count rates Data is divided into 100 sec bins |
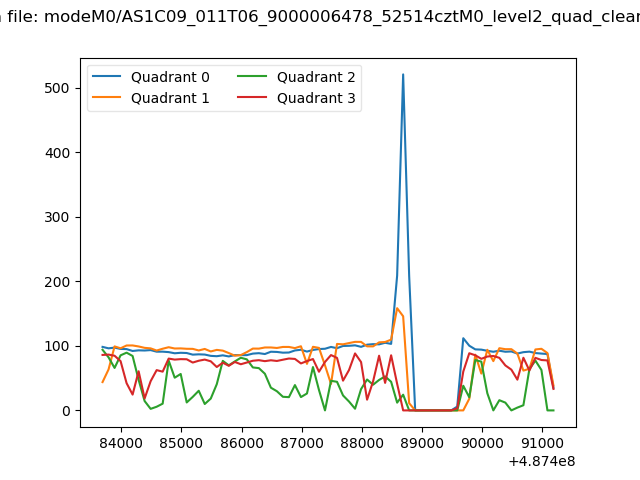 |
|
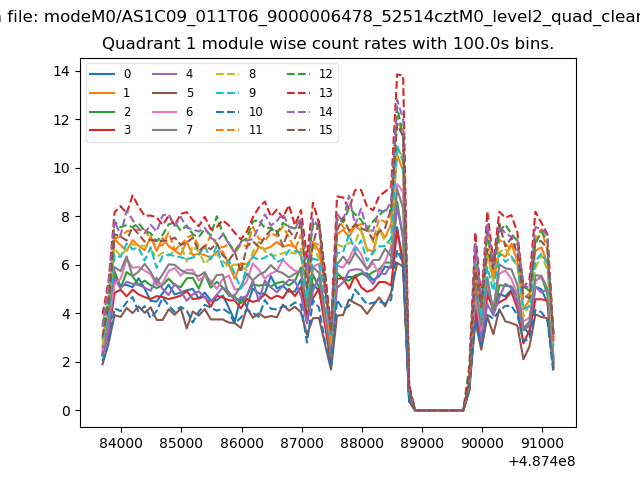
| Module-wise count rates for Quadrant A Data is divided into 100 sec bins |
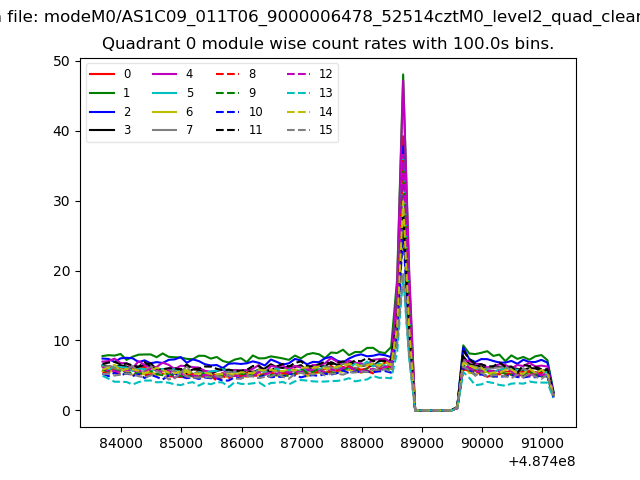 |
 |
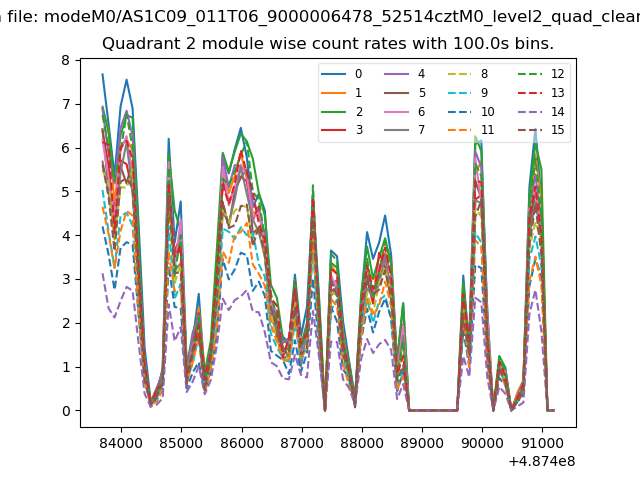
| Module-wise count rates for Quadrant B Data is divided into 100 sec bins |
 |
 |
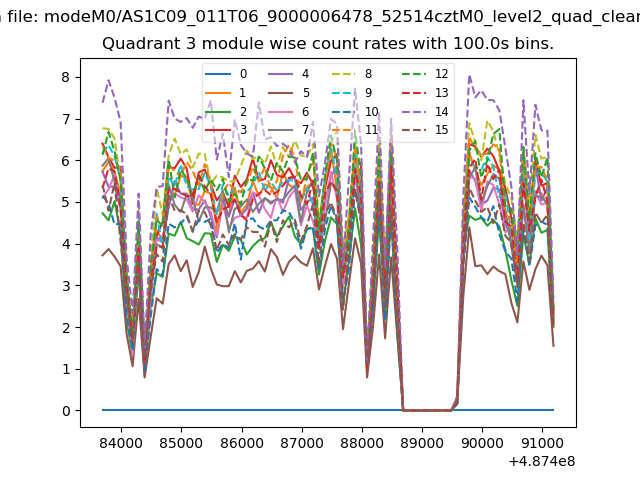
| Module-wise count rates for Quadrant C Data is divided into 100 sec bins |
 |
 |
| Module-wise count rates for Quadrant D Data is divided into 100 sec bins |
 |
 |
| Parameter | Plot |
|---|---|
| CZT HV Monitor | 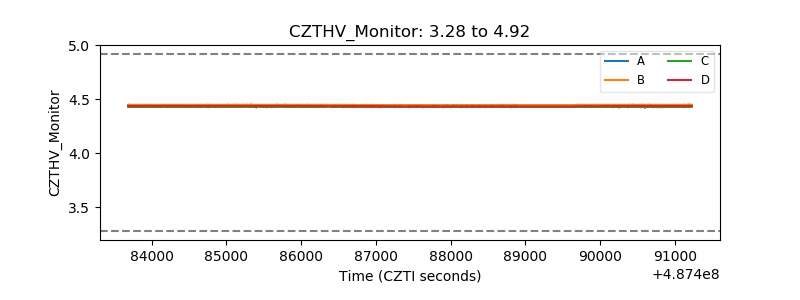 |
| D_VDD | 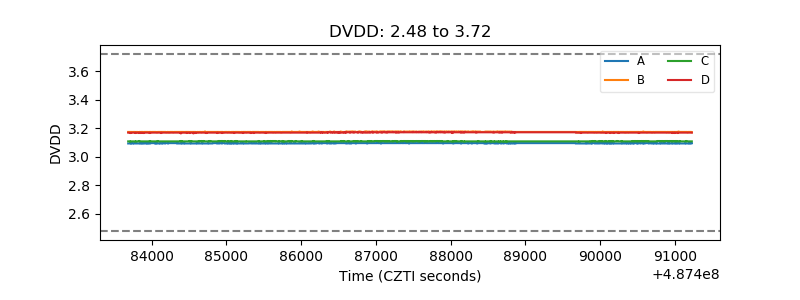 |
| Temperature 1 | 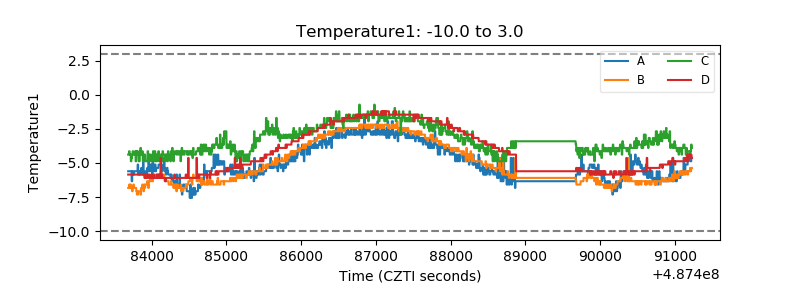 |
| Veto HV Monitor | 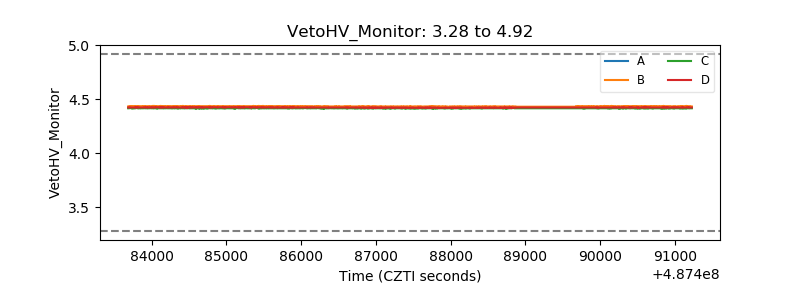 |
| Veto LLD | 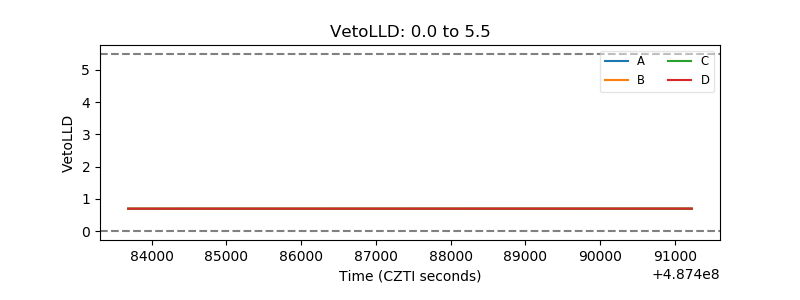 |
| Alpha Counter | 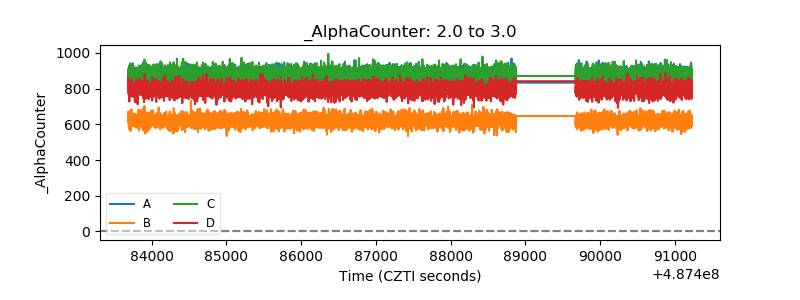 |
| _CPM_Rate | 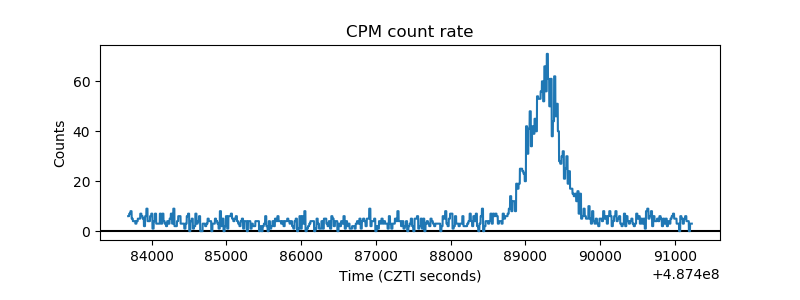 |
| CZT Counter | 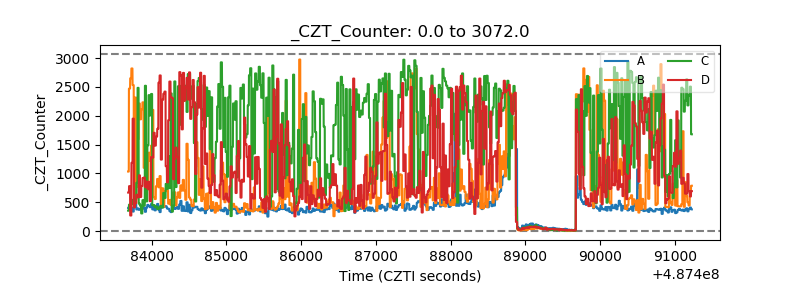 |
| +2.5 Volts monitor |  |
| +5 Volts monitor |  |
| _ROLL_ROT | 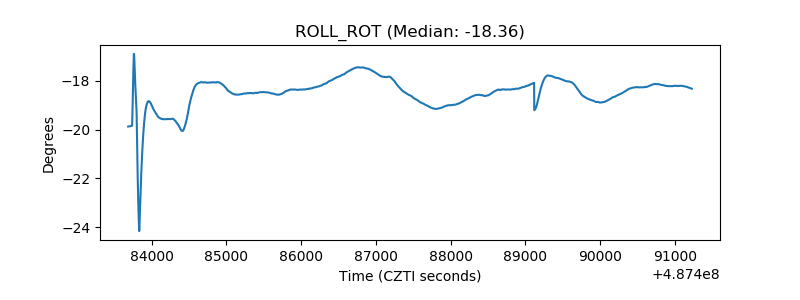 |
| _Roll_DEC | 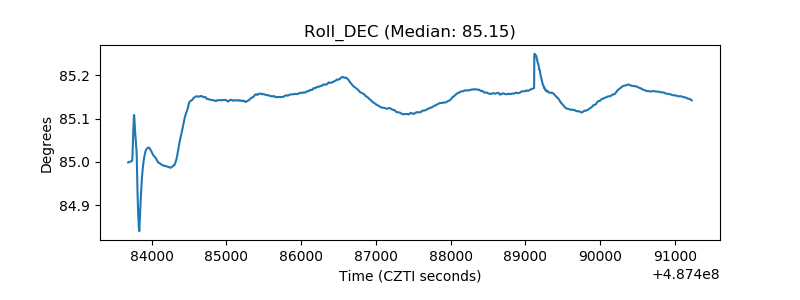 |
| _Roll_RA | 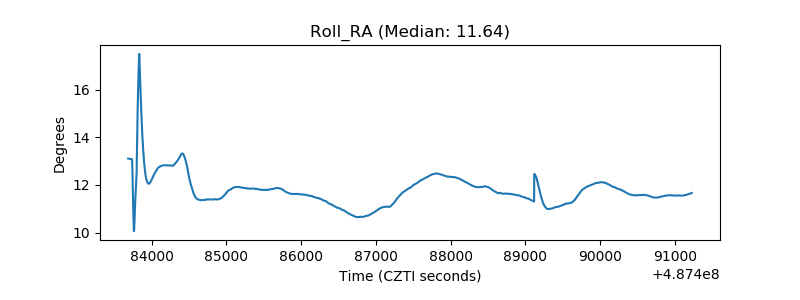 |
| Veto Counter | 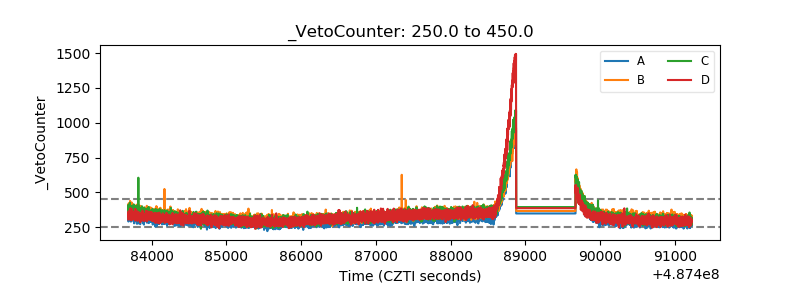 |