| Param | Original file | Final file |
|---|---|---|
| Filename | modeM0/AS1C09_011T06_9000006478_52527cztM0_level2.fits | modeM0/AS1C09_011T06_9000006478_52527cztM0_level2_quad_clean.evt |
| Size (bytes) | 928,149,120 | 133,416,000 |
| Size | 885.2 MB | 127.2 MB |
| Events in quadrant A | 4,535,602 | 947,977 |
| Events in quadrant B | 5,985,044 | 1,002,423 |
| Events in quadrant C | 8,382,730 | 813,042 |
| Events in quadrant D | 14,680,270 | 583,839 |
| Mode M0 | |||
|---|---|---|---|
| Quadrant | BADHDUFLAG | Total packets | Discarded packets |
| A | 0 | 21298 | 2 |
| B | 0 | 25011 | 2 |
| C | 0 | 32153 | 3 |
| D | 0 | 50621 | 2 |
| Mode M9 | |||
|---|---|---|---|
| Quadrant | BADHDUFLAG | Total packets | Discarded packets |
| A | 0 | 24 | 0 |
| B | 0 | 24 | 0 |
| C | 0 | 24 | 0 |
| D | 0 | 24 | 0 |
| Mode SS | |||
|---|---|---|---|
| Quadrant | BADHDUFLAG | Total packets | Discarded packets |
| A | 0 | 202 | 0 |
| B | 0 | 202 | 0 |
| C | 0 | 202 | 0 |
| D | 0 | 202 | 0 |
| Quadrant | Total seconds | Saturated seconds | Saturation percentage |
|---|---|---|---|
| A | 9991 | 66 | 0.660595% |
| B | 9991 | 297 | 2.972675% |
| C | 9991 | 1089 | 10.899810% |
| D | 9991 | 3390 | 33.930537% |
Noise dominated data is calculated using 1-second bins in cleaned event files. If a bin has >2000 counts, and if more than 50% of those come from <1% of pixels, then it is considered to be noise-dominated and hence unusable.
| Quadrant | # 1 sec bins | Bins with >0 counts | Bins with >2000 counts | High rate bins dominated by noise | Noise dominated (total time) | Noise dominated (detector-on time) | Marked lightcurve |
|---|---|---|---|---|---|---|---|
| A | 12351 | 9993 | 30 | 30 | 0.24% | 0.30% | 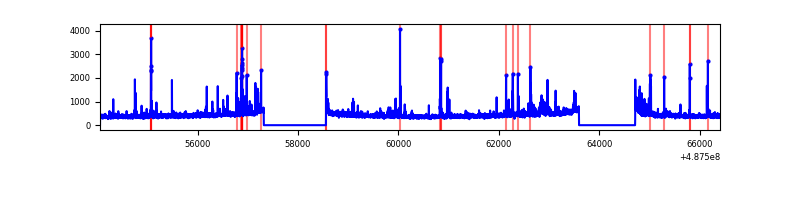 |
| B | 12351 | 9993 | 103 | 103 | 0.83% | 1.03% | 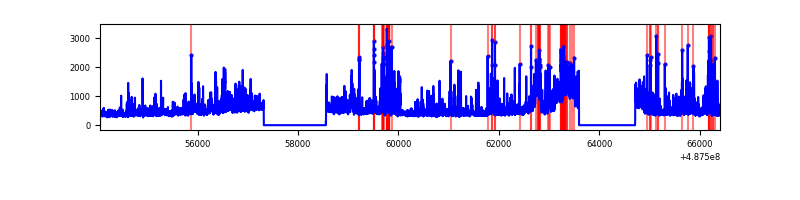 |
| C | 12351 | 9993 | 843 | 843 | 6.83% | 8.44% | 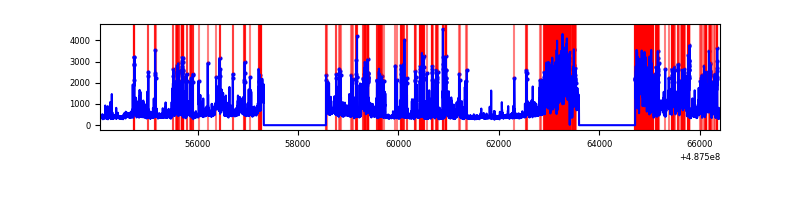 |
| D | 12351 | 9992 | 2940 | 2940 | 23.80% | 29.42% | 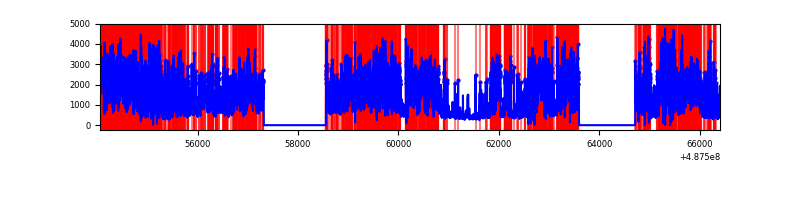 |
Top three noisy pixels from each quadrant. If the there are fewer than three noisy pixels in the level2.evt file, extra rows are filled as -1
| Pixel properties | Quadrant properties | ||||||
|---|---|---|---|---|---|---|---|
| Quadrant | DetID | PixID | Counts | Sigma | Mean | Median | Sigma |
| A | 13 | 248 | 93620 | 362.36 | 1030 | 1006 | 255.6 |
| A | 15 | 174 | 85156 | 329.25 | 1030 | 1006 | 255.6 |
| A | 3 | 14 | 60576 | 233.08 | 1030 | 1006 | 255.6 |
| B | 10 | 128 | 483646 | 2255.14 | 1019 | 986 | 214.0 |
| B | 12 | 32 | 329441 | 1534.65 | 1019 | 986 | 214.0 |
| B | 7 | 0 | 272169 | 1267.05 | 1019 | 986 | 214.0 |
| C | 15 | 224 | 1412432 | 5481.74 | 929 | 918 | 257.5 |
| C | 2 | 12 | 514705 | 1995.34 | 929 | 918 | 257.5 |
| C | 4 | 5 | 508329 | 1970.58 | 929 | 918 | 257.5 |
| D | 15 | 93 | 6205532 | 26481.11 | 804 | 766 | 234.3 |
| D | 6 | 42 | 2131703 | 9094.55 | 804 | 766 | 234.3 |
| D | 2 | 120 | 534649 | 2278.54 | 804 | 766 | 234.3 |
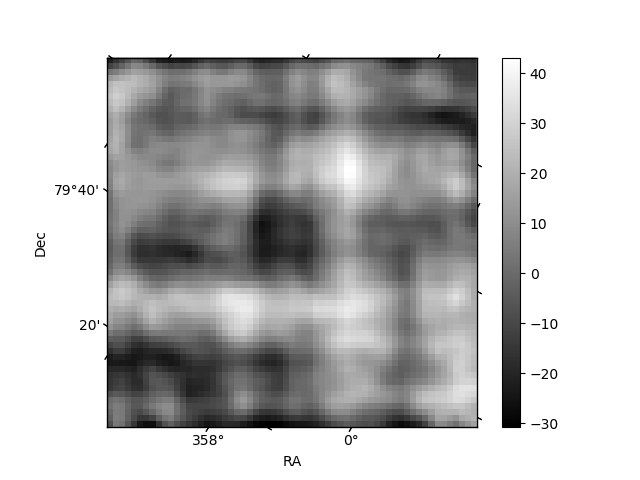
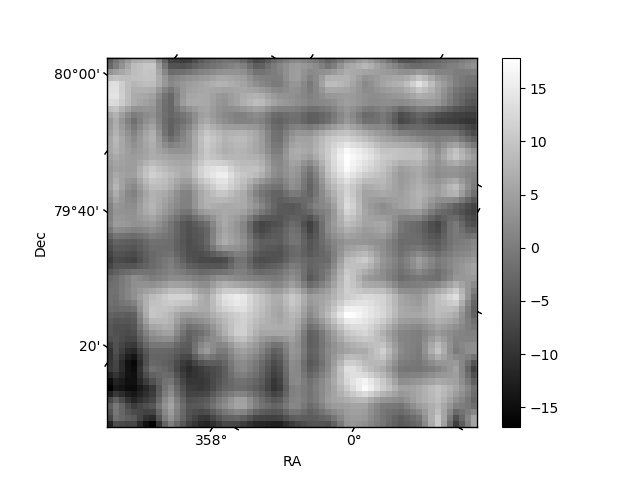
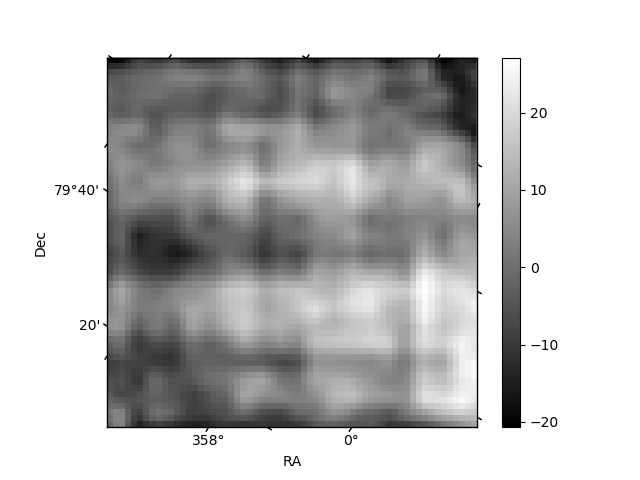
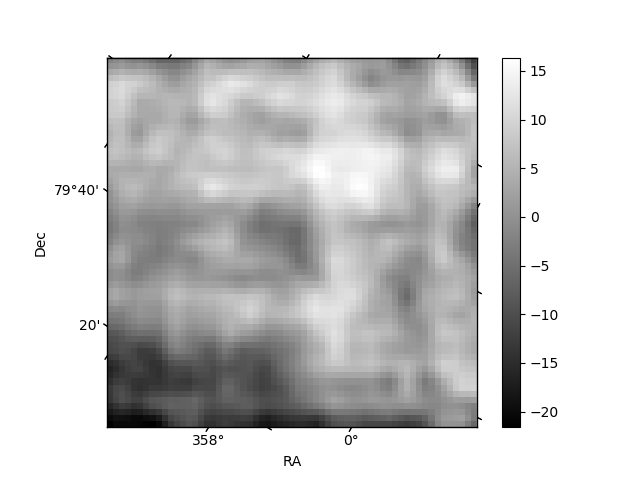
Histogram calculated using DETX and DETY for each event in the final _common_clean file
| Quadrant A | 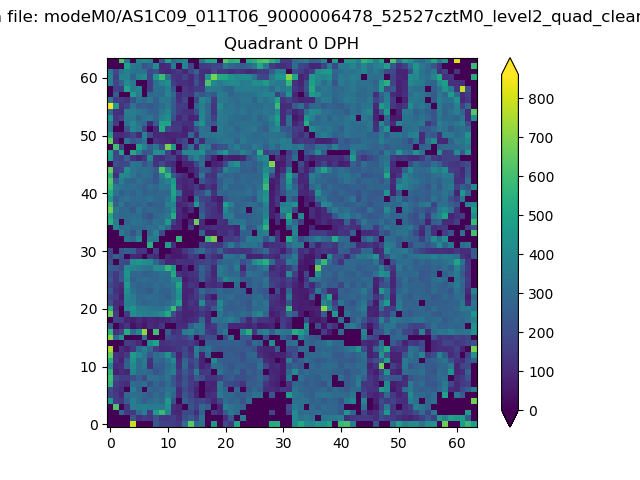 |
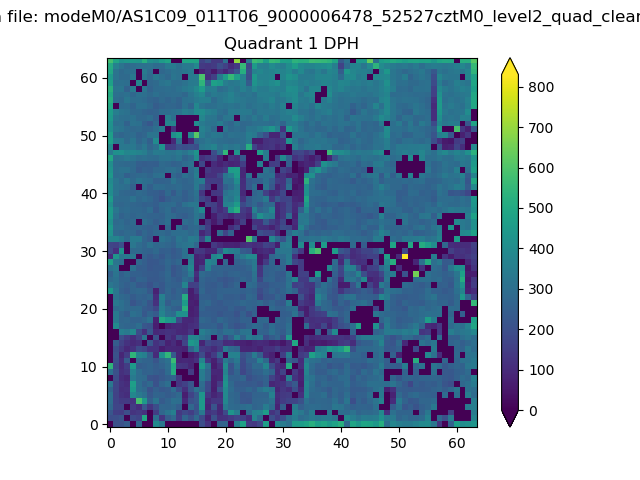 |
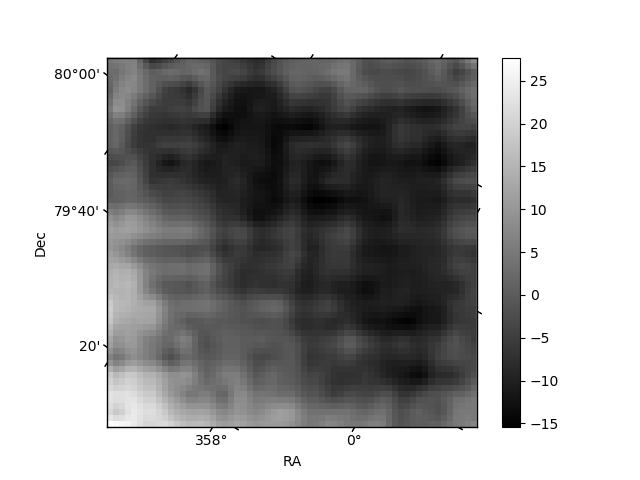
Quadrant B |
|---|---|---|---|
| Quadrant D | 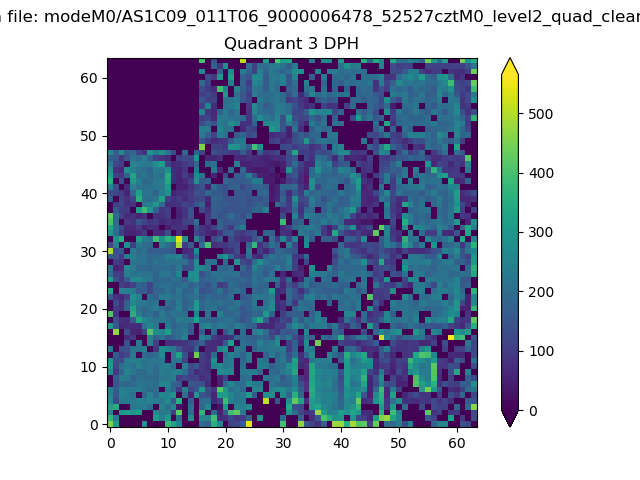 |
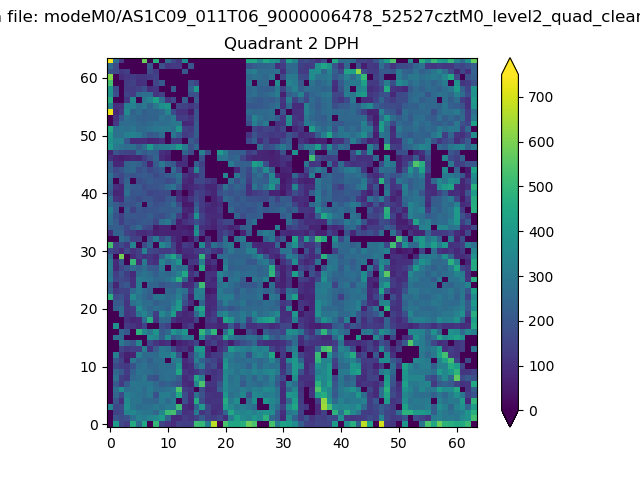 |
Quadrant C |
| Plot type | Count rate plots | Images |
|---|---|---|
| Comparison with Poisson distribution Blue bars denote a histogram of data divided into 1 sec bins. Red curve is a Poisson curve with rate = median count rate of data. |
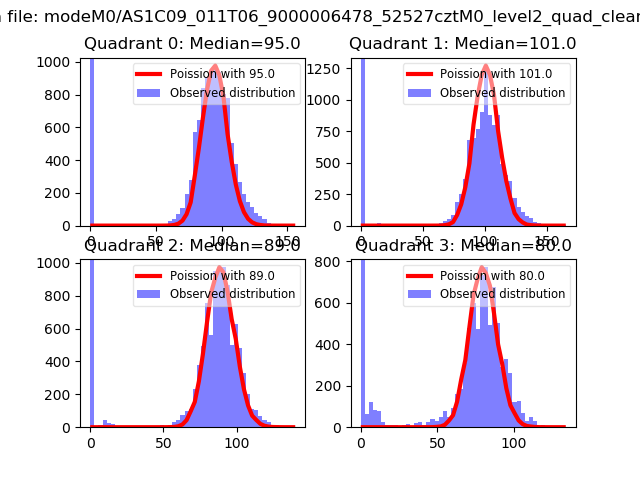 |
 |
| Quadrant-wise count rates Data is divided into 100 sec bins |
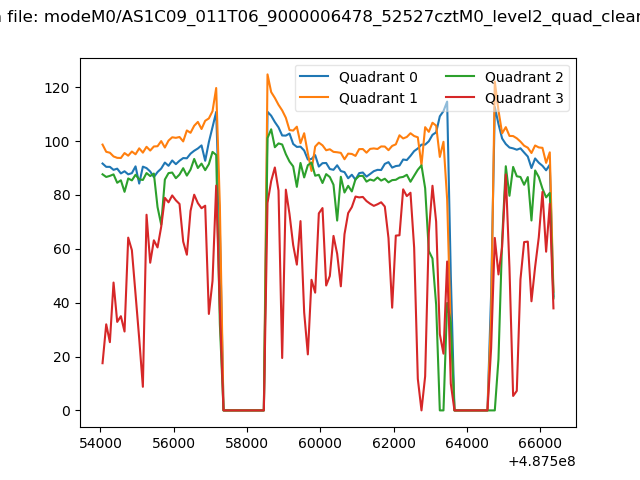 |
|
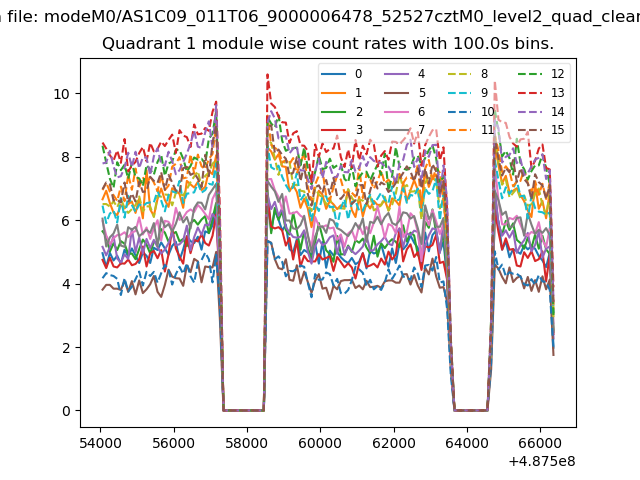
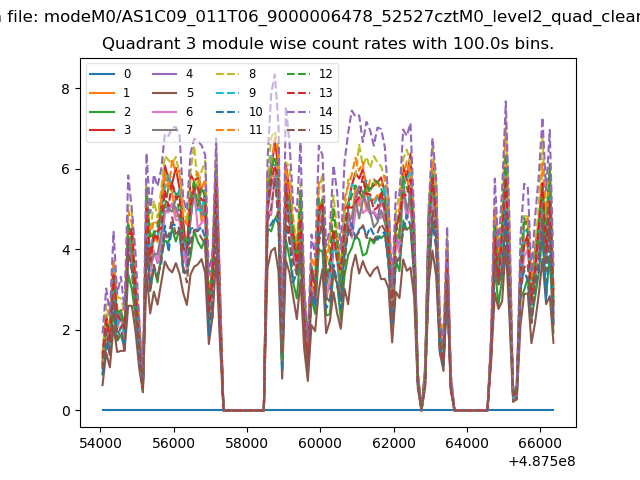
| Module-wise count rates for Quadrant A Data is divided into 100 sec bins |
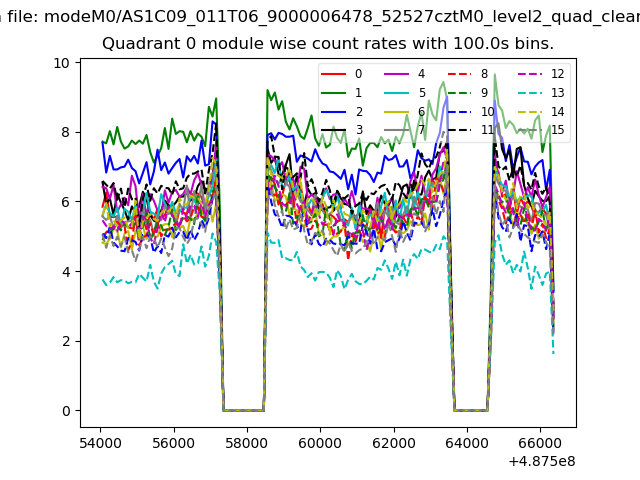 |
 |
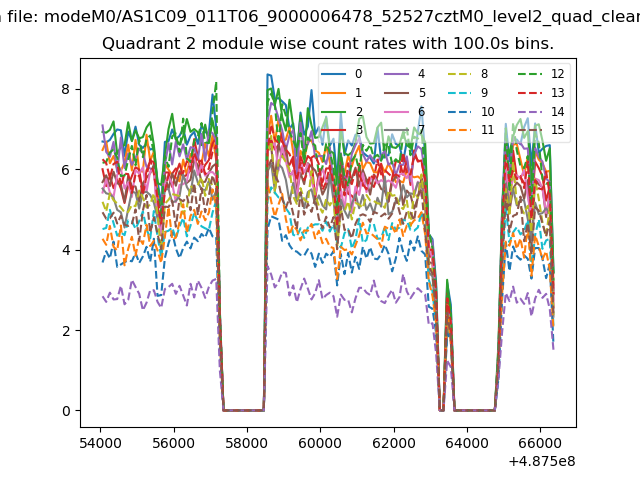
| Module-wise count rates for Quadrant B Data is divided into 100 sec bins |
 |
 |
| Module-wise count rates for Quadrant C Data is divided into 100 sec bins |
 |
 |
| Module-wise count rates for Quadrant D Data is divided into 100 sec bins |
 |
 |
| Parameter | Plot |
|---|---|
| CZT HV Monitor |  |
| D_VDD | 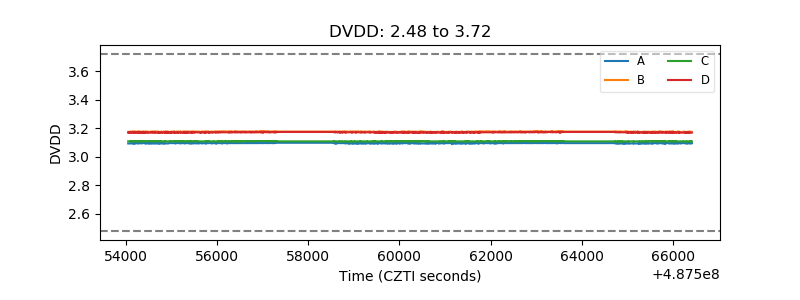 |
| Temperature 1 | 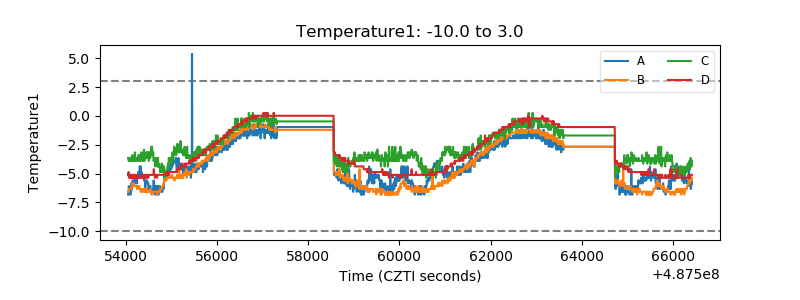 |
| Veto HV Monitor | 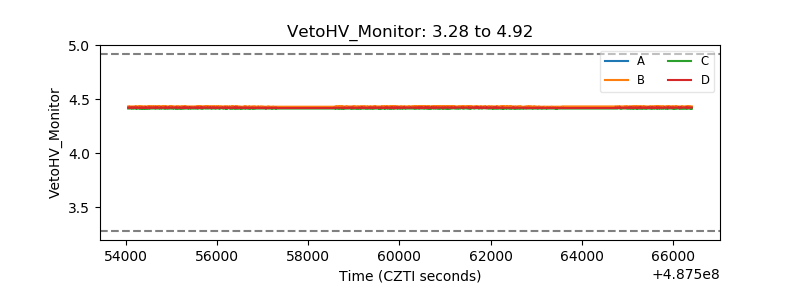 |
| Veto LLD | 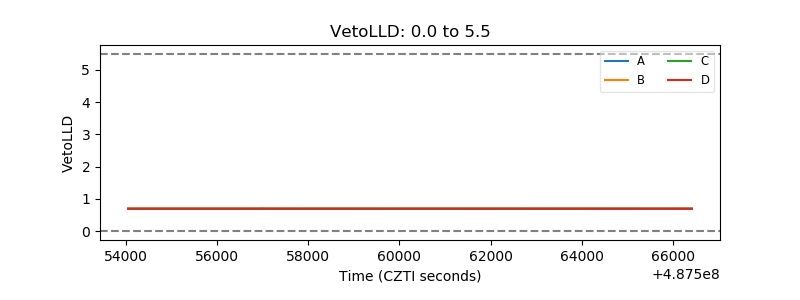 |
| Alpha Counter | 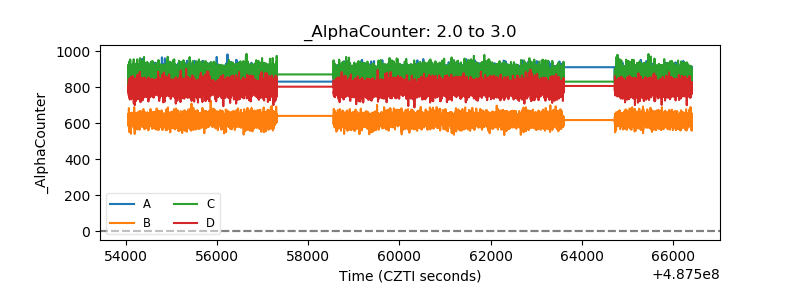 |
| _CPM_Rate | 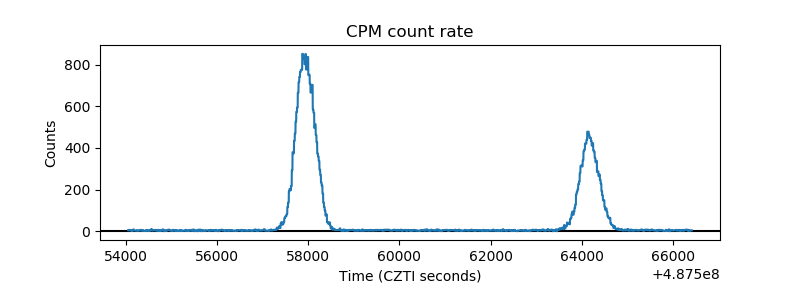 |
| CZT Counter | 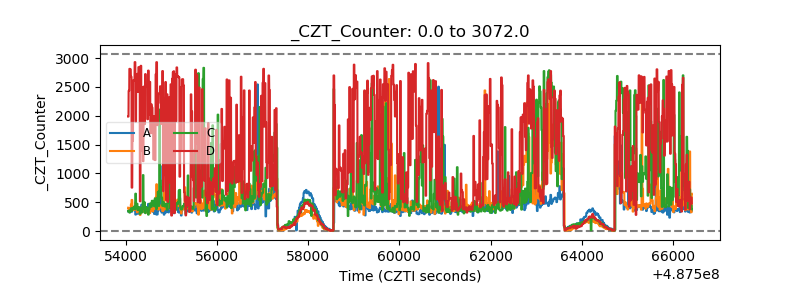 |
| +2.5 Volts monitor |  |
| +5 Volts monitor |  |
| _ROLL_ROT | 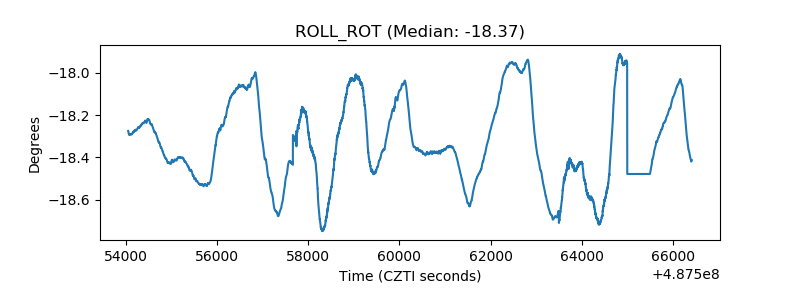 |
| _Roll_DEC | 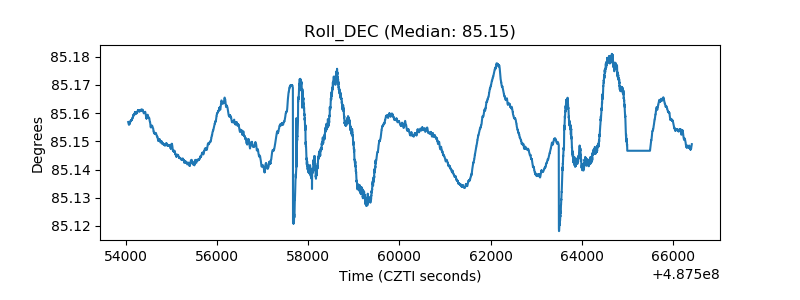 |
| _Roll_RA | 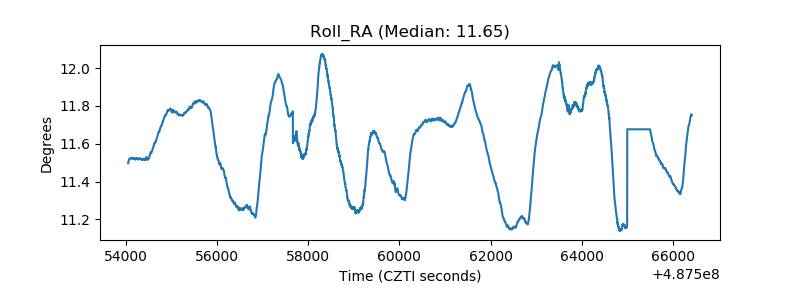 |
| Veto Counter | 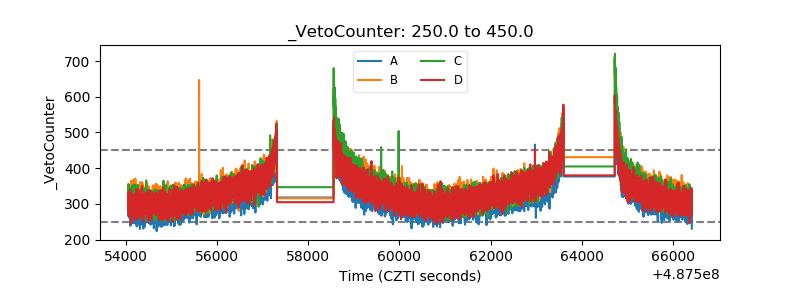 |