| Param | Original file | Final file |
|---|---|---|
| Filename | modeM0/AS1C09_011T06_9000006478_52597cztM0_level2.fits | modeM0/AS1C09_011T06_9000006478_52597cztM0_level2_quad_clean.evt |
| Size (bytes) | 949,962,240 | 64,584,000 |
| Size | 906.0 MB | 61.6 MB |
| Events in quadrant A | 3,273,629 | 582,214 |
| Events in quadrant B | 8,441,596 | 484,933 |
| Events in quadrant C | 12,903,819 | 173,755 |
| Events in quadrant D | 10,080,765 | 294,138 |
| Mode M0 | |||
|---|---|---|---|
| Quadrant | BADHDUFLAG | Total packets | Discarded packets |
| A | 0 | 14155 | 1 |
| B | 0 | 29239 | 1 |
| C | 0 | 42377 | 1 |
| D | 0 | 34097 | 1 |
| Mode M9 | |||
|---|---|---|---|
| Quadrant | BADHDUFLAG | Total packets | Discarded packets |
| A | 0 | 11 | 0 |
| B | 0 | 11 | 0 |
| C | 0 | 11 | 0 |
| D | 0 | 11 | 0 |
| Mode SS | |||
|---|---|---|---|
| Quadrant | BADHDUFLAG | Total packets | Discarded packets |
| A | 0 | 122 | 0 |
| B | 0 | 122 | 0 |
| C | 0 | 122 | 0 |
| D | 0 | 122 | 0 |
| Quadrant | Total seconds | Saturated seconds | Saturation percentage |
|---|---|---|---|
| A | 6015 | 140 | 2.327515% |
| B | 6015 | 1665 | 27.680798% |
| C | 6015 | 4350 | 72.319202% |
| D | 6016 | 2832 | 47.074468% |
Noise dominated data is calculated using 1-second bins in cleaned event files. If a bin has >2000 counts, and if more than 50% of those come from <1% of pixels, then it is considered to be noise-dominated and hence unusable.
| Quadrant | # 1 sec bins | Bins with >0 counts | Bins with >2000 counts | High rate bins dominated by noise | Noise dominated (total time) | Noise dominated (detector-on time) | Marked lightcurve |
|---|---|---|---|---|---|---|---|
| A | 7134 | 6015 | 113 | 113 | 1.58% | 1.88% | 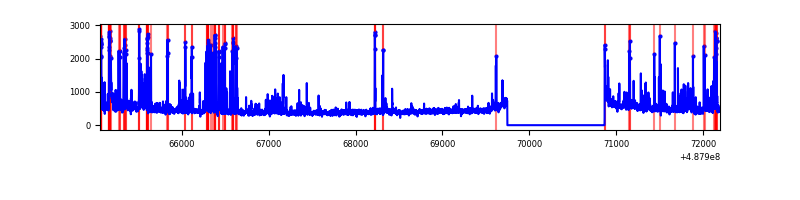 |
| B | 7134 | 6015 | 1653 | 1653 | 23.17% | 27.48% | 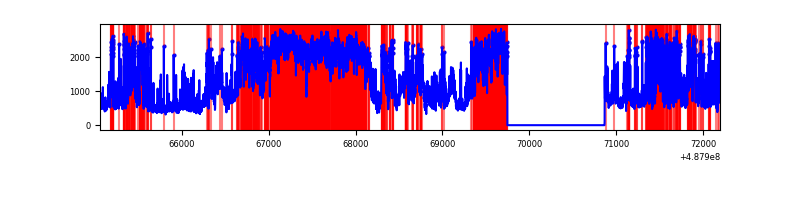 |
| C | 7134 | 6015 | 4146 | 4146 | 58.12% | 68.93% | 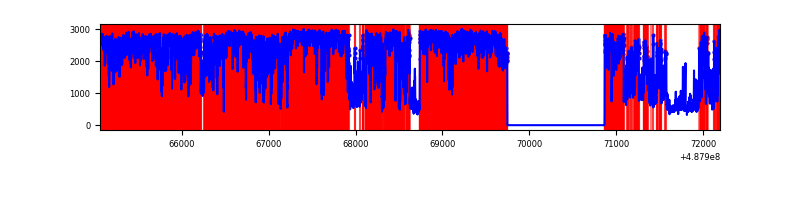 |
| D | 7135 | 6016 | 2856 | 2856 | 40.03% | 47.47% | 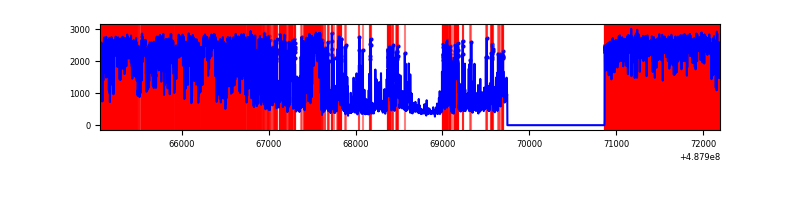 |
Top three noisy pixels from each quadrant. If the there are fewer than three noisy pixels in the level2.evt file, extra rows are filled as -1
| Pixel properties | Quadrant properties | ||||||
|---|---|---|---|---|---|---|---|
| Quadrant | DetID | PixID | Counts | Sigma | Mean | Median | Sigma |
| A | 4 | 249 | 351675 | 2212.98 | 627 | 611 | 158.6 |
| A | 3 | 114 | 77905 | 487.23 | 627 | 611 | 158.6 |
| A | 5 | 243 | 77756 | 486.29 | 627 | 611 | 158.6 |
| B | 10 | 254 | 3432708 | 28119.31 | 575 | 557 | 122.1 |
| B | 10 | 128 | 1020814 | 8358.88 | 575 | 557 | 122.1 |
| B | 10 | 44 | 437607 | 3580.71 | 575 | 557 | 122.1 |
| C | 15 | 248 | 10626292 | 121398.57 | 314 | 312 | 87.5 |
| C | 15 | 233 | 848983 | 9695.81 | 314 | 312 | 87.5 |
| C | 12 | 254 | 80726 | 918.71 | 314 | 312 | 87.5 |
| D | 15 | 125 | 2070453 | 15752.69 | 459 | 439 | 131.4 |
| D | 8 | 176 | 1937824 | 14743.39 | 459 | 439 | 131.4 |
| D | 12 | 1 | 1756942 | 13366.89 | 459 | 439 | 131.4 |
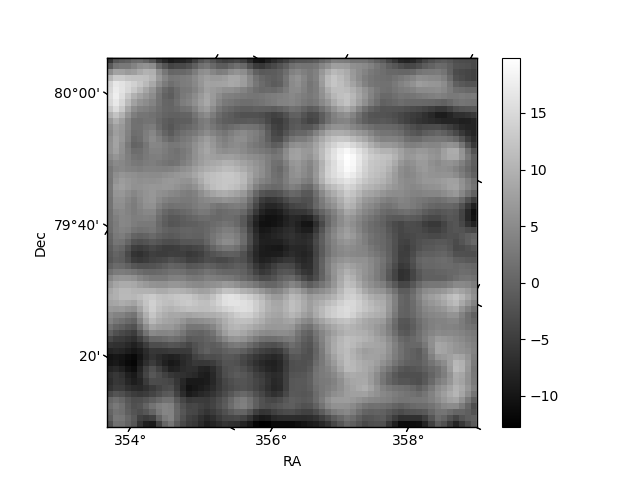
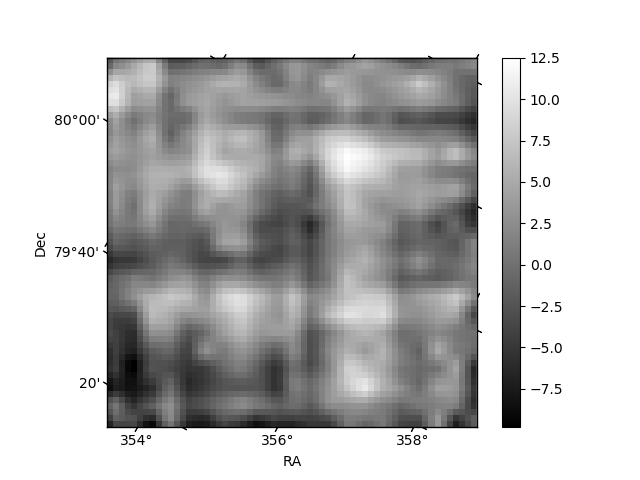
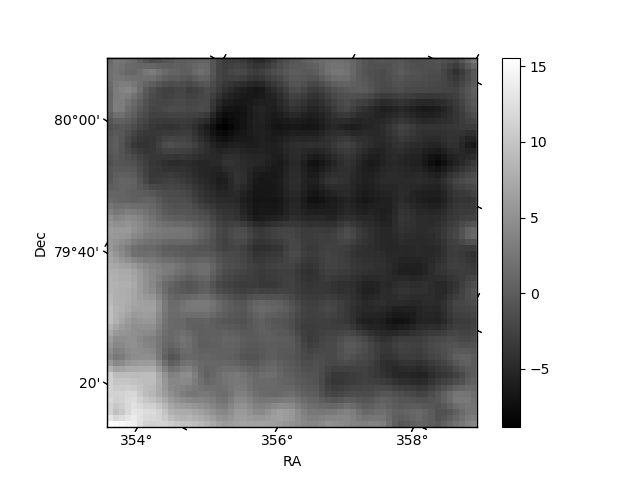
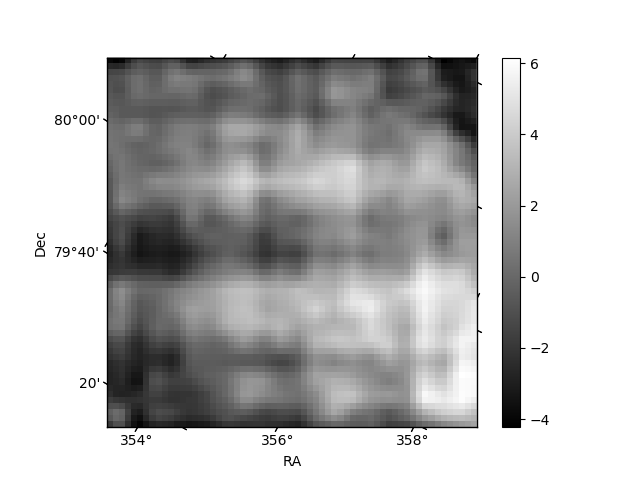
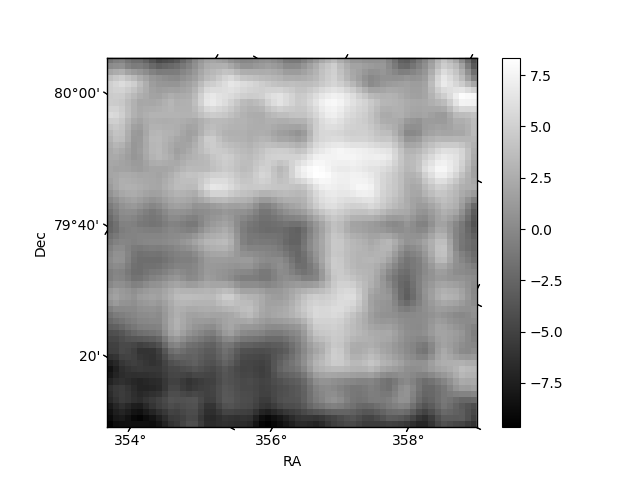
Histogram calculated using DETX and DETY for each event in the final _common_clean file
| Quadrant A | 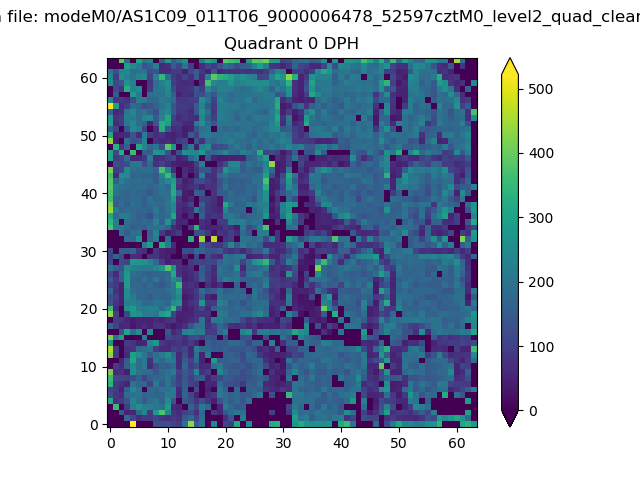 |
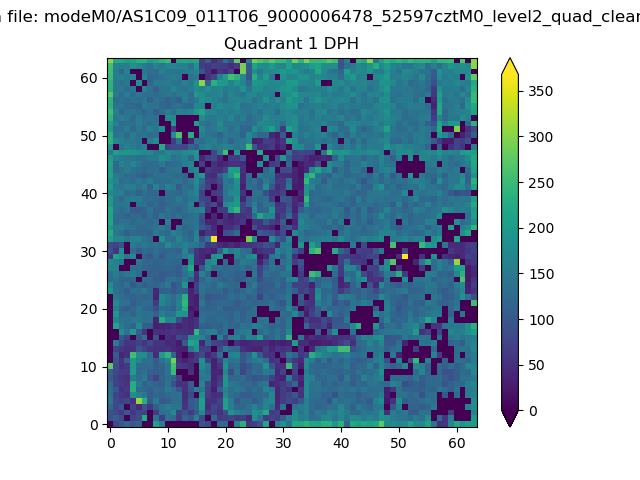 |
Quadrant B |
|---|---|---|---|
| Quadrant D | 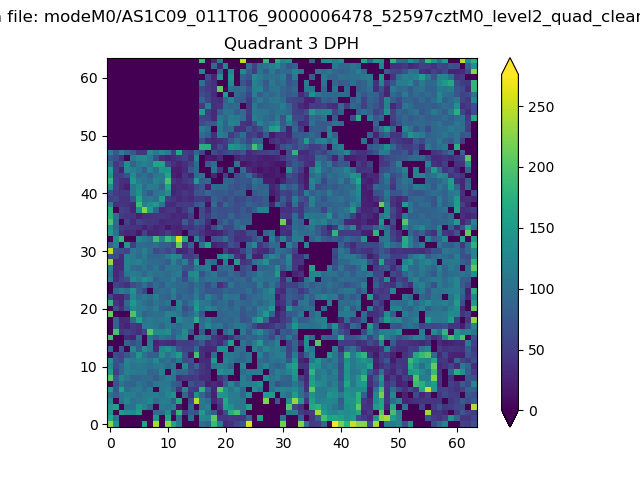 |
 |
Quadrant C |
| Plot type | Count rate plots | Images |
|---|---|---|
| Comparison with Poisson distribution Blue bars denote a histogram of data divided into 1 sec bins. Red curve is a Poisson curve with rate = median count rate of data. |
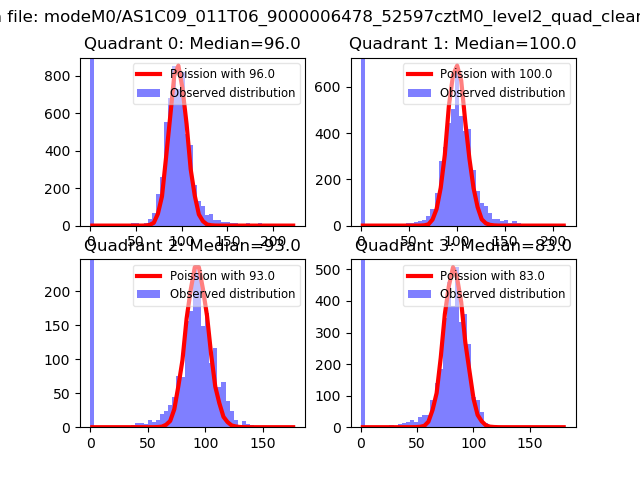 |
 |
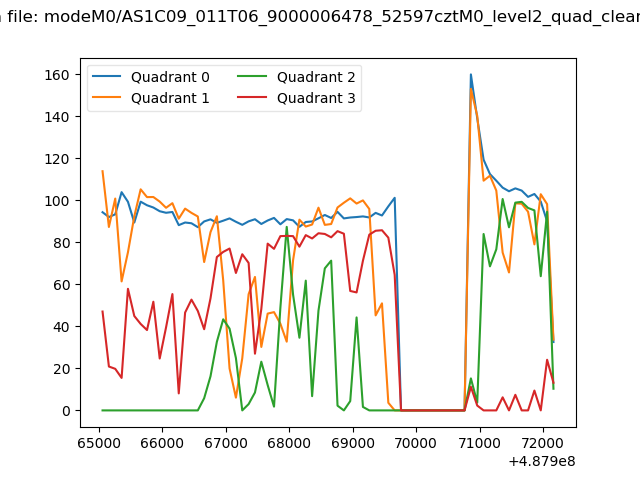
| Quadrant-wise count rates Data is divided into 100 sec bins |
 |
|
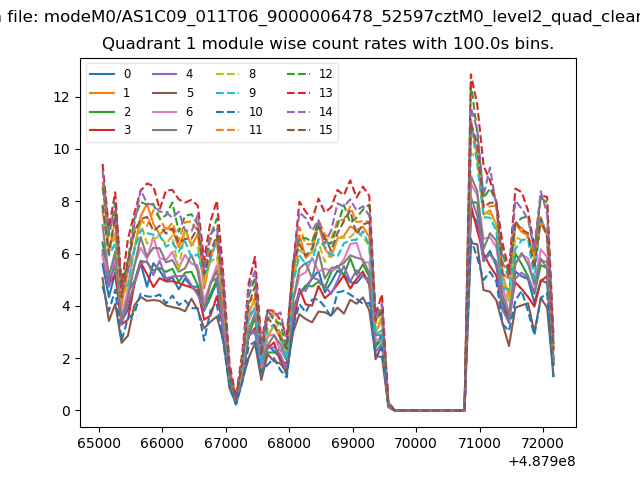
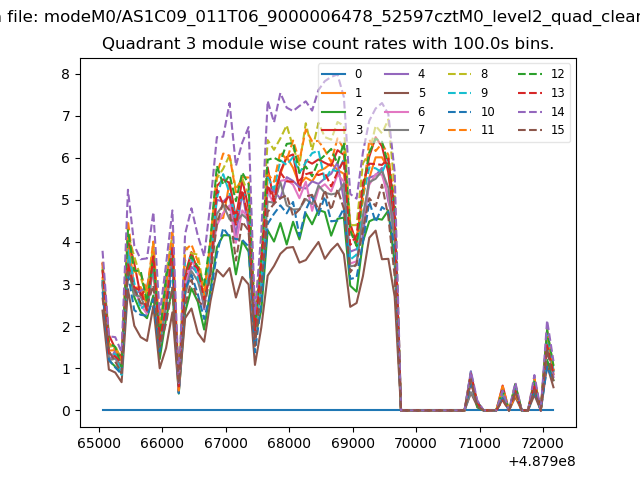
| Module-wise count rates for Quadrant A Data is divided into 100 sec bins |
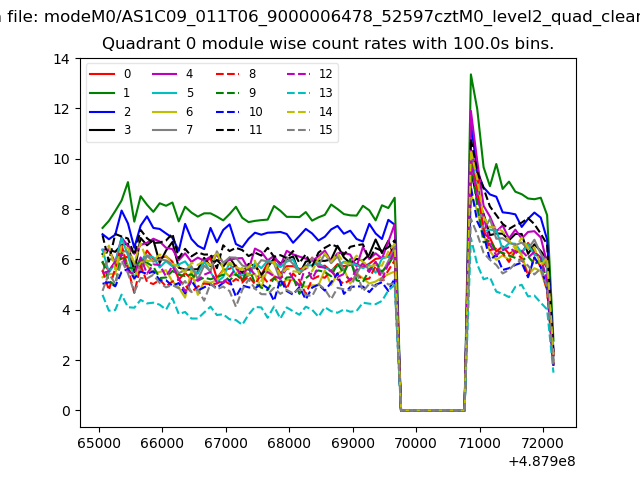 |
 |
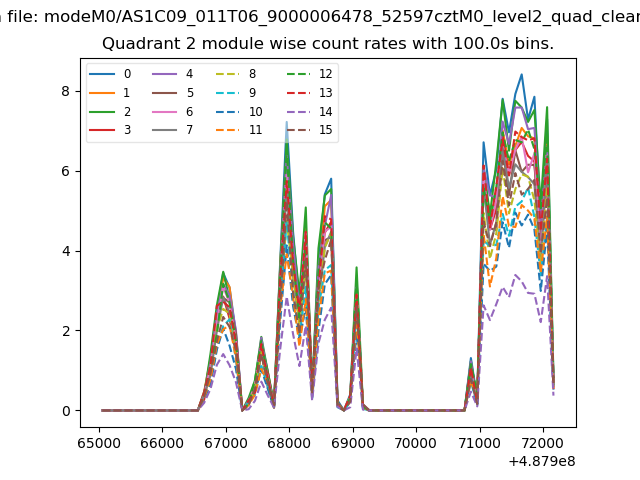
| Module-wise count rates for Quadrant B Data is divided into 100 sec bins |
 |
 |
| Module-wise count rates for Quadrant C Data is divided into 100 sec bins |
 |
 |
| Module-wise count rates for Quadrant D Data is divided into 100 sec bins |
 |
 |
| Parameter | Plot |
|---|---|
| CZT HV Monitor | 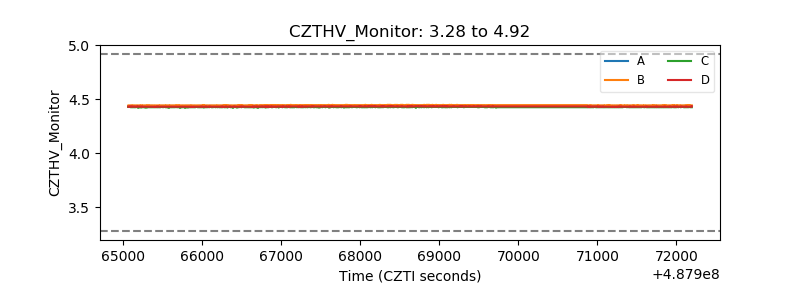 |
| D_VDD | 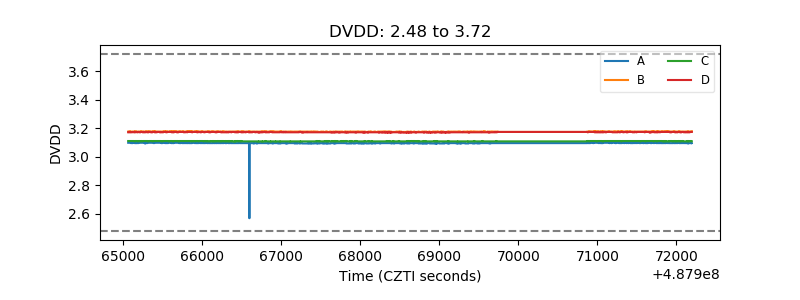 |
| Temperature 1 | 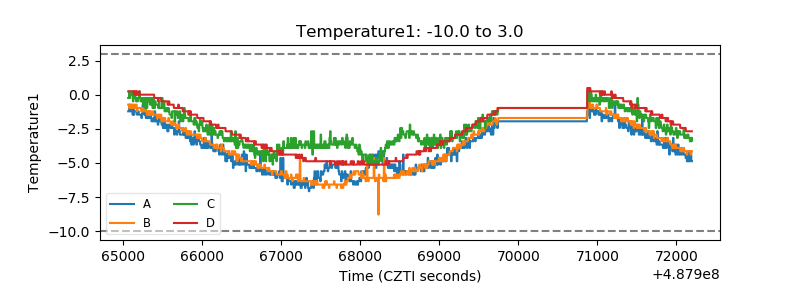 |
| Veto HV Monitor | 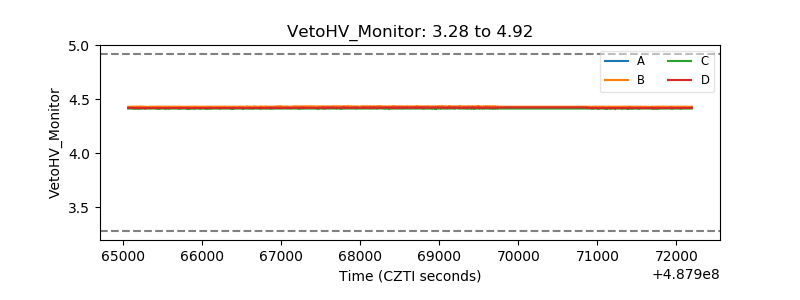 |
| Veto LLD | 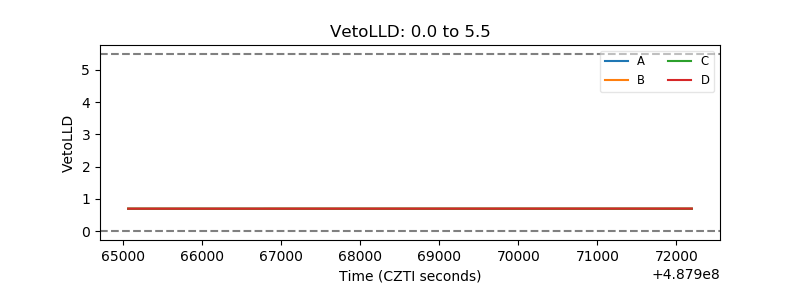 |
| Alpha Counter | 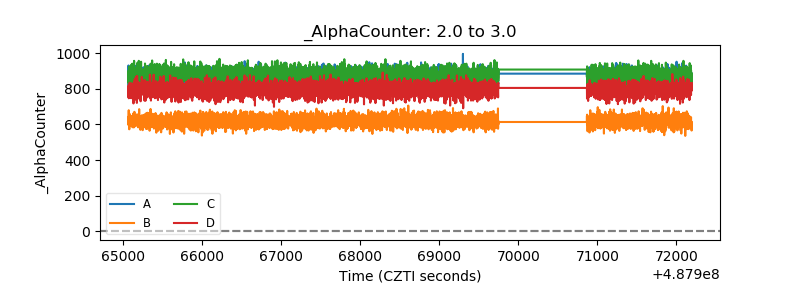 |
| _CPM_Rate | 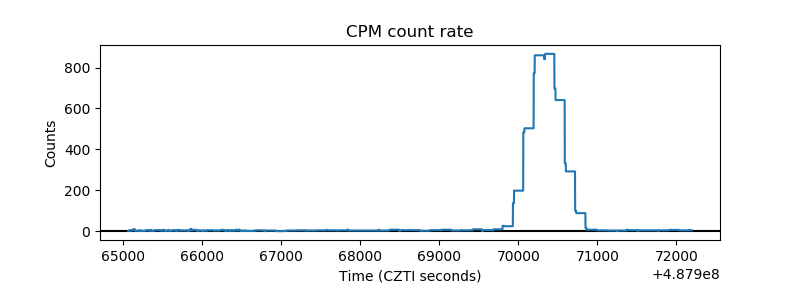 |
| CZT Counter | 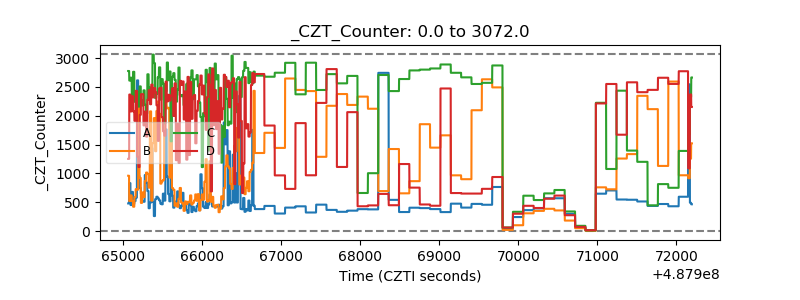 |
| +2.5 Volts monitor |  |
| +5 Volts monitor |  |
| _ROLL_ROT | 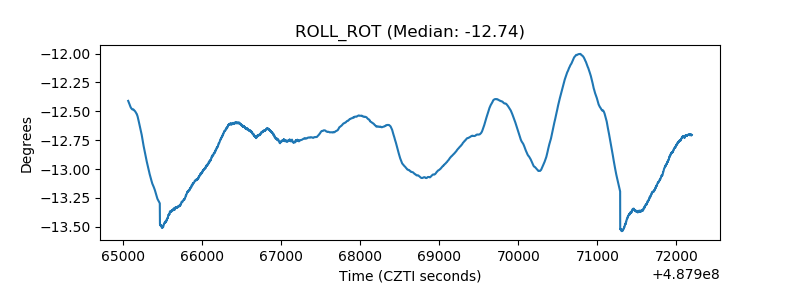 |
| _Roll_DEC | 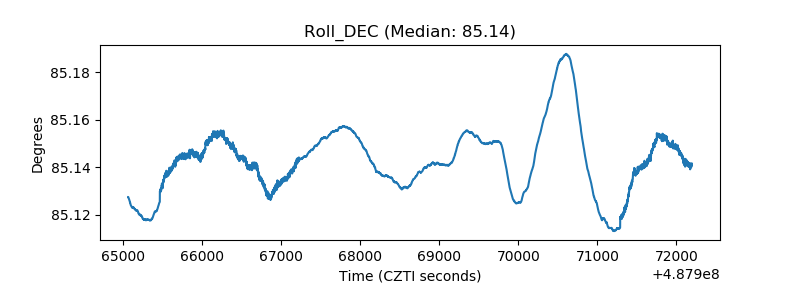 |
| _Roll_RA | 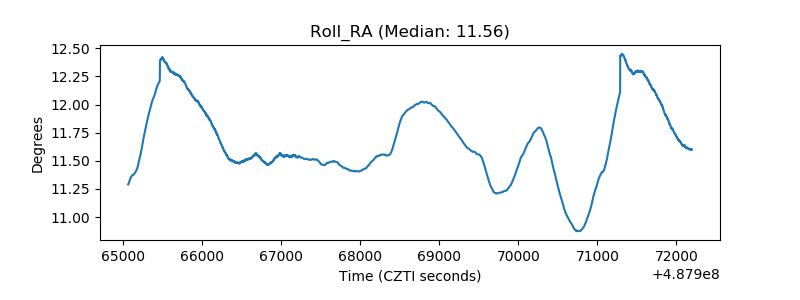 |
| Veto Counter | 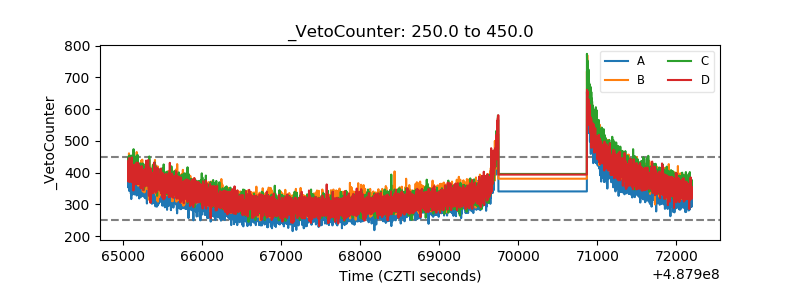 |