| Param | Original file | Final file |
|---|---|---|
| Filename | modeM0/AS1C09_011T06_9000006478_52613cztM0_level2.fits | modeM0/AS1C09_011T06_9000006478_52613cztM0_level2_quad_clean.evt |
| Size (bytes) | 950,120,640 | 65,603,520 |
| Size | 906.1 MB | 62.6 MB |
| Events in quadrant A | 3,037,909 | 593,065 |
| Events in quadrant B | 12,203,157 | 280,838 |
| Events in quadrant C | 11,583,572 | 245,138 |
| Events in quadrant D | 7,879,771 | 444,836 |
| Mode M0 | |||
|---|---|---|---|
| Quadrant | BADHDUFLAG | Total packets | Discarded packets |
| A | 0 | 13268 | 1 |
| B | 0 | 40376 | 2 |
| C | 0 | 38561 | 1 |
| D | 0 | 27633 | 1 |
| Mode M9 | |||
|---|---|---|---|
| Quadrant | BADHDUFLAG | Total packets | Discarded packets |
| A | 0 | 12 | 0 |
| B | 0 | 12 | 0 |
| C | 0 | 12 | 0 |
| D | 0 | 12 | 0 |
| Mode SS | |||
|---|---|---|---|
| Quadrant | BADHDUFLAG | Total packets | Discarded packets |
| A | 0 | 124 | 0 |
| B | 0 | 124 | 0 |
| C | 0 | 124 | 0 |
| D | 0 | 124 | 0 |
| Quadrant | Total seconds | Saturated seconds | Saturation percentage |
|---|---|---|---|
| A | 6041 | 46 | 0.761463% |
| B | 6040 | 3812 | 63.112583% |
| C | 6041 | 3524 | 58.334713% |
| D | 6041 | 1212 | 20.062903% |
Noise dominated data is calculated using 1-second bins in cleaned event files. If a bin has >2000 counts, and if more than 50% of those come from <1% of pixels, then it is considered to be noise-dominated and hence unusable.
| Quadrant | # 1 sec bins | Bins with >0 counts | Bins with >2000 counts | High rate bins dominated by noise | Noise dominated (total time) | Noise dominated (detector-on time) | Marked lightcurve |
|---|---|---|---|---|---|---|---|
| A | 7251 | 6042 | 28 | 28 | 0.39% | 0.46% | 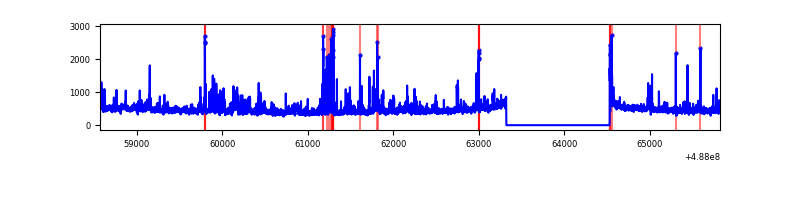 |
| B | 7250 | 6041 | 3270 | 3270 | 45.10% | 54.13% | 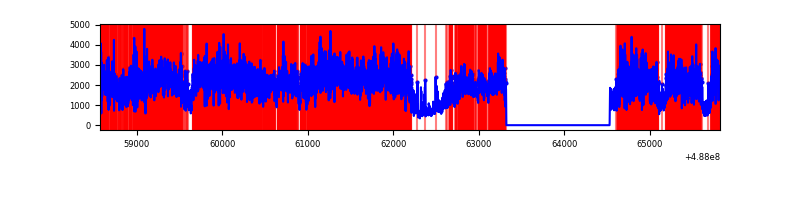 |
| C | 7250 | 6040 | 3175 | 3175 | 43.79% | 52.57% | 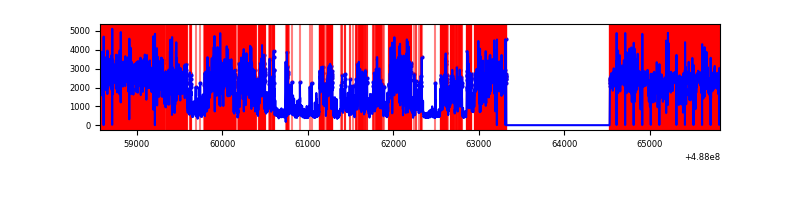 |
| D | 7251 | 6042 | 1233 | 1233 | 17.00% | 20.41% | 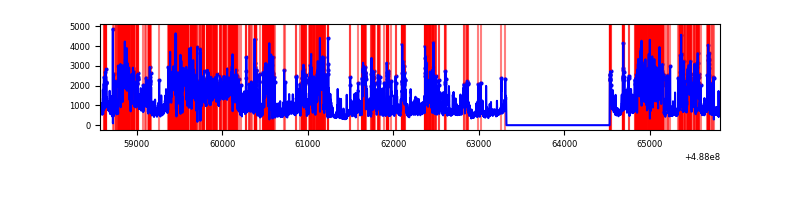 |
Top three noisy pixels from each quadrant. If the there are fewer than three noisy pixels in the level2.evt file, extra rows are filled as -1
| Pixel properties | Quadrant properties | ||||||
|---|---|---|---|---|---|---|---|
| Quadrant | DetID | PixID | Counts | Sigma | Mean | Median | Sigma |
| A | 4 | 249 | 126211 | 791.85 | 629 | 614 | 158.6 |
| A | 7 | 243 | 118874 | 745.59 | 629 | 614 | 158.6 |
| A | 3 | 14 | 67017 | 418.65 | 629 | 614 | 158.6 |
| B | 10 | 128 | 7568810 | 73745.11 | 484 | 467 | 102.6 |
| B | 10 | 254 | 1933535 | 18835.61 | 484 | 467 | 102.6 |
| B | 8 | 234 | 171541 | 1666.93 | 484 | 467 | 102.6 |
| C | 15 | 248 | 9781262 | 99530.84 | 350 | 348 | 98.3 |
| C | 13 | 3 | 214603 | 2180.26 | 350 | 348 | 98.3 |
| C | 2 | 12 | 57830 | 584.94 | 350 | 348 | 98.3 |
| D | 2 | 62 | 1823868 | 10986.35 | 570 | 543 | 166.0 |
| D | 12 | 2 | 787718 | 4743.08 | 570 | 543 | 166.0 |
| D | 11 | 176 | 628297 | 3782.5 | 570 | 543 | 166.0 |
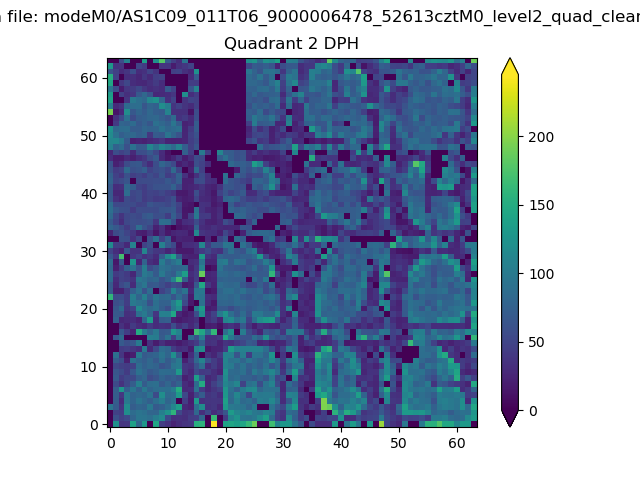
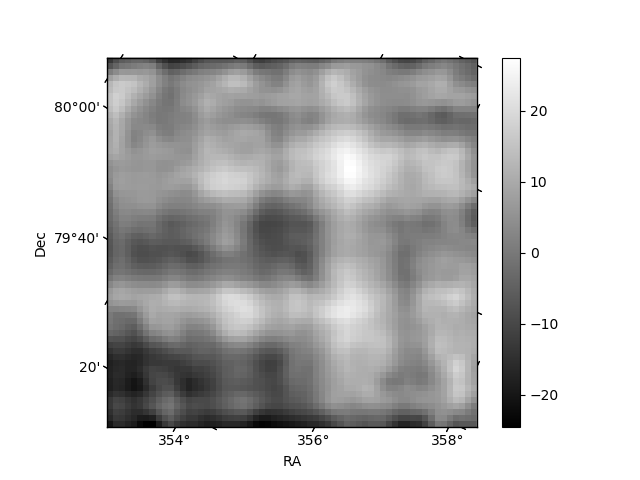
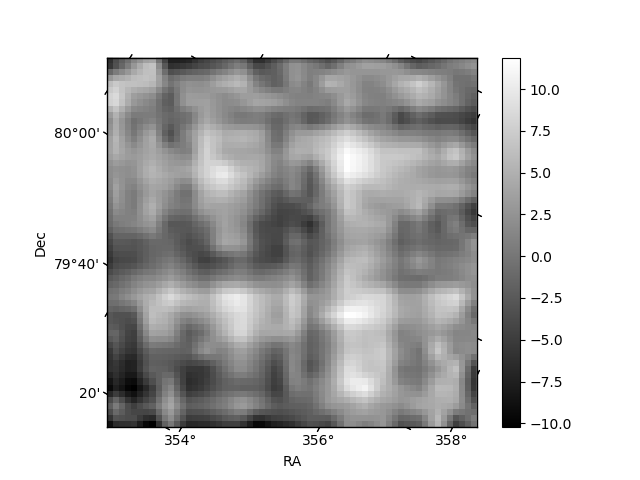
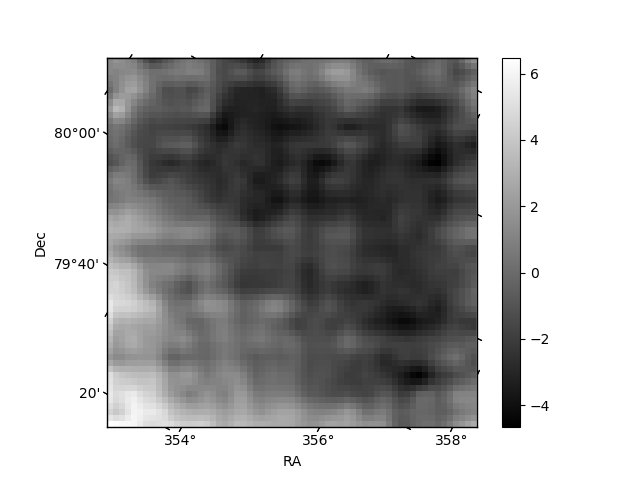
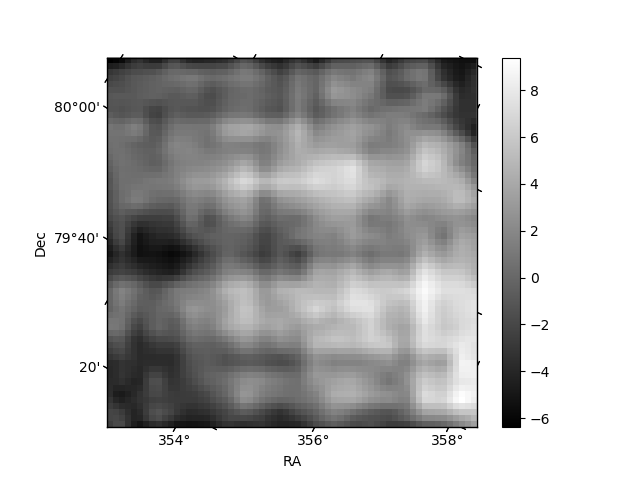
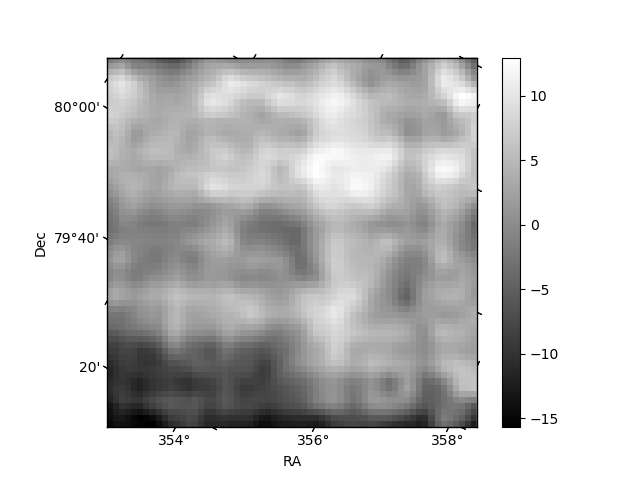
Histogram calculated using DETX and DETY for each event in the final _common_clean file
| Quadrant A | 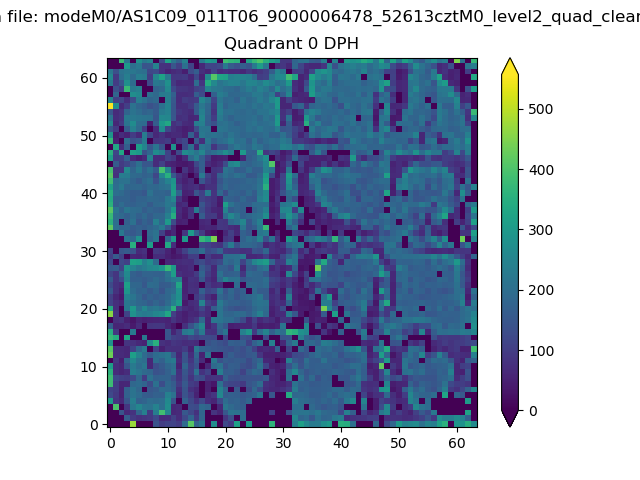 |
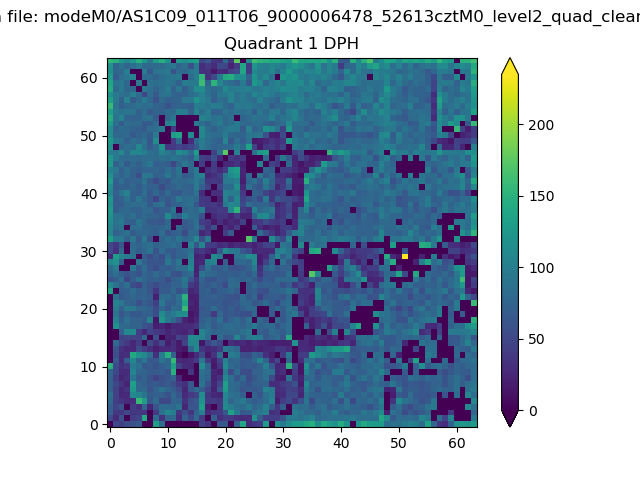 |
Quadrant B |
|---|---|---|---|
| Quadrant D | 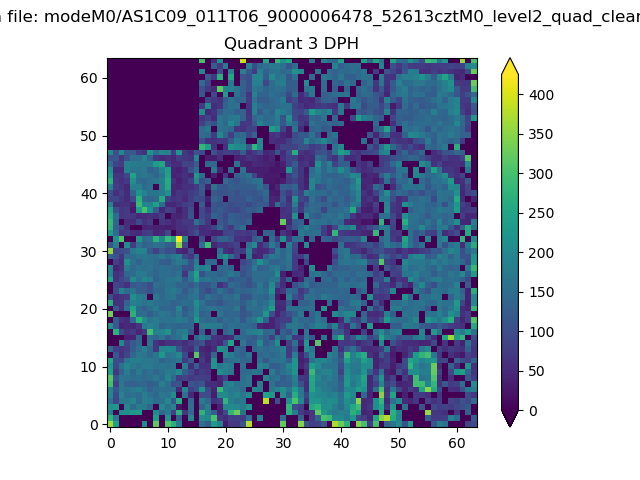 |
 |
Quadrant C |
| Plot type | Count rate plots | Images |
|---|---|---|
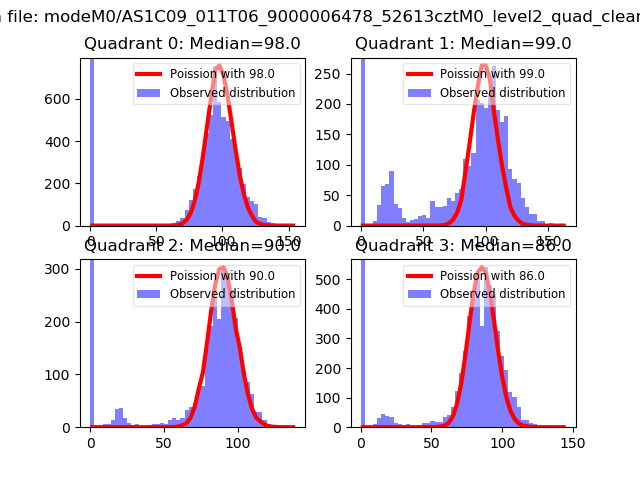
| Comparison with Poisson distribution Blue bars denote a histogram of data divided into 1 sec bins. Red curve is a Poisson curve with rate = median count rate of data. |
 |
 |
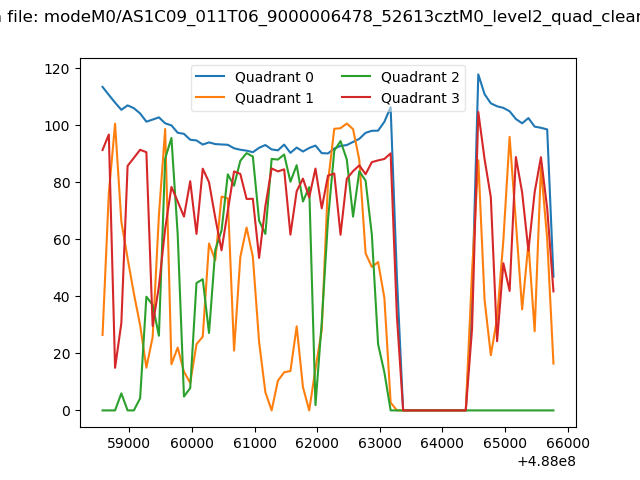
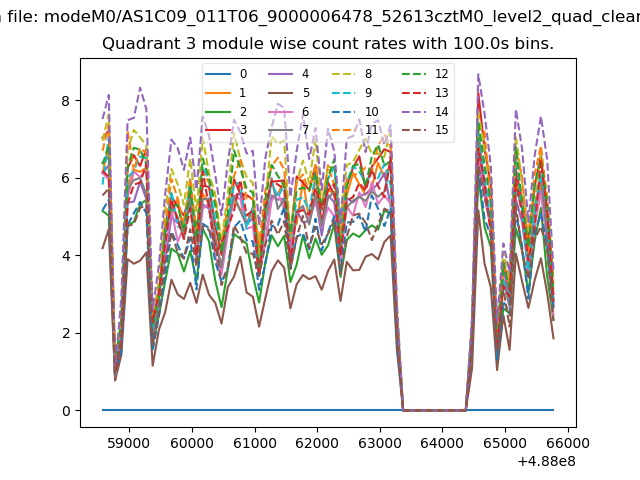
| Quadrant-wise count rates Data is divided into 100 sec bins |
 |
|
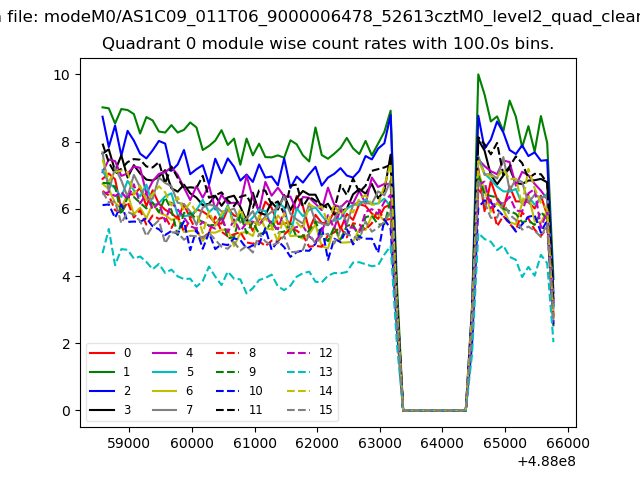
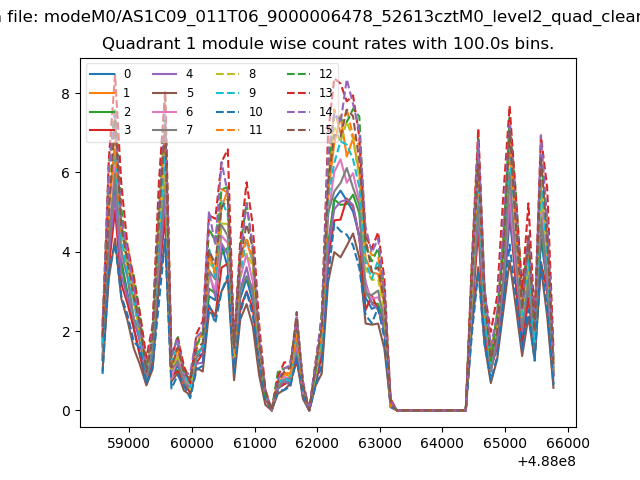
| Module-wise count rates for Quadrant A Data is divided into 100 sec bins |
 |
 |
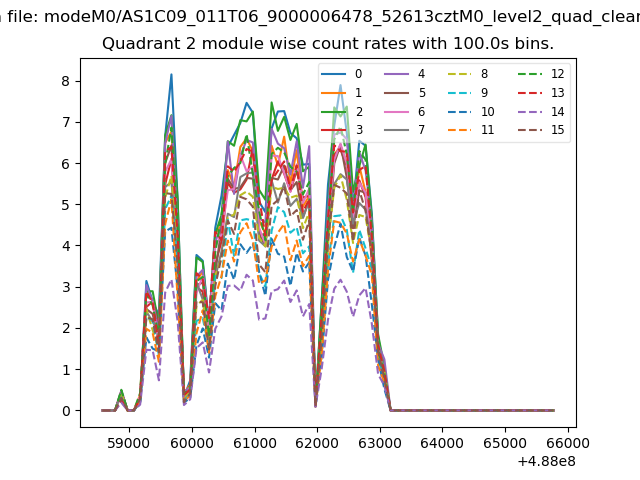
| Module-wise count rates for Quadrant B Data is divided into 100 sec bins |
 |
 |
| Module-wise count rates for Quadrant C Data is divided into 100 sec bins |
 |
 |
| Module-wise count rates for Quadrant D Data is divided into 100 sec bins |
 |
 |
| Parameter | Plot |
|---|---|
| CZT HV Monitor | 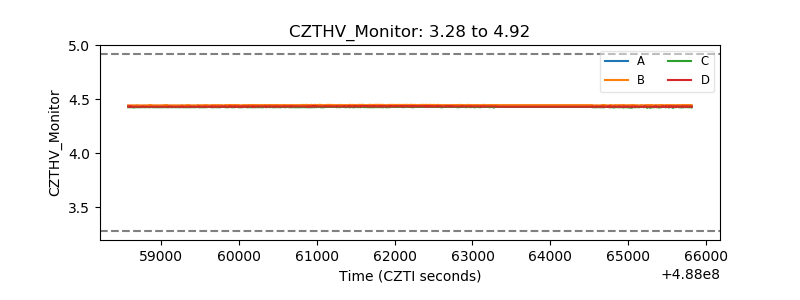 |
| D_VDD | 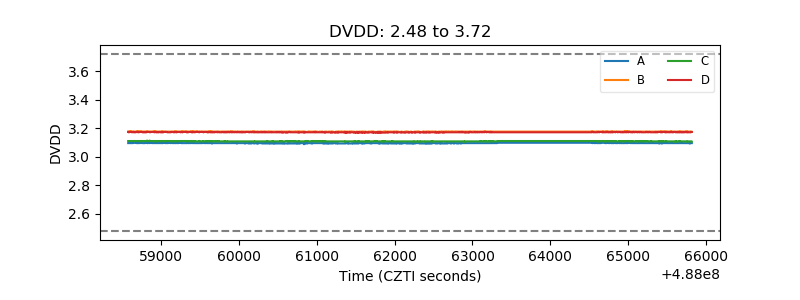 |
| Temperature 1 | 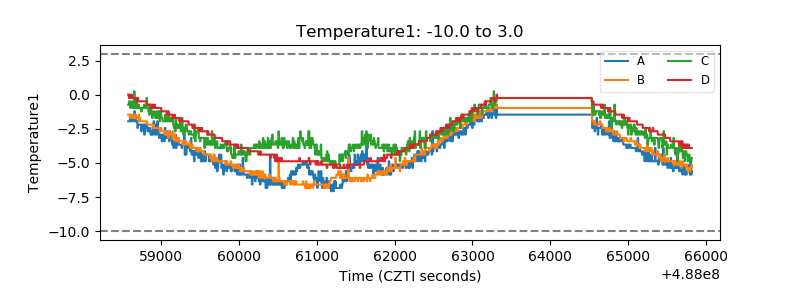 |
| Veto HV Monitor | 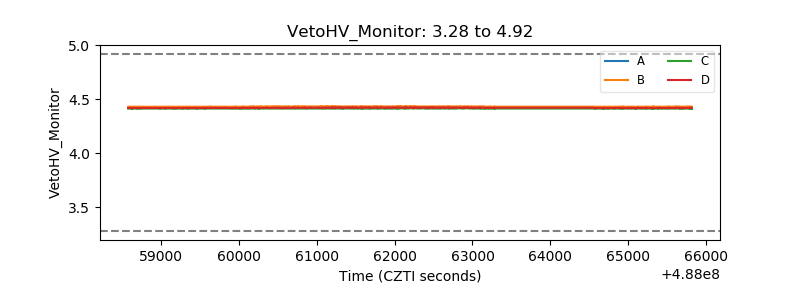 |
| Veto LLD | 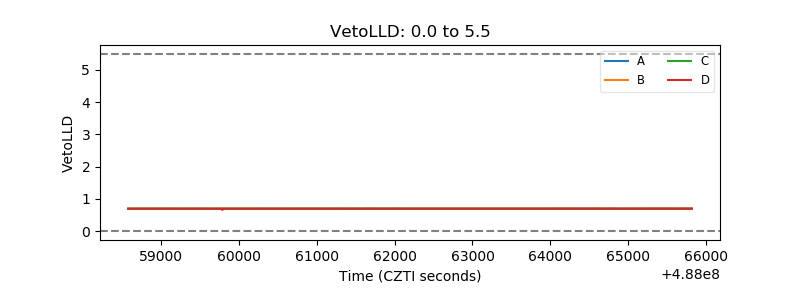 |
| Alpha Counter | 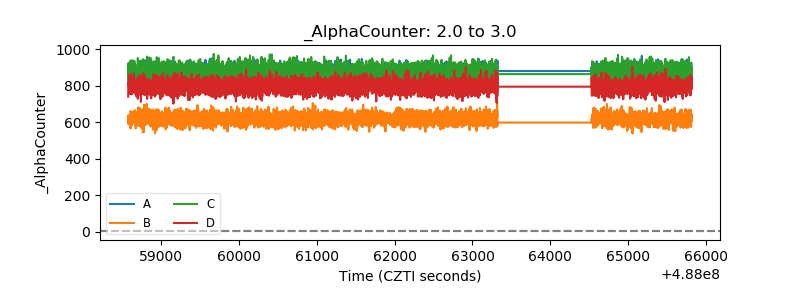 |
| _CPM_Rate | 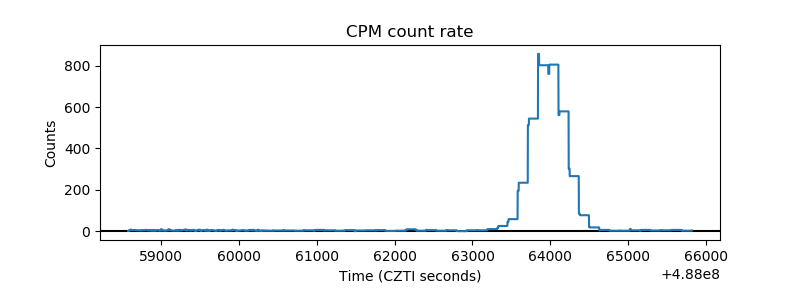 |
| CZT Counter | 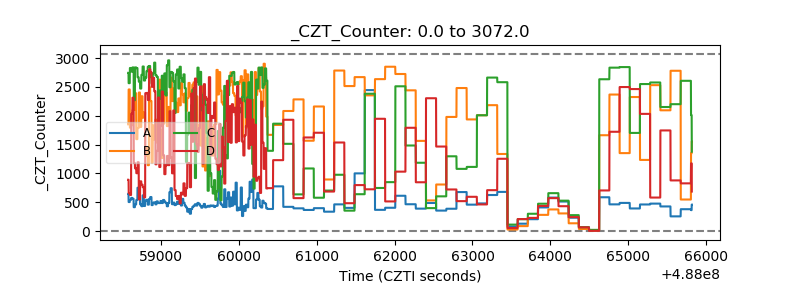 |
| +2.5 Volts monitor |  |
| +5 Volts monitor |  |
| _ROLL_ROT | 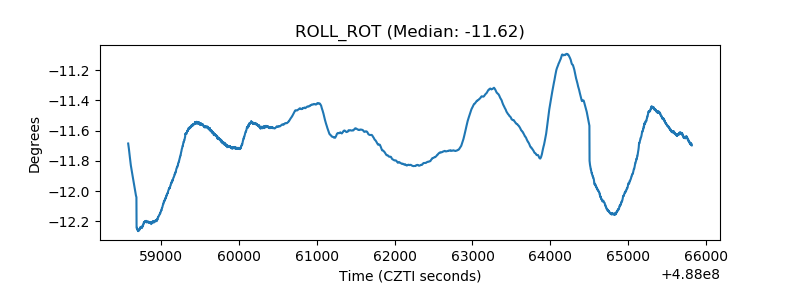 |
| _Roll_DEC | 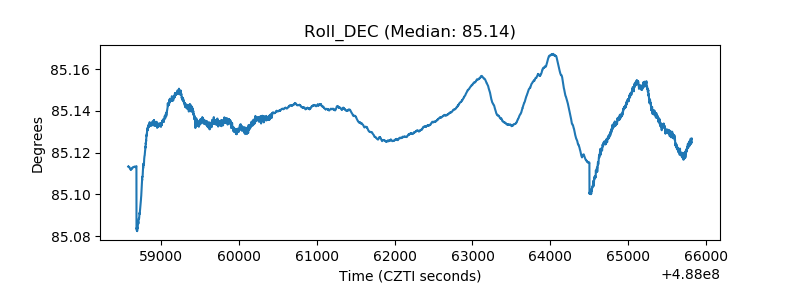 |
| _Roll_RA | 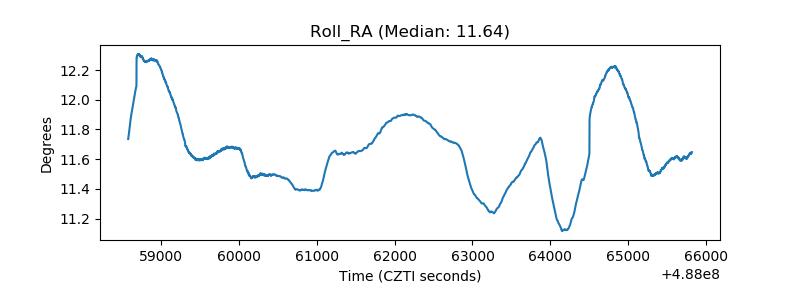 |
| Veto Counter | 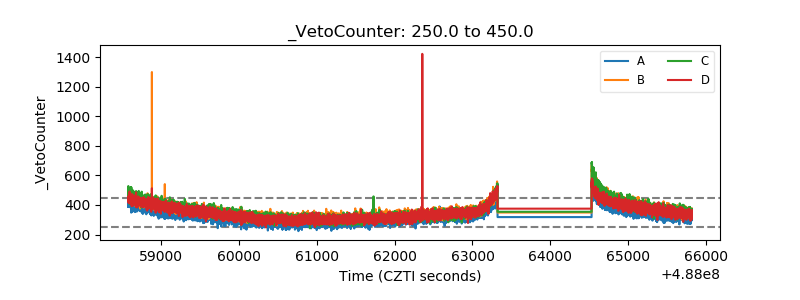 |