| Param | Original file | Final file |
|---|---|---|
| Filename | modeM0/AS1C09_011T06_9000006478_52616cztM0_level2.fits | modeM0/AS1C09_011T06_9000006478_52616cztM0_level2_quad_clean.evt |
| Size (bytes) | 987,906,240 | 66,692,160 |
| Size | 942.1 MB | 63.6 MB |
| Events in quadrant A | 3,129,023 | 580,435 |
| Events in quadrant B | 8,548,905 | 541,555 |
| Events in quadrant C | 14,492,823 | 101,513 |
| Events in quadrant D | 9,910,980 | 354,798 |
| Mode M0 | |||
|---|---|---|---|
| Quadrant | BADHDUFLAG | Total packets | Discarded packets |
| A | 0 | 14281 | 1 |
| B | 0 | 29820 | 1 |
| C | 0 | 47295 | 1 |
| D | 0 | 33833 | 1 |
| Mode M9 | |||
|---|---|---|---|
| Quadrant | BADHDUFLAG | Total packets | Discarded packets |
| A | 0 | 8 | 0 |
| B | 0 | 8 | 0 |
| C | 0 | 8 | 0 |
| D | 0 | 8 | 0 |
| Mode SS | |||
|---|---|---|---|
| Quadrant | BADHDUFLAG | Total packets | Discarded packets |
| A | 0 | 128 | 0 |
| B | 0 | 128 | 0 |
| C | 0 | 128 | 0 |
| D | 0 | 128 | 0 |
| Quadrant | Total seconds | Saturated seconds | Saturation percentage |
|---|---|---|---|
| A | 6313 | 103 | 1.631554% |
| B | 6313 | 1250 | 19.800412% |
| C | 6313 | 5287 | 83.747822% |
| D | 6314 | 2306 | 36.522015% |
Noise dominated data is calculated using 1-second bins in cleaned event files. If a bin has >2000 counts, and if more than 50% of those come from <1% of pixels, then it is considered to be noise-dominated and hence unusable.
| Quadrant | # 1 sec bins | Bins with >0 counts | Bins with >2000 counts | High rate bins dominated by noise | Noise dominated (total time) | Noise dominated (detector-on time) | Marked lightcurve |
|---|---|---|---|---|---|---|---|
| A | 7073 | 6314 | 48 | 48 | 0.68% | 0.76% | 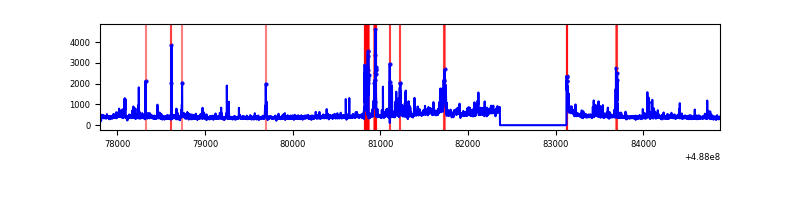 |
| B | 7073 | 6314 | 1080 | 1080 | 15.27% | 17.10% | 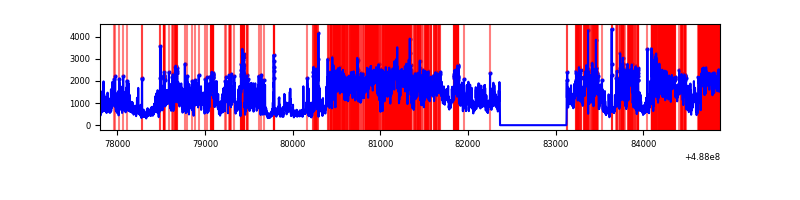 |
| C | 7072 | 6313 | 4487 | 4487 | 63.45% | 71.08% | 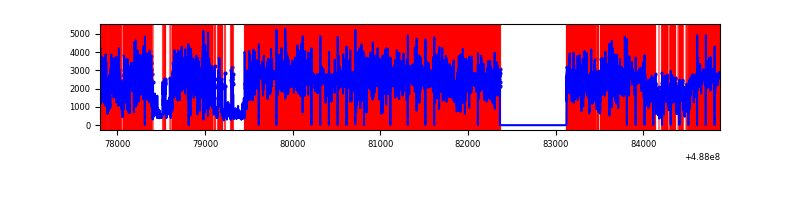 |
| D | 7074 | 6314 | 2026 | 2026 | 28.64% | 32.09% | 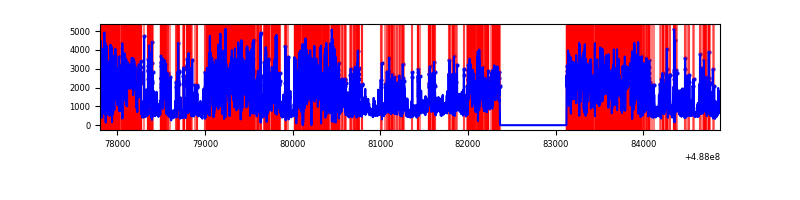 |
Top three noisy pixels from each quadrant. If the there are fewer than three noisy pixels in the level2.evt file, extra rows are filled as -1
| Pixel properties | Quadrant properties | ||||||
|---|---|---|---|---|---|---|---|
| Quadrant | DetID | PixID | Counts | Sigma | Mean | Median | Sigma |
| A | 4 | 249 | 234945 | 1481.47 | 625 | 608 | 158.2 |
| A | 14 | 254 | 122414 | 770.05 | 625 | 608 | 158.2 |
| A | 3 | 14 | 111431 | 700.62 | 625 | 608 | 158.2 |
| B | 10 | 254 | 3800682 | 29721.35 | 601 | 581 | 127.9 |
| B | 10 | 128 | 1368885 | 10701.78 | 601 | 581 | 127.9 |
| B | 8 | 234 | 266671 | 2081.14 | 601 | 581 | 127.9 |
| C | 15 | 248 | 13146109 | 185688.21 | 251 | 249 | 70.8 |
| C | 13 | 3 | 88854 | 1251.57 | 251 | 249 | 70.8 |
| C | 1 | 44 | 66001 | 928.76 | 251 | 249 | 70.8 |
| D | 8 | 176 | 5141212 | 34072.85 | 507 | 481 | 150.9 |
| D | 2 | 62 | 1264283 | 8376.5 | 507 | 481 | 150.9 |
| D | 6 | 42 | 328849 | 2176.43 | 507 | 481 | 150.9 |
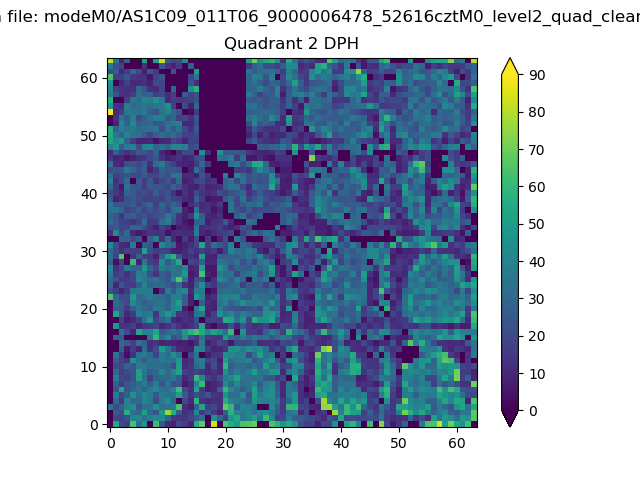
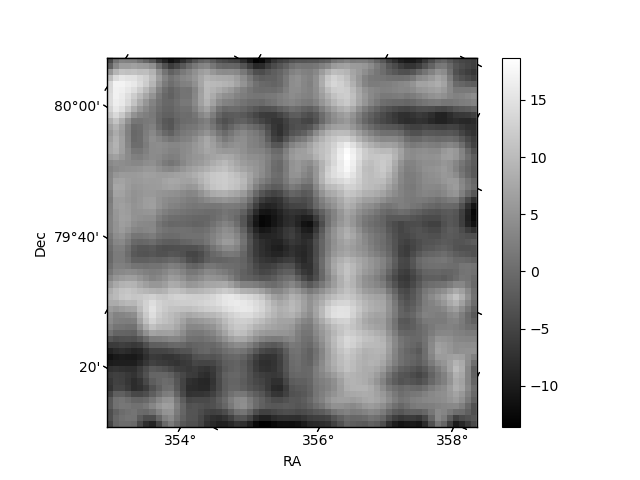
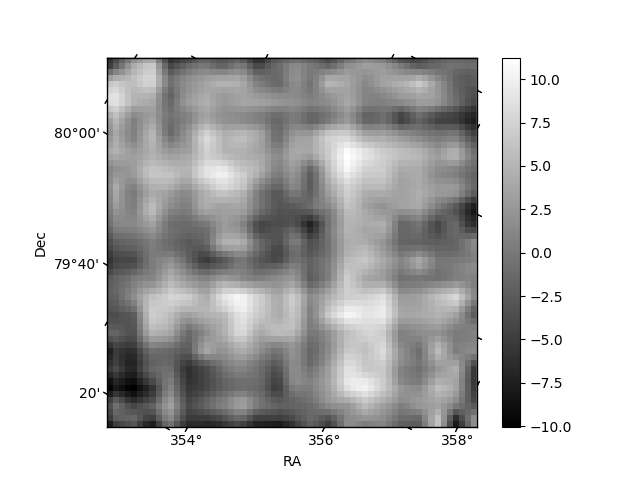
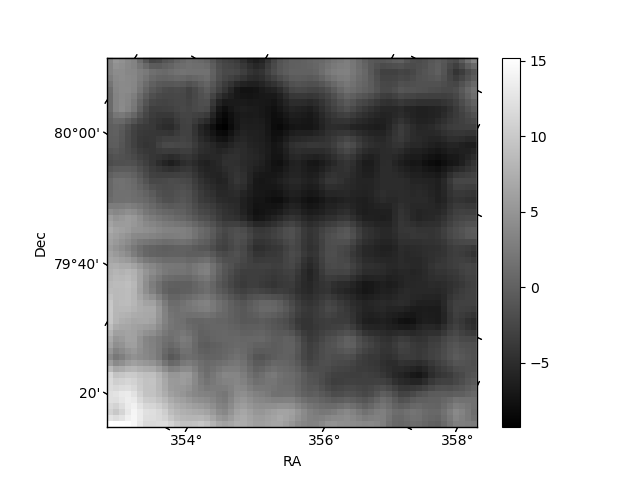
Histogram calculated using DETX and DETY for each event in the final _common_clean file
| Quadrant A | 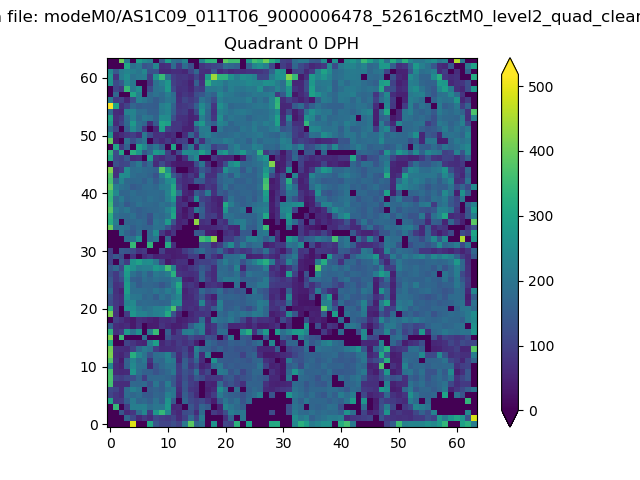 |
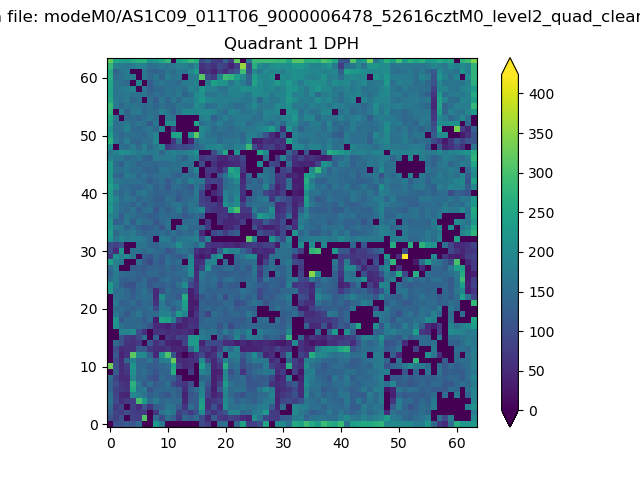 |
Quadrant B |
|---|---|---|---|
| Quadrant D | 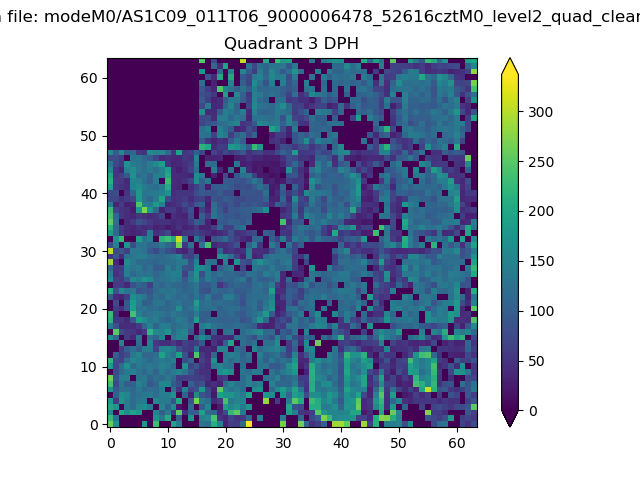 |
 |
Quadrant C |
| Plot type | Count rate plots | Images |
|---|---|---|
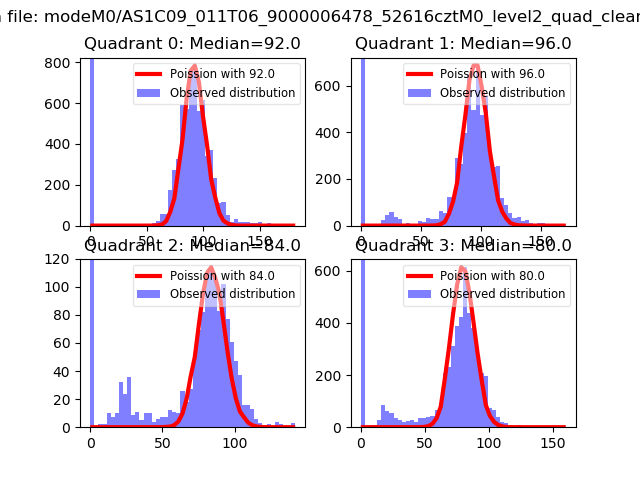
| Comparison with Poisson distribution Blue bars denote a histogram of data divided into 1 sec bins. Red curve is a Poisson curve with rate = median count rate of data. |
 |
 |
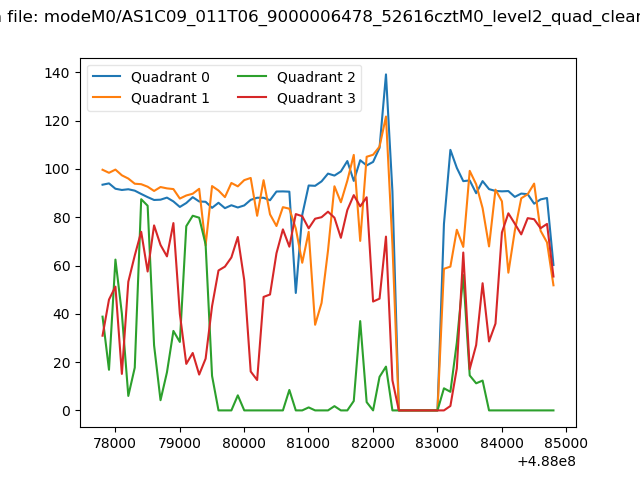
| Quadrant-wise count rates Data is divided into 100 sec bins |
 |
|
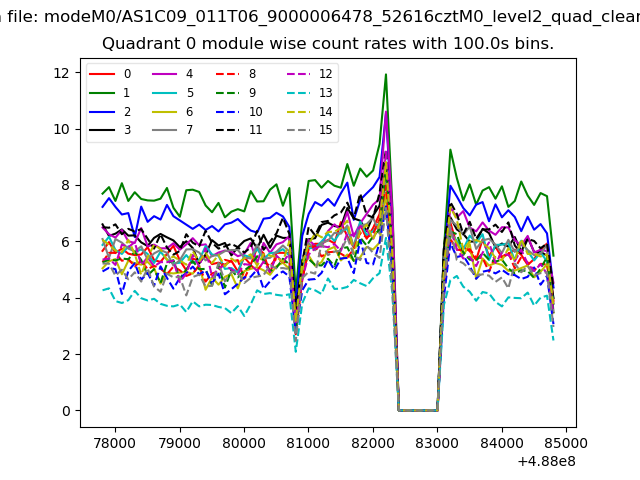
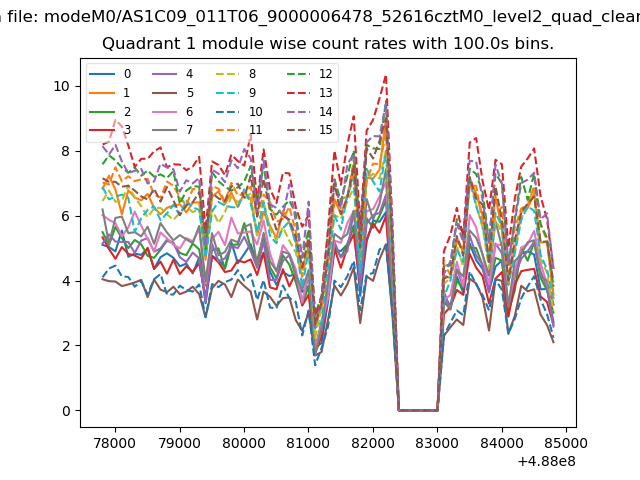
| Module-wise count rates for Quadrant A Data is divided into 100 sec bins |
 |
 |
| Module-wise count rates for Quadrant B Data is divided into 100 sec bins |
 |
 |
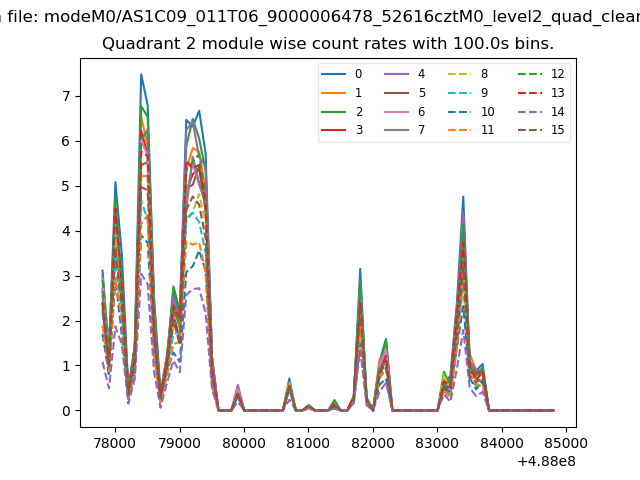
| Module-wise count rates for Quadrant C Data is divided into 100 sec bins |
 |
 |
| Module-wise count rates for Quadrant D Data is divided into 100 sec bins |
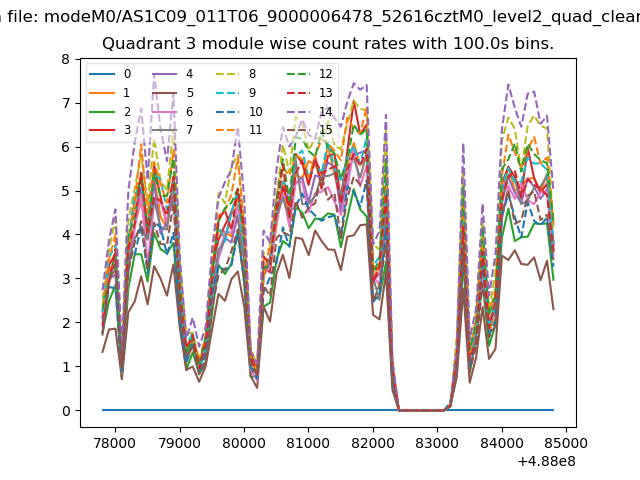 |
 |
| Parameter | Plot |
|---|---|
| CZT HV Monitor | 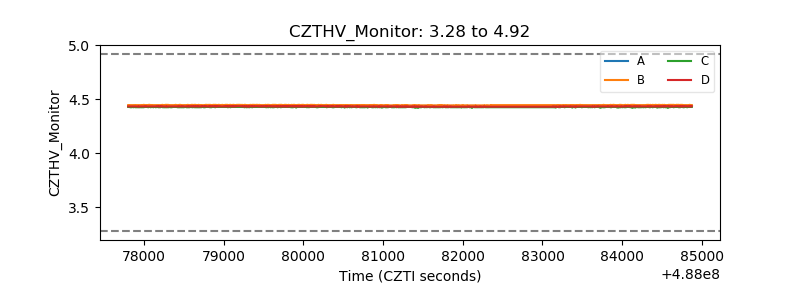 |
| D_VDD | 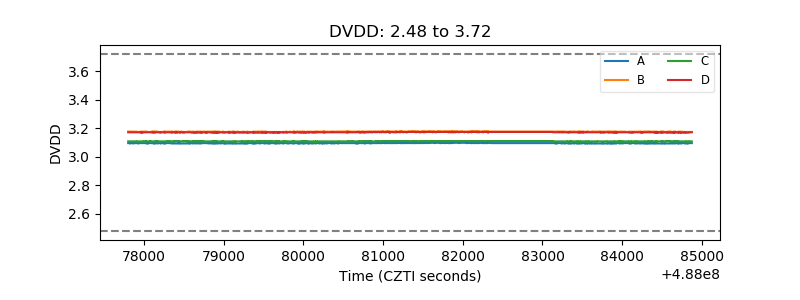 |
| Temperature 1 | 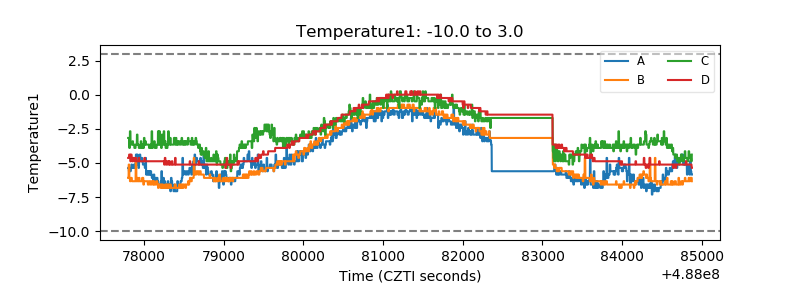 |
| Veto HV Monitor | 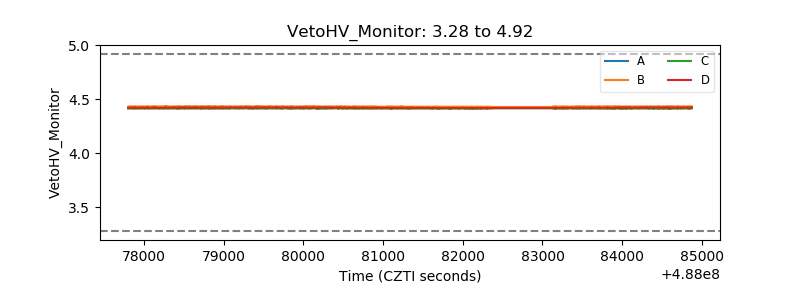 |
| Veto LLD | 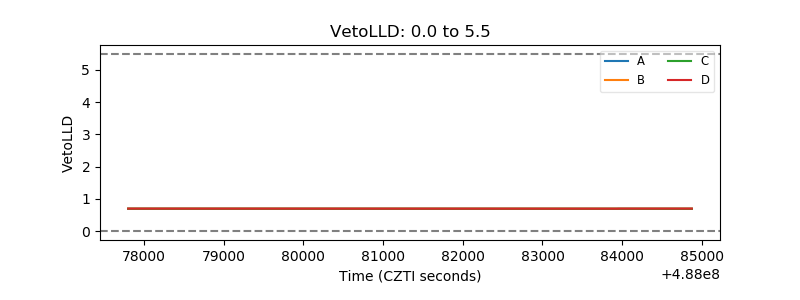 |
| Alpha Counter | 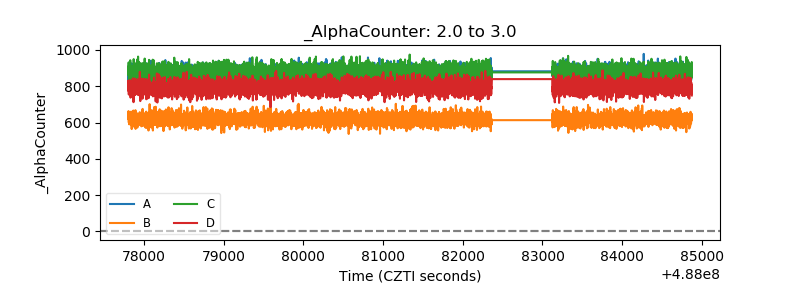 |
| _CPM_Rate | 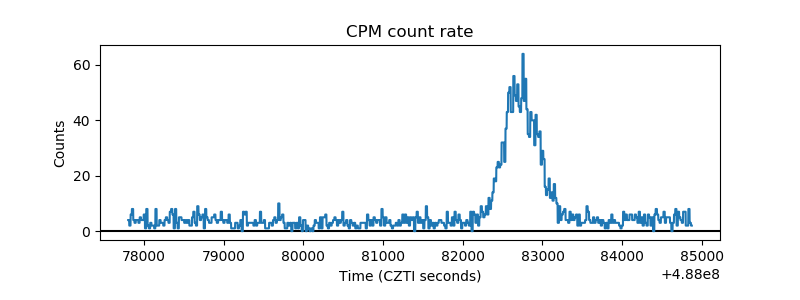 |
| CZT Counter | 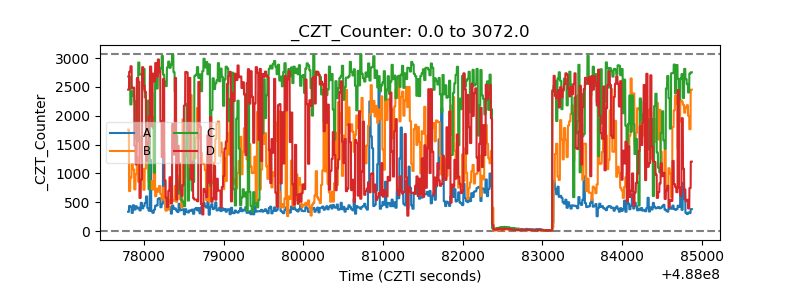 |
| +2.5 Volts monitor |  |
| +5 Volts monitor |  |
| _ROLL_ROT | 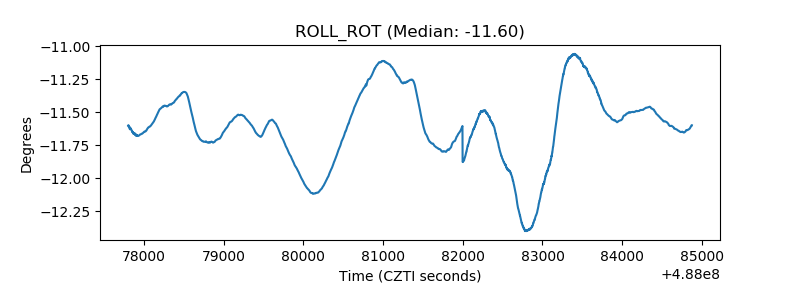 |
| _Roll_DEC | 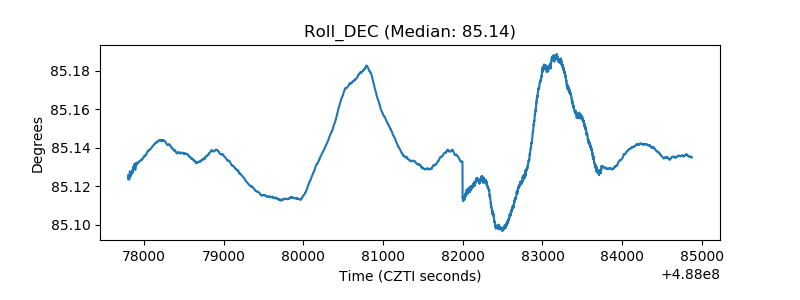 |
| _Roll_RA | 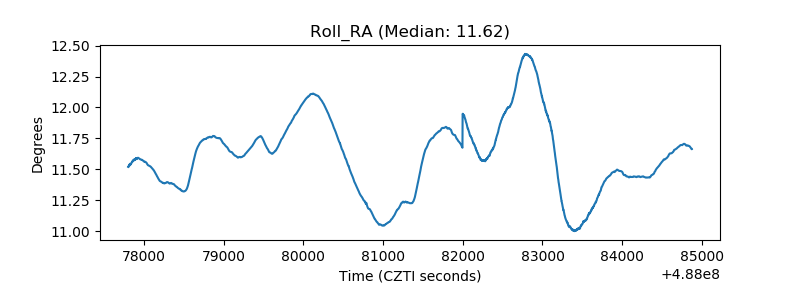 |
| Veto Counter | 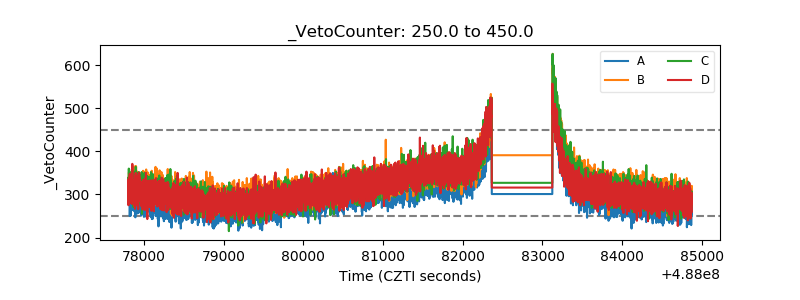 |