| Param | Original file | Final file |
|---|---|---|
| Filename | modeM0/AS1C09_011T06_9000006478_52619cztM0_level2.fits | modeM0/AS1C09_011T06_9000006478_52619cztM0_level2_quad_clean.evt |
| Size (bytes) | 1,068,696,000 | 75,205,440 |
| Size | 1019.2 MB | 71.7 MB |
| Events in quadrant A | 3,691,004 | 656,534 |
| Events in quadrant B | 6,749,360 | 674,292 |
| Events in quadrant C | 18,183,312 | 8,396 |
| Events in quadrant D | 10,381,893 | 438,651 |
| Mode M0 | |||
|---|---|---|---|
| Quadrant | BADHDUFLAG | Total packets | Discarded packets |
| A | 0 | 16254 | 0 |
| B | 0 | 25123 | 0 |
| C | 0 | 58817 | 0 |
| D | 0 | 35826 | 0 |
| Mode SS | |||
|---|---|---|---|
| Quadrant | BADHDUFLAG | Total packets | Discarded packets |
| A | 0 | 142 | 0 |
| B | 0 | 142 | 0 |
| C | 0 | 142 | 0 |
| D | 0 | 142 | 0 |
| Quadrant | Total seconds | Saturated seconds | Saturation percentage |
|---|---|---|---|
| A | 7167 | 97 | 1.353425% |
| B | 7168 | 539 | 7.519531% |
| C | 7168 | 7091 | 98.925781% |
| D | 7168 | 2175 | 30.343192% |
Noise dominated data is calculated using 1-second bins in cleaned event files. If a bin has >2000 counts, and if more than 50% of those come from <1% of pixels, then it is considered to be noise-dominated and hence unusable.
| Quadrant | # 1 sec bins | Bins with >0 counts | Bins with >2000 counts | High rate bins dominated by noise | Noise dominated (total time) | Noise dominated (detector-on time) | Marked lightcurve |
|---|---|---|---|---|---|---|---|
| A | 7167 | 7167 | 55 | 55 | 0.77% | 0.77% | 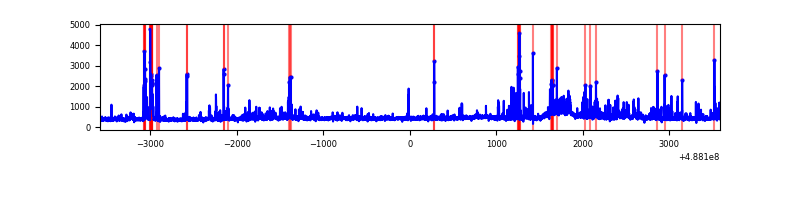 |
| B | 7168 | 7168 | 196 | 196 | 2.73% | 2.73% | 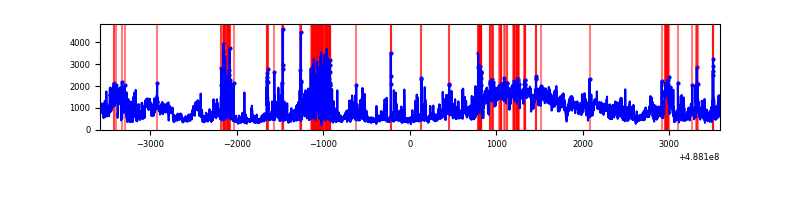 |
| C | 7167 | 7167 | 6275 | 6275 | 87.55% | 87.55% | 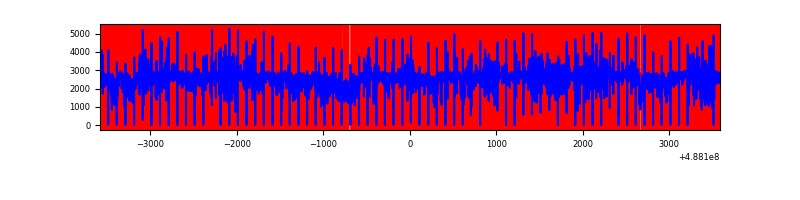 |
| D | 7168 | 7168 | 1953 | 1953 | 27.25% | 27.25% | 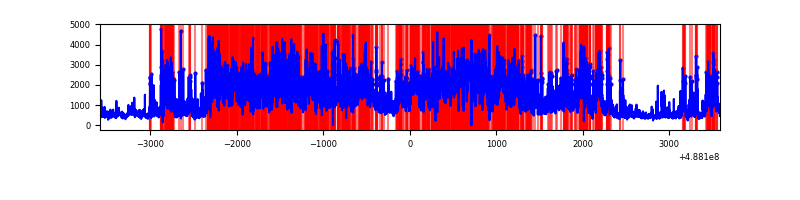 |
Top three noisy pixels from each quadrant. If the there are fewer than three noisy pixels in the level2.evt file, extra rows are filled as -1
| Pixel properties | Quadrant properties | ||||||
|---|---|---|---|---|---|---|---|
| Quadrant | DetID | PixID | Counts | Sigma | Mean | Median | Sigma |
| A | 3 | 46 | 375551 | 2020.85 | 736 | 717 | 185.5 |
| A | 7 | 190 | 90177 | 482.31 | 736 | 717 | 185.5 |
| A | 8 | 246 | 74195 | 396.14 | 736 | 717 | 185.5 |
| B | 10 | 254 | 2638290 | 17440.31 | 713 | 690 | 151.2 |
| B | 10 | 128 | 405241 | 2674.97 | 713 | 690 | 151.2 |
| B | 8 | 234 | 234484 | 1545.89 | 713 | 690 | 151.2 |
| C | 15 | 248 | 17528311 | 476093.43 | 127 | 126 | 36.8 |
| C | 12 | 254 | 74829 | 2029.05 | 127 | 126 | 36.8 |
| C | 1 | 44 | 18404 | 496.46 | 127 | 126 | 36.8 |
| D | 2 | 62 | 2692326 | 15163.75 | 624 | 596 | 177.5 |
| D | 8 | 176 | 1741332 | 9806.36 | 624 | 596 | 177.5 |
| D | 6 | 42 | 1192721 | 6715.79 | 624 | 596 | 177.5 |
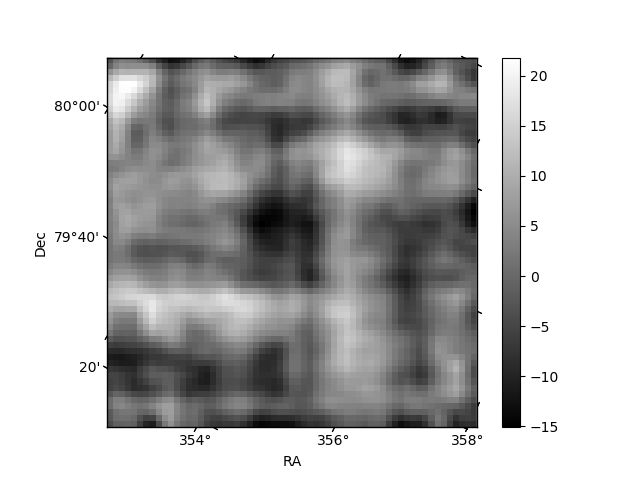
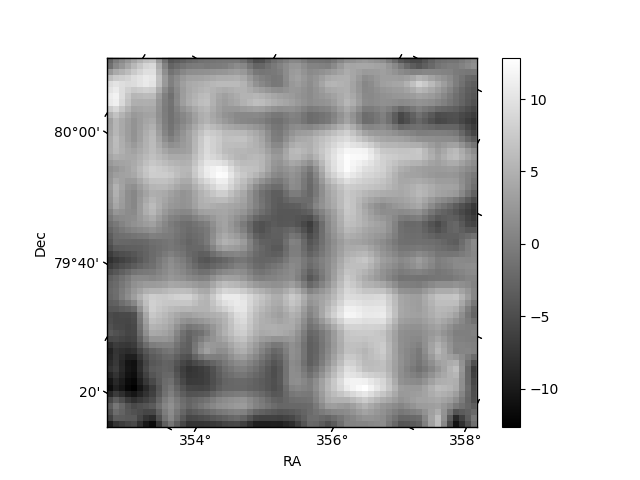
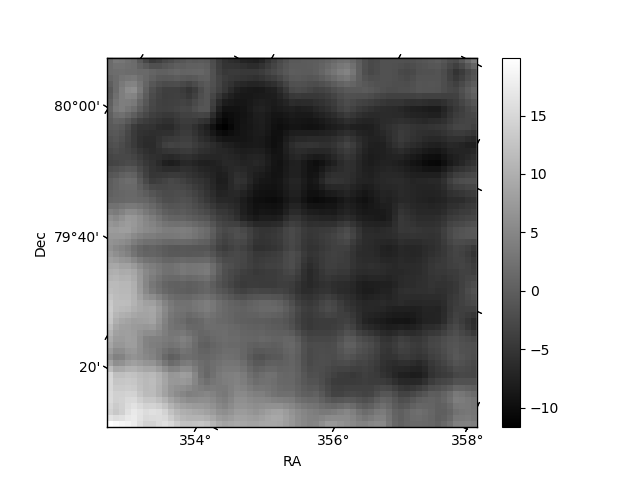
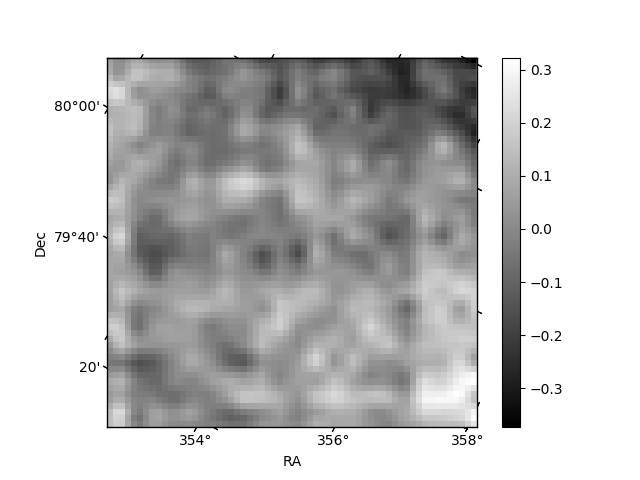
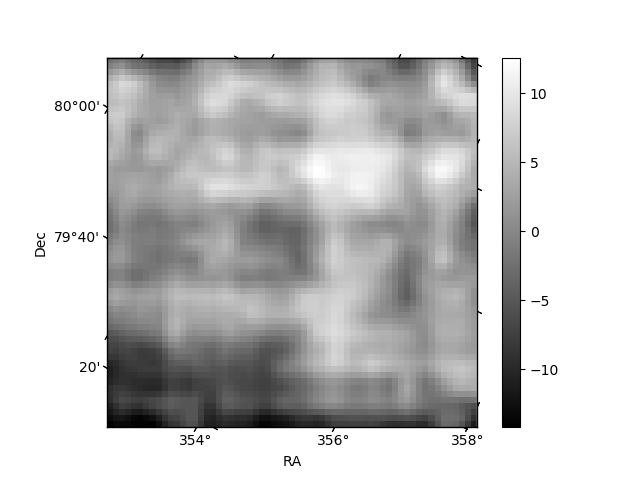
Histogram calculated using DETX and DETY for each event in the final _common_clean file
| Quadrant A | 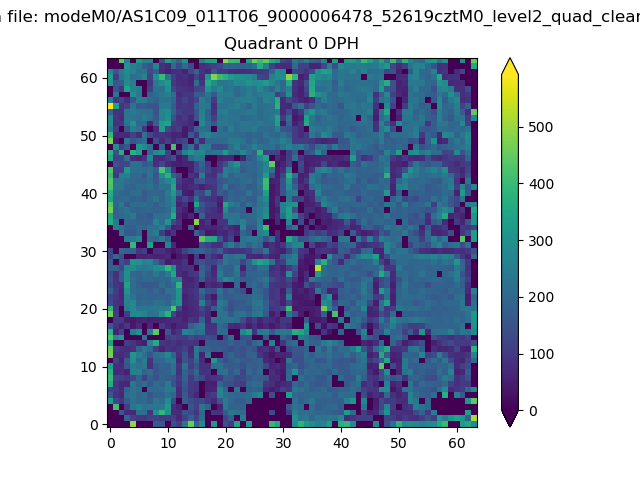 |
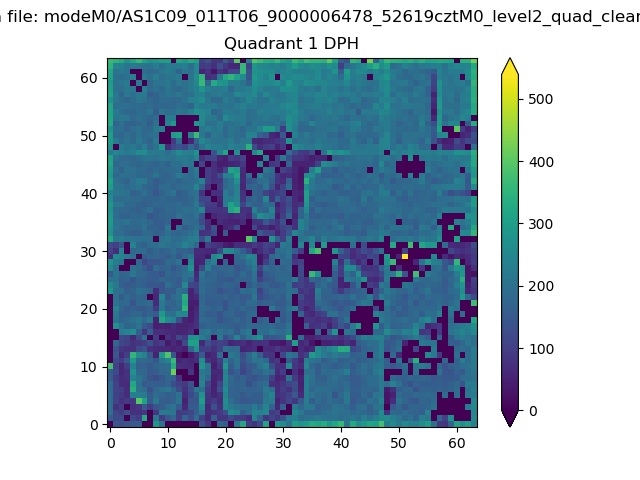 |
Quadrant B |
|---|---|---|---|
| Quadrant D | 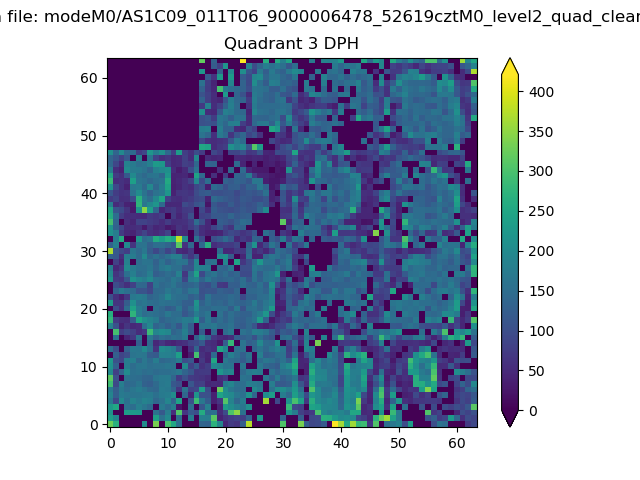 |
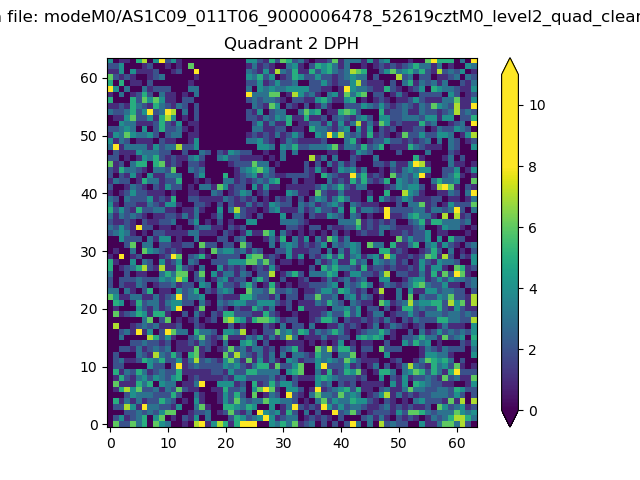 |
Quadrant C |
| Plot type | Count rate plots | Images |
|---|---|---|
| Comparison with Poisson distribution Blue bars denote a histogram of data divided into 1 sec bins. Red curve is a Poisson curve with rate = median count rate of data. |
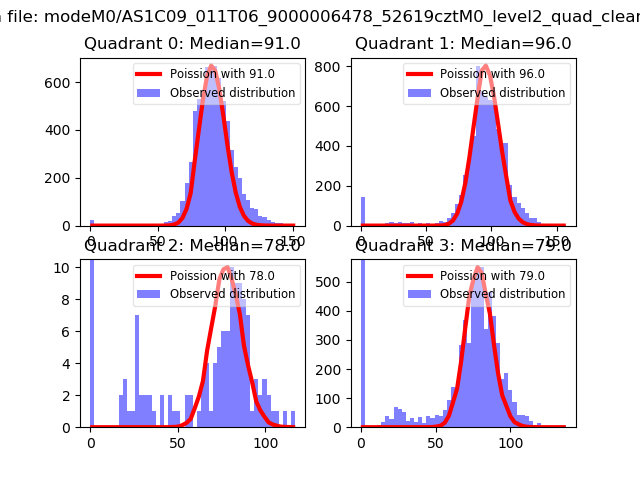 |
 |
| Quadrant-wise count rates Data is divided into 100 sec bins |
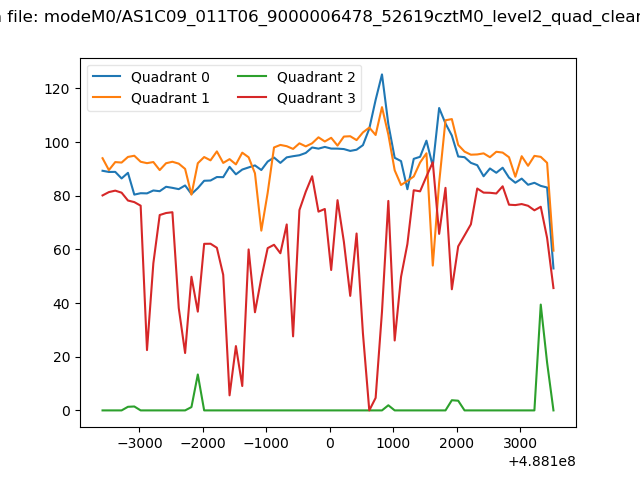 |
|
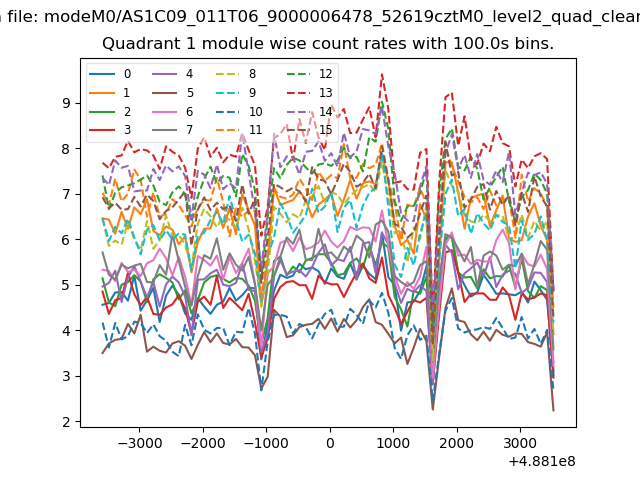
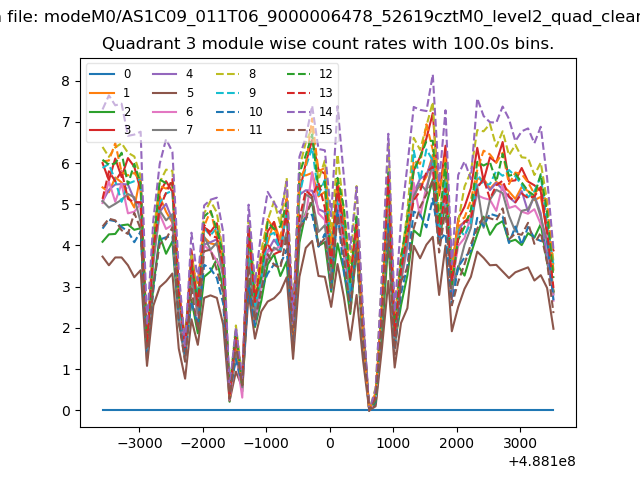
| Module-wise count rates for Quadrant A Data is divided into 100 sec bins |
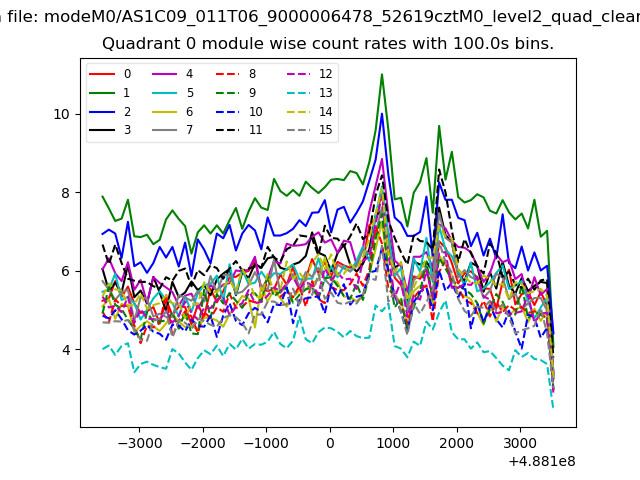 |
 |
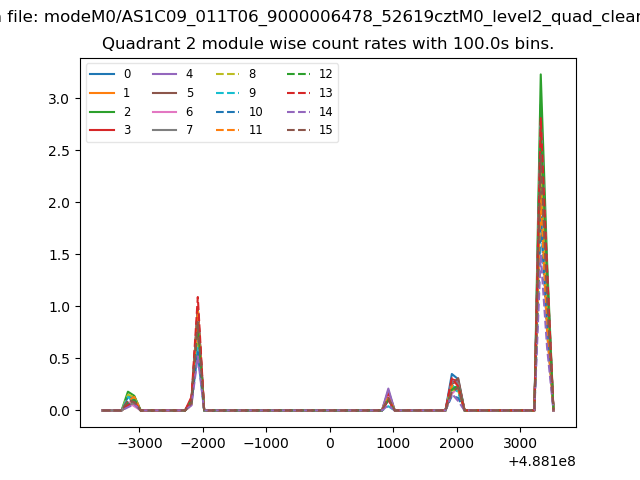
| Module-wise count rates for Quadrant B Data is divided into 100 sec bins |
 |
 |
| Module-wise count rates for Quadrant C Data is divided into 100 sec bins |
 |
 |
| Module-wise count rates for Quadrant D Data is divided into 100 sec bins |
 |
 |
| Parameter | Plot |
|---|---|
| CZT HV Monitor | 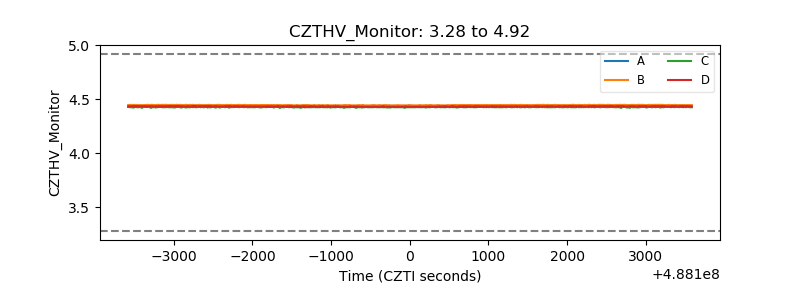 |
| D_VDD | 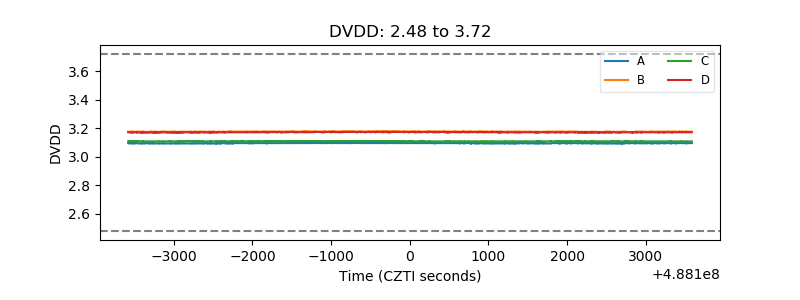 |
| Temperature 1 | 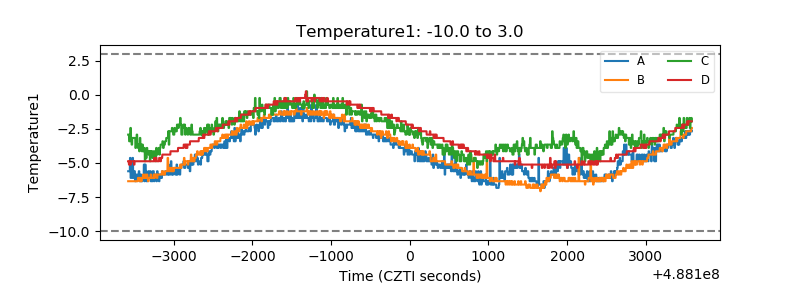 |
| Veto HV Monitor | 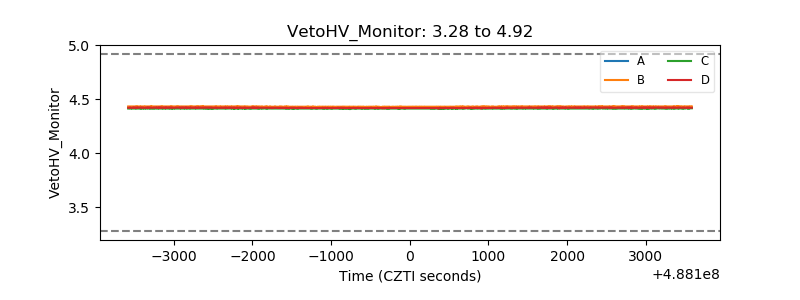 |
| Veto LLD | 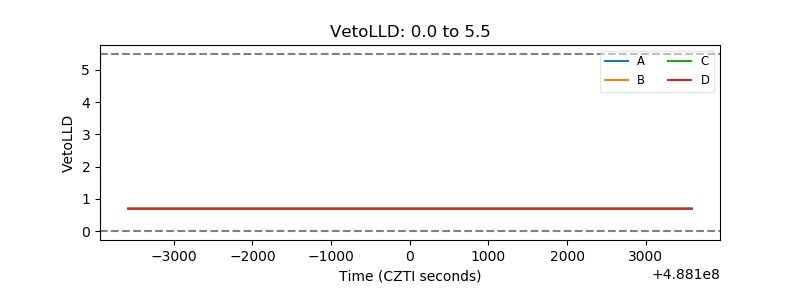 |
| Alpha Counter | 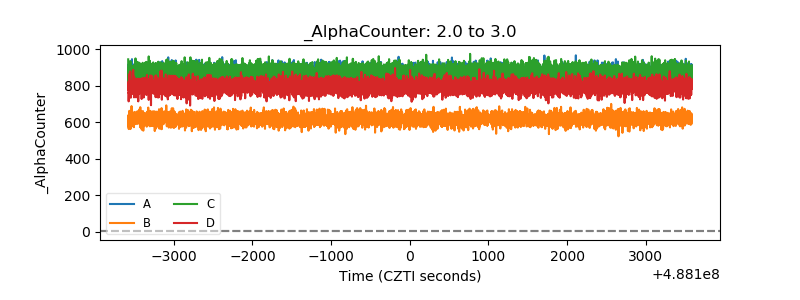 |
| _CPM_Rate | 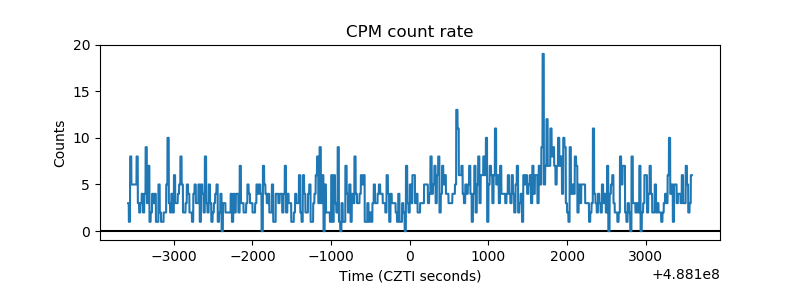 |
| CZT Counter | 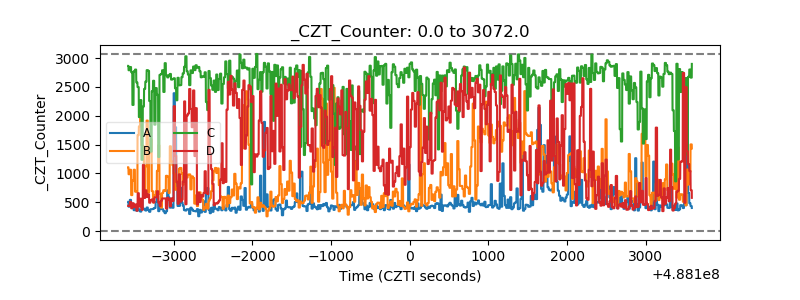 |
| +2.5 Volts monitor | 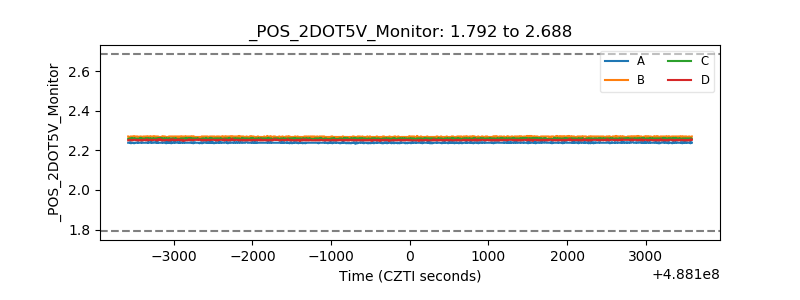 |
| +5 Volts monitor |  |
| _ROLL_ROT | 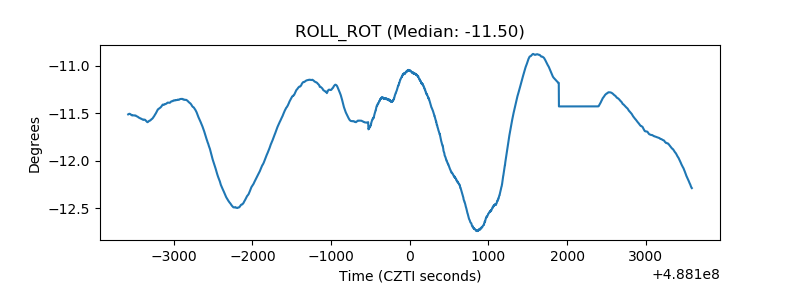 |
| _Roll_DEC | 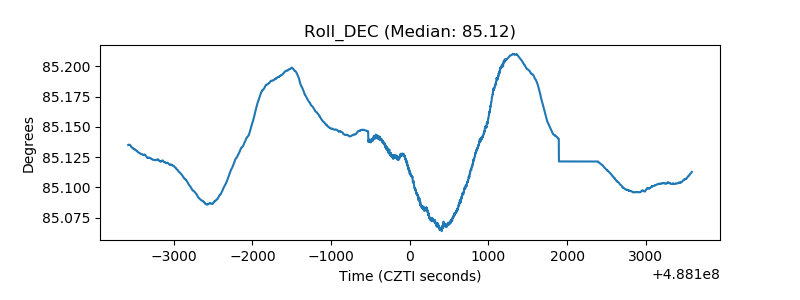 |
| _Roll_RA | 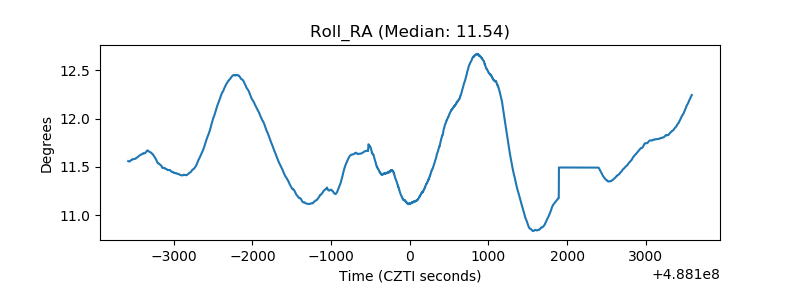 |
| Veto Counter | 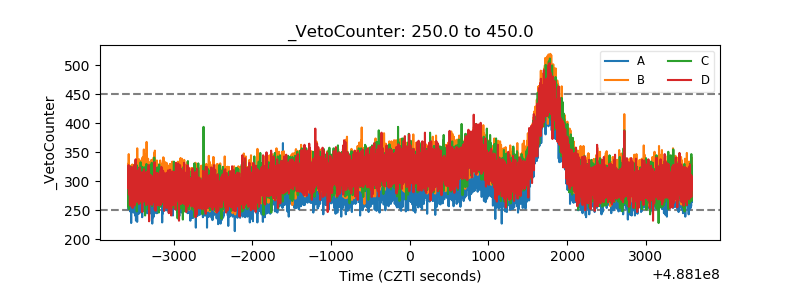 |