| Param | Original file | Final file |
|---|---|---|
| Filename | modeM0/AS1C09_011T07_9000006480cztM0_level2.fits | modeM0/AS1C09_011T07_9000006480cztM0_level2_quad_clean.evt |
| Size (bytes) | 583,194,240 | 311,682,240 |
| Size | 556.2 MB | 297.2 MB |
| Events in quadrant A | 2,697,571 | 361,423 |
| Events in quadrant B | 2,274,662 | 277,166 |
| Events in quadrant C | 2,482,056 | 391,710 |
| Events in quadrant D | 2,037,395 | 280,033 |
| Mode M9 | |||
|---|---|---|---|
| Quadrant | BADHDUFLAG | Total packets | Discarded packets |
| A | 0 | 288 | 0 |
| B | 0 | 288 | 0 |
| C | 0 | 288 | 0 |
| D | 0 | 288 | 0 |
| Mode SS | |||
|---|---|---|---|
| Quadrant | BADHDUFLAG | Total packets | Discarded packets |
| A | 0 | 2400 | 0 |
| B | 0 | 2400 | 0 |
| C | 0 | 2400 | 0 |
| D | 0 | 2400 | 0 |
| Mode M0 | |||
|---|---|---|---|
| Quadrant | BADHDUFLAG | Total packets | Discarded packets |
| A | 0 | 427885 | 0 |
| B | 0 | 510513 | 0 |
| C | 0 | 421911 | 0 |
| D | 0 | 527204 | 0 |
| Quadrant | Total seconds | Saturated seconds | Saturation percentage |
|---|---|---|---|
| A | 118434 | 16218 | 13.693703% |
| B | 118440 | 29884 | 25.231341% |
| C | 118435 | 21859 | 18.456537% |
| D | 118438 | 29644 | 25.029129% |
Noise dominated data is calculated using 1-second bins in cleaned event files. If a bin has >2000 counts, and if more than 50% of those come from <1% of pixels, then it is considered to be noise-dominated and hence unusable.
| Quadrant | # 1 sec bins | Bins with >0 counts | Bins with >2000 counts | High rate bins dominated by noise | Noise dominated (total time) | Noise dominated (detector-on time) | Marked lightcurve |
|---|---|---|---|---|---|---|---|
| A | 1276203 | 58820 | 0 | 0 | 0.00% | 0.00% | 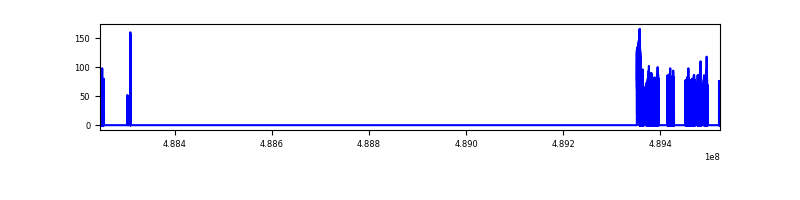 |
| B | 1276203 | 55657 | 0 | 0 | 0.00% | 0.00% | 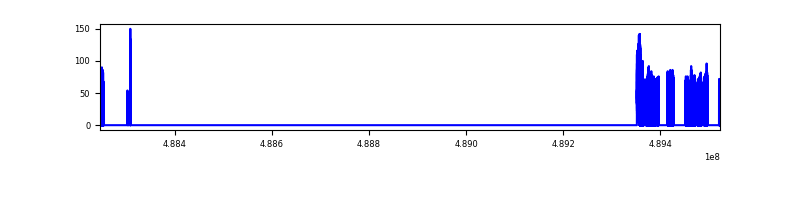 |
| C | 1276203 | 61254 | 0 | 0 | 0.00% | 0.00% | 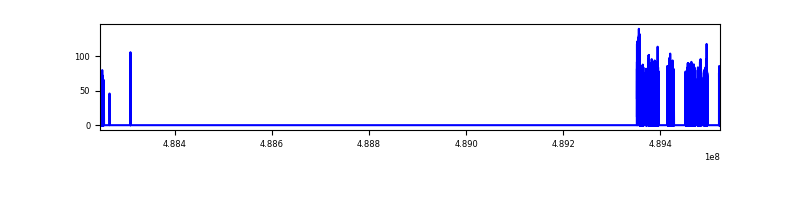 |
| D | 1276203 | 53978 | 0 | 0 | 0.00% | 0.00% | 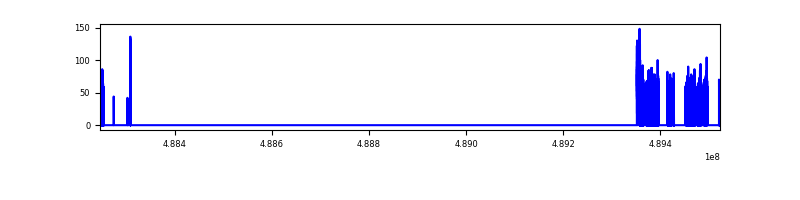 |
Top three noisy pixels from each quadrant. If the there are fewer than three noisy pixels in the level2.evt file, extra rows are filled as -1
| Pixel properties | Quadrant properties | ||||||
|---|---|---|---|---|---|---|---|
| Quadrant | DetID | PixID | Counts | Sigma | Mean | Median | Sigma |
| A | 14 | 188 | 3088 | 10.4 | 711 | 662 | 233.4 |
| A | 9 | 255 | 2800 | 9.16 | 711 | 662 | 233.4 |
| A | 14 | 204 | 2559 | 8.13 | 711 | 662 | 233.4 |
| B | 2 | 9 | 2602 | 14.11 | 607 | 577 | 143.5 |
| B | 2 | 8 | 2380 | 12.56 | 607 | 577 | 143.5 |
| B | 3 | 25 | 1883 | 9.1 | 607 | 577 | 143.5 |
| C | 3 | 202 | 2016 | 6.13 | 665 | 607 | 229.8 |
| C | 2 | 31 | 2003 | 6.08 | 665 | 607 | 229.8 |
| C | 7 | 221 | 1978 | 5.97 | 665 | 607 | 229.8 |
| D | 6 | 218 | 2767 | 11.3 | 585 | 519 | 199.0 |
| D | 15 | 11 | 2042 | 7.65 | 585 | 519 | 199.0 |
| D | 3 | 30 | 1912 | 7.0 | 585 | 519 | 199.0 |
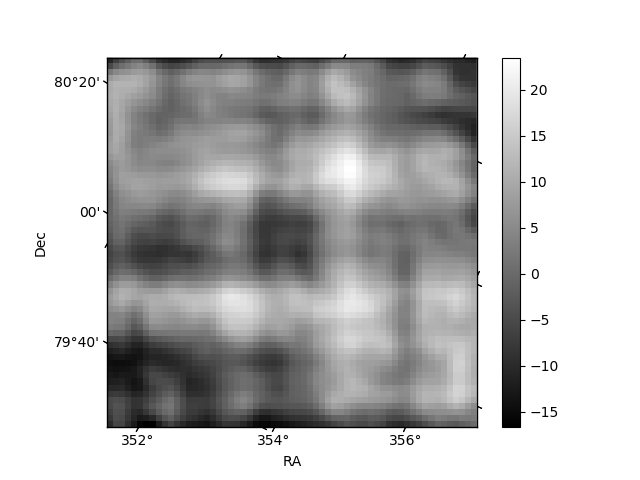
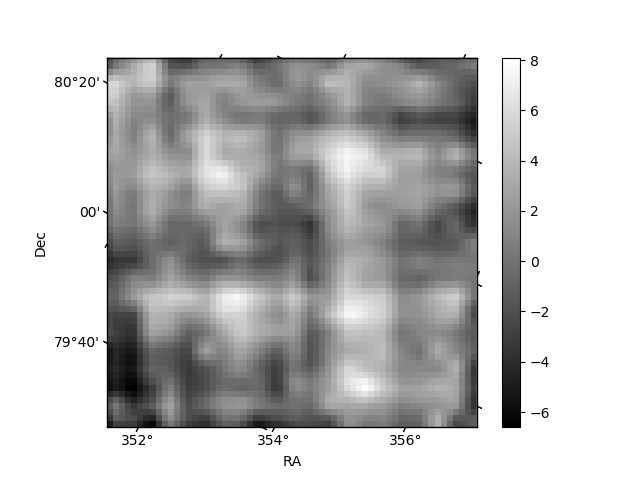
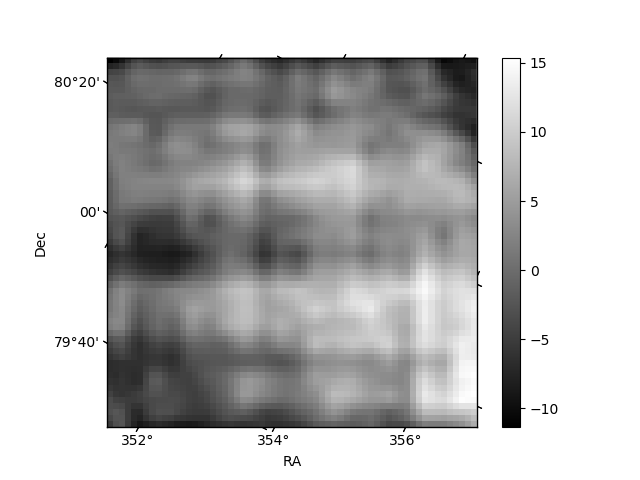
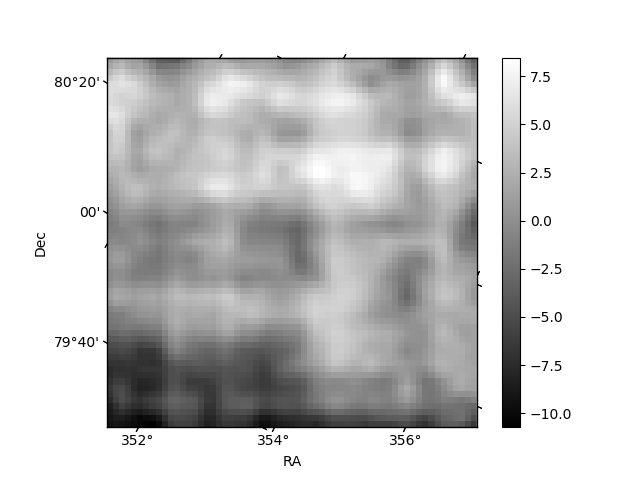
Histogram calculated using DETX and DETY for each event in the final _common_clean file
| Quadrant A | 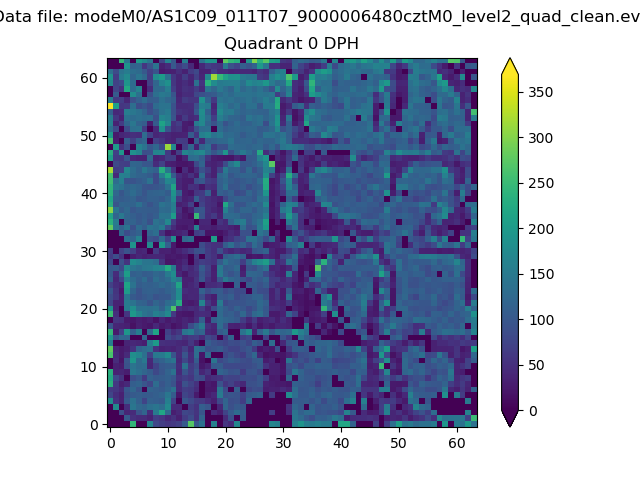 |
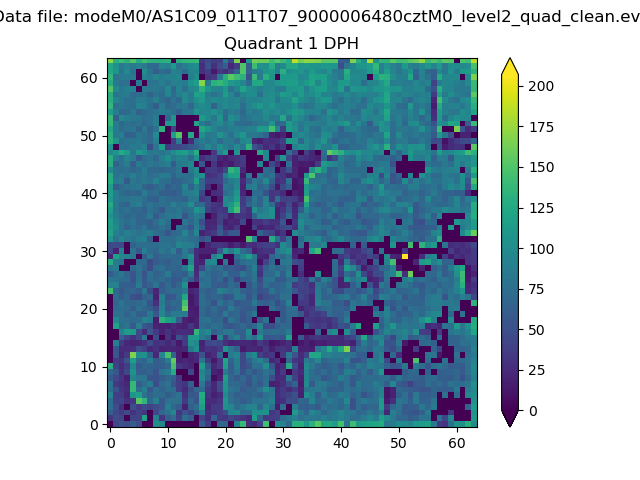 |
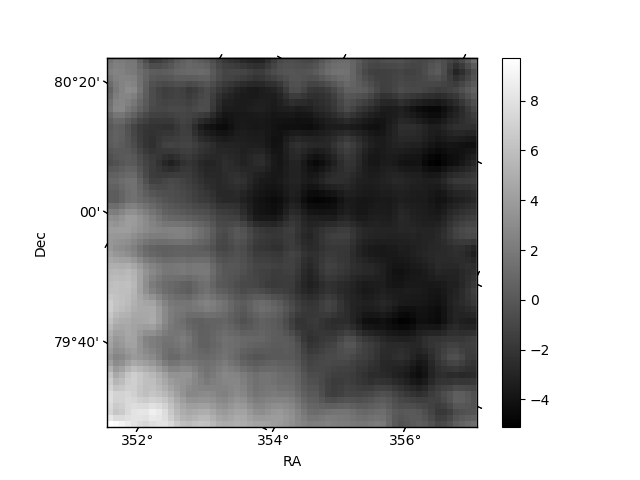
Quadrant B |
|---|---|---|---|
| Quadrant D | 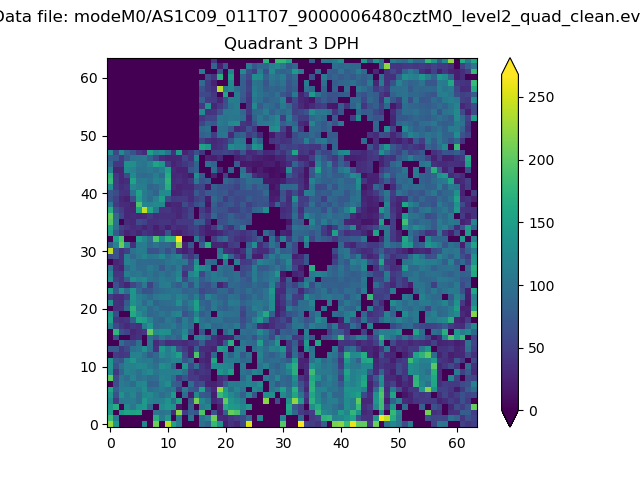 |
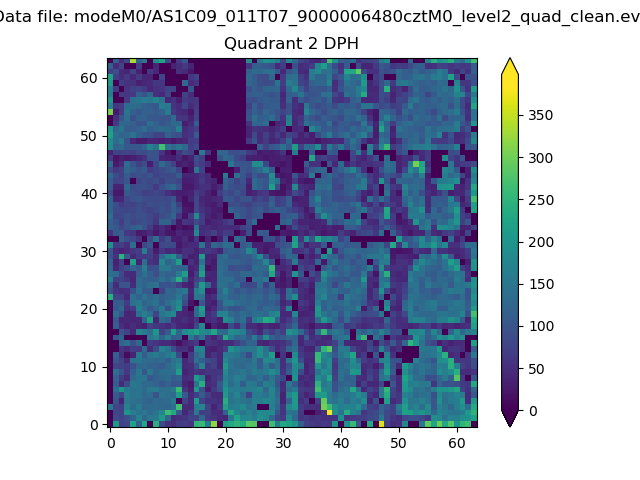 |
Quadrant C |
| Plot type | Count rate plots | Images |
|---|---|---|
| Comparison with Poisson distribution Blue bars denote a histogram of data divided into 1 sec bins. Red curve is a Poisson curve with rate = median count rate of data. |
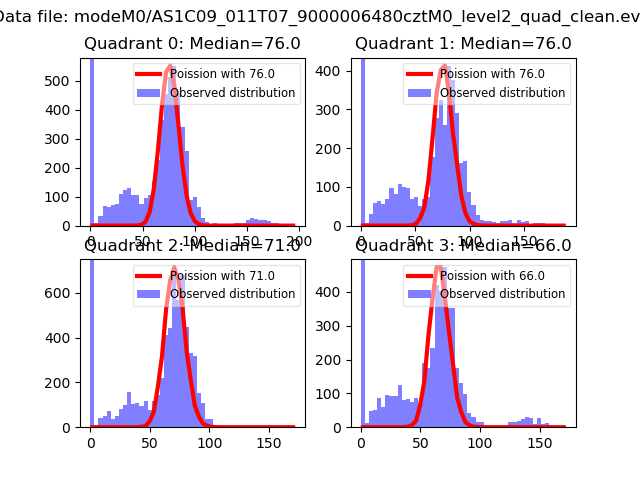 |
 |
| Quadrant-wise count rates Data is divided into 100 sec bins |
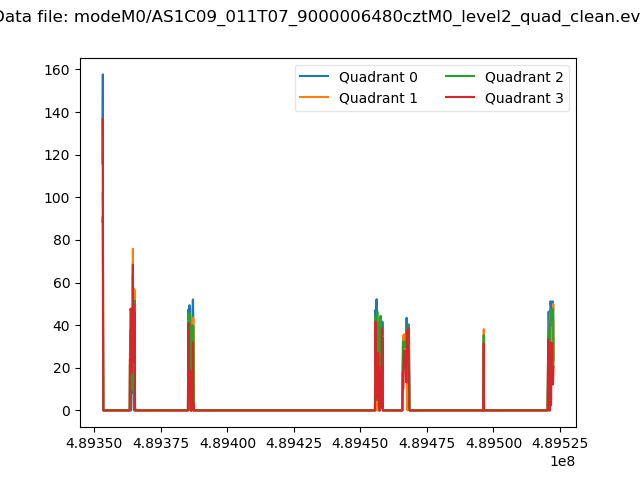 |
|
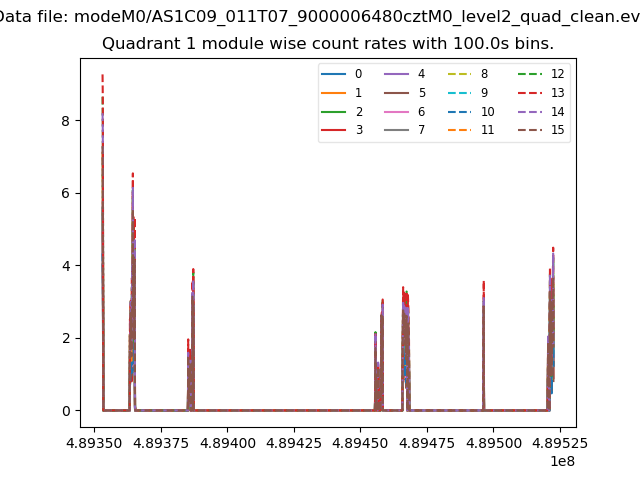
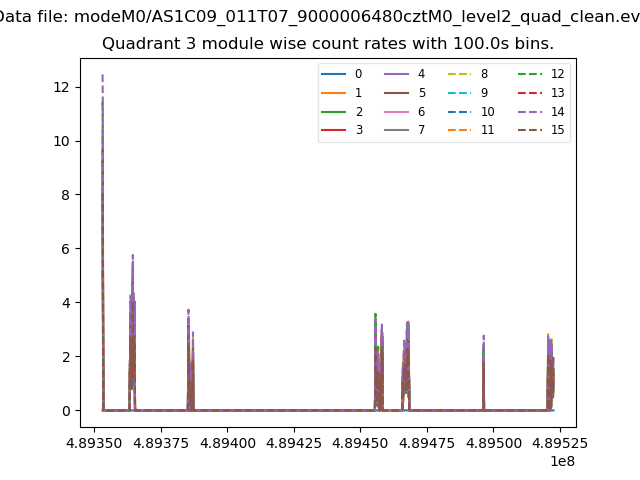
| Module-wise count rates for Quadrant A Data is divided into 100 sec bins |
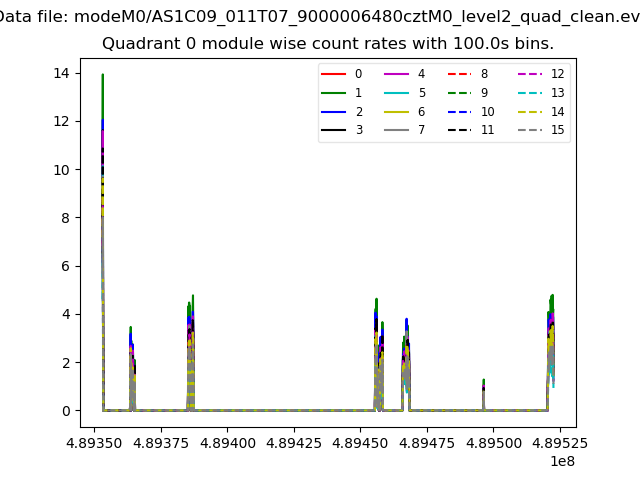 |
 |
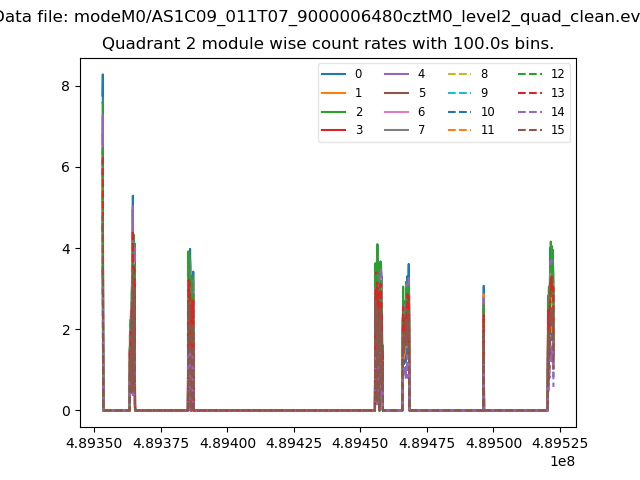
| Module-wise count rates for Quadrant B Data is divided into 100 sec bins |
 |
 |
| Module-wise count rates for Quadrant C Data is divided into 100 sec bins |
 |
 |
| Module-wise count rates for Quadrant D Data is divided into 100 sec bins |
 |
 |
| Parameter | Plot |
|---|---|
| CZT HV Monitor | 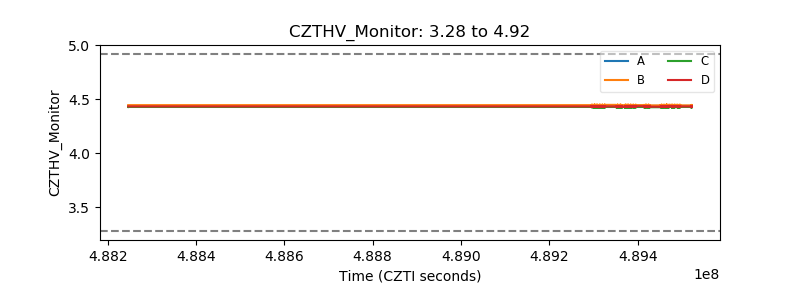 |
| D_VDD | 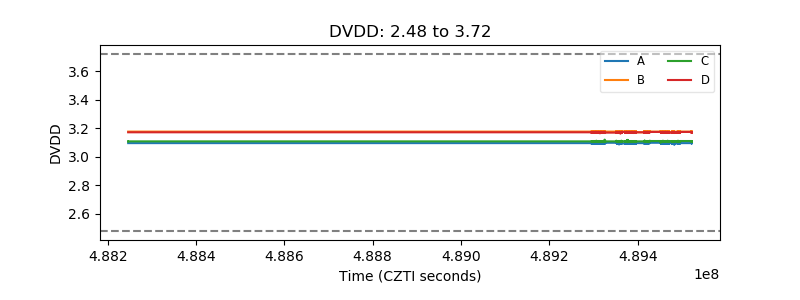 |
| Temperature 1 | 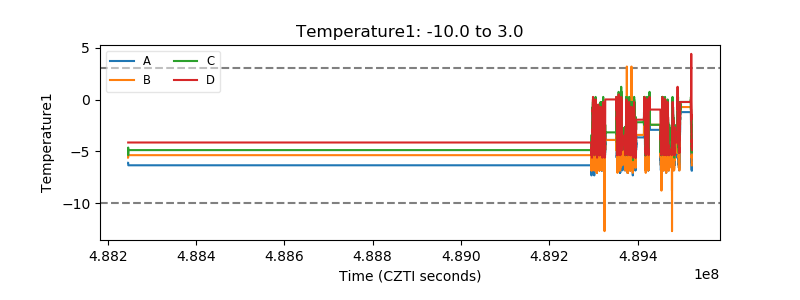 |
| Veto HV Monitor | 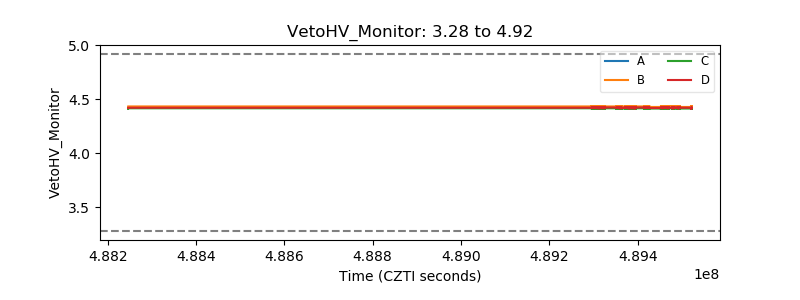 |
| Veto LLD | 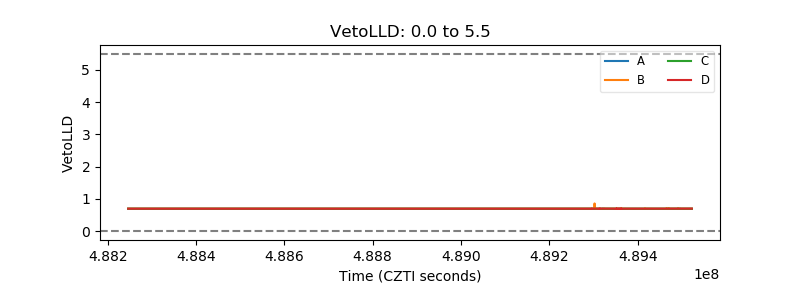 |
| Alpha Counter | 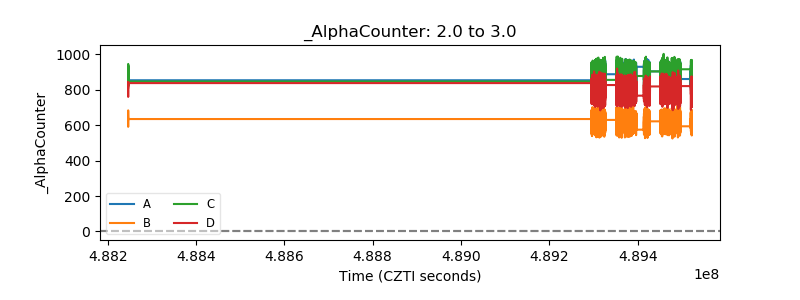 |
| _CPM_Rate | 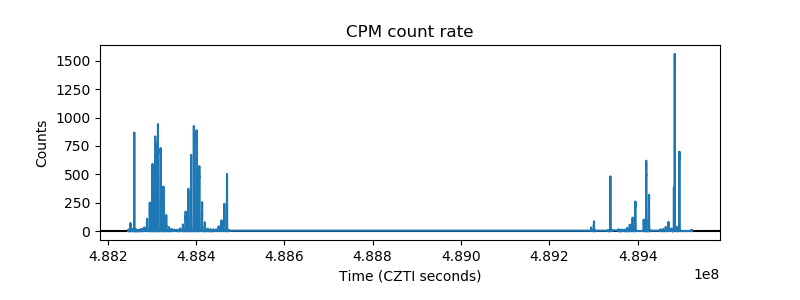 |
| CZT Counter | 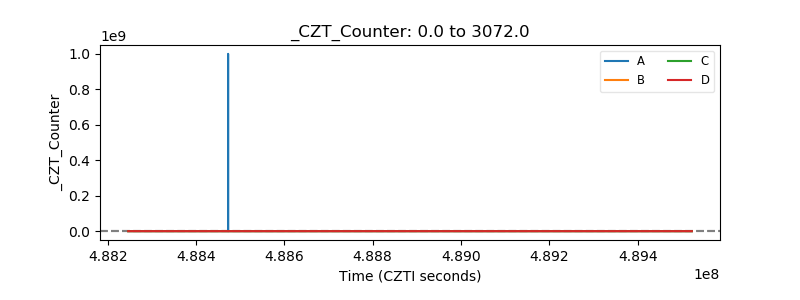 |
| +2.5 Volts monitor | 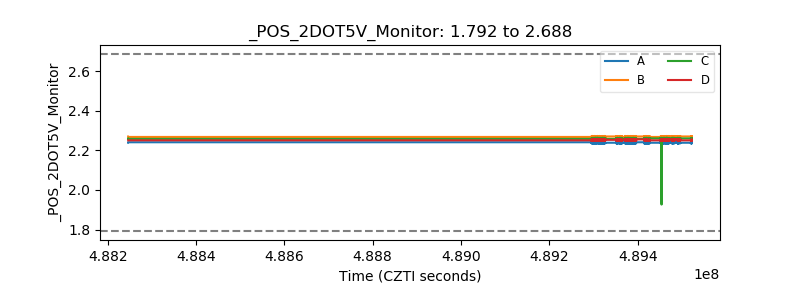 |
| +5 Volts monitor | 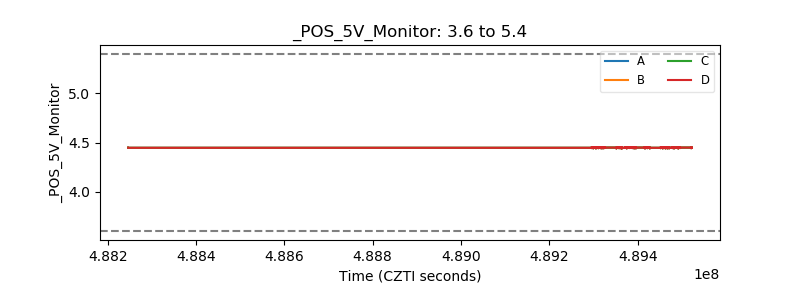 |
| _ROLL_ROT | 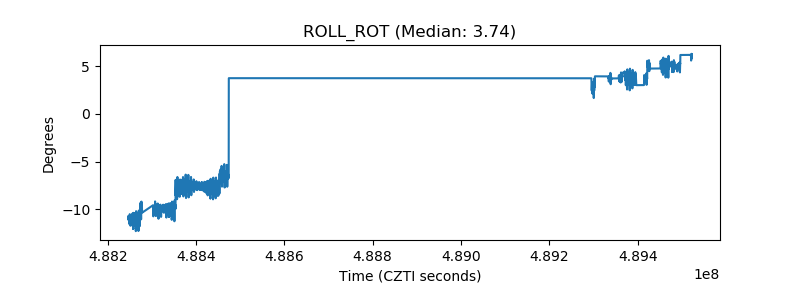 |
| _Roll_DEC | 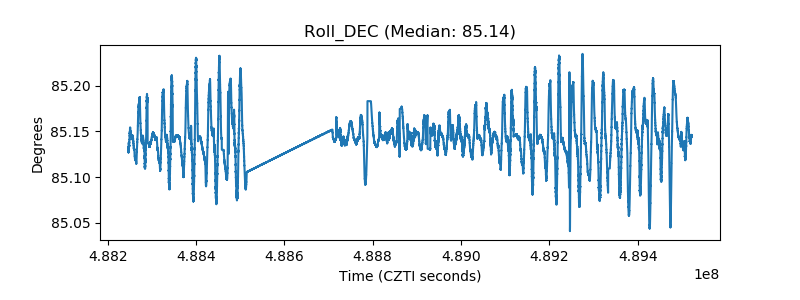 |
| _Roll_RA | 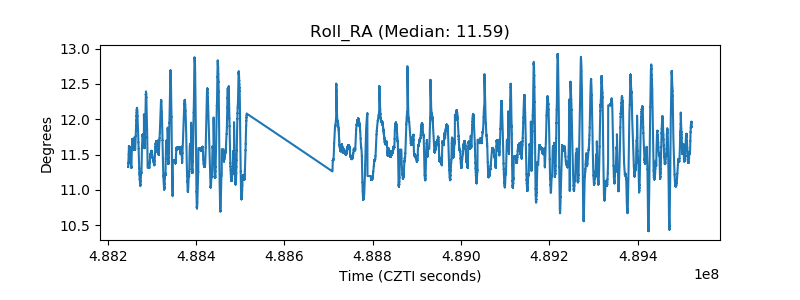 |
| Veto Counter |  |