| Param | Original file | Final file |
|---|---|---|
| Filename | modeM0/AS1C09_011T07_9000006480_52836cztM0_level2.fits | modeM0/AS1C09_011T07_9000006480_52836cztM0_level2_quad_clean.evt |
| Size (bytes) | 1,051,957,440 | 98,484,480 |
| Size | 1003.2 MB | 93.9 MB |
| Events in quadrant A | 13,017,973 | 508,778 |
| Events in quadrant B | 9,509,326 | 726,008 |
| Events in quadrant C | 7,852,777 | 600,465 |
| Events in quadrant D | 7,946,127 | 591,913 |
| Mode SS | |||
|---|---|---|---|
| Quadrant | BADHDUFLAG | Total packets | Discarded packets |
| A | 0 | 160 | 0 |
| B | 0 | 160 | 0 |
| C | 0 | 160 | 0 |
| D | 0 | 160 | 0 |
| Mode M0 | |||
|---|---|---|---|
| Quadrant | BADHDUFLAG | Total packets | Discarded packets |
| A | 0 | 44254 | 0 |
| B | 0 | 33796 | 0 |
| C | 0 | 29121 | 1 |
| D | 0 | 29226 | 0 |
| Quadrant | Total seconds | Saturated seconds | Saturation percentage |
|---|---|---|---|
| A | 7969 | 2976 | 37.344711% |
| B | 7969 | 1132 | 14.205045% |
| C | 7968 | 1421 | 17.833835% |
| D | 7969 | 1248 | 15.660685% |
Noise dominated data is calculated using 1-second bins in cleaned event files. If a bin has >2000 counts, and if more than 50% of those come from <1% of pixels, then it is considered to be noise-dominated and hence unusable.
| Quadrant | # 1 sec bins | Bins with >0 counts | Bins with >2000 counts | High rate bins dominated by noise | Noise dominated (total time) | Noise dominated (detector-on time) | Marked lightcurve |
|---|---|---|---|---|---|---|---|
| A | 7969 | 7969 | 2566 | 2566 | 32.20% | 32.20% | 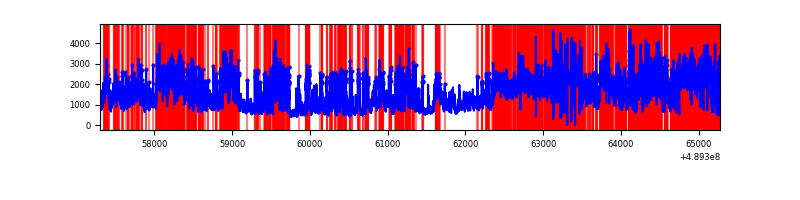 |
| B | 7969 | 7969 | 707 | 707 | 8.87% | 8.87% | 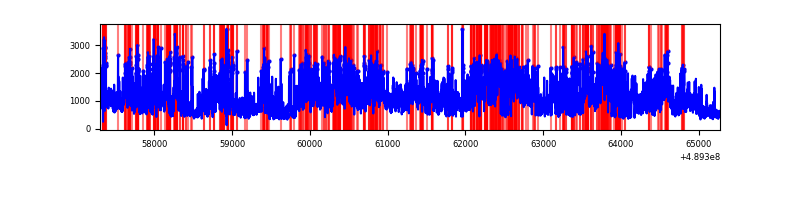 |
| C | 7968 | 7968 | 1111 | 1111 | 13.94% | 13.94% | 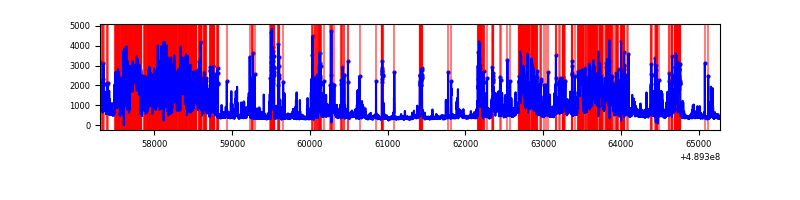 |
| D | 7969 | 7969 | 1020 | 1020 | 12.80% | 12.80% | 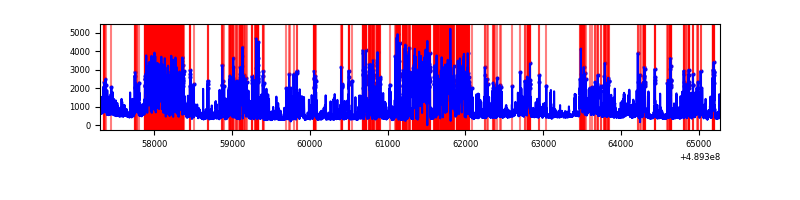 |
Top three noisy pixels from each quadrant. If the there are fewer than three noisy pixels in the level2.evt file, extra rows are filled as -1
| Pixel properties | Quadrant properties | ||||||
|---|---|---|---|---|---|---|---|
| Quadrant | DetID | PixID | Counts | Sigma | Mean | Median | Sigma |
| A | 9 | 191 | 5396941 | 30609.74 | 701 | 684 | 176.3 |
| A | 3 | 62 | 2364192 | 13406.77 | 701 | 684 | 176.3 |
| A | 4 | 238 | 693830 | 3931.8 | 701 | 684 | 176.3 |
| B | 8 | 3 | 5233390 | 30615.16 | 802 | 773 | 170.9 |
| B | 10 | 254 | 404434 | 2361.75 | 802 | 773 | 170.9 |
| B | 6 | 203 | 157238 | 915.45 | 802 | 773 | 170.9 |
| C | 15 | 224 | 2205983 | 10353.14 | 760 | 750 | 213.0 |
| C | 2 | 12 | 1432906 | 6723.7 | 760 | 750 | 213.0 |
| C | 4 | 5 | 543035 | 2545.92 | 760 | 750 | 213.0 |
| D | 12 | 17 | 2804414 | 12742.3 | 761 | 724 | 220.0 |
| D | 3 | 224 | 682178 | 3097.09 | 761 | 724 | 220.0 |
| D | 2 | 249 | 414746 | 1881.66 | 761 | 724 | 220.0 |
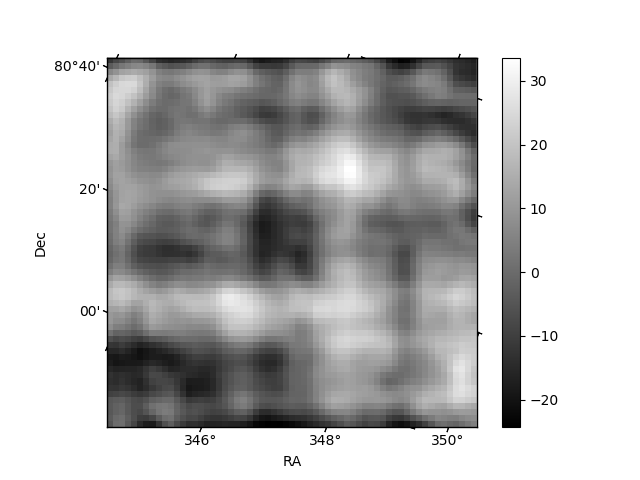
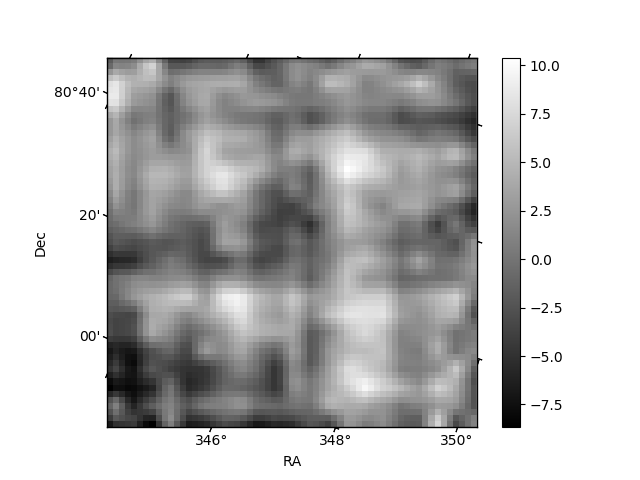
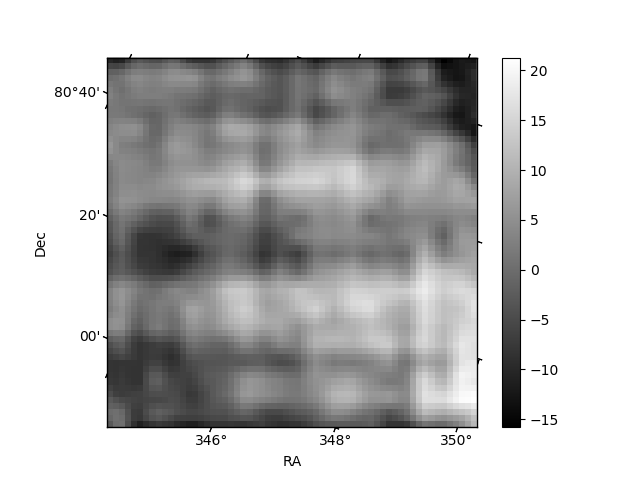
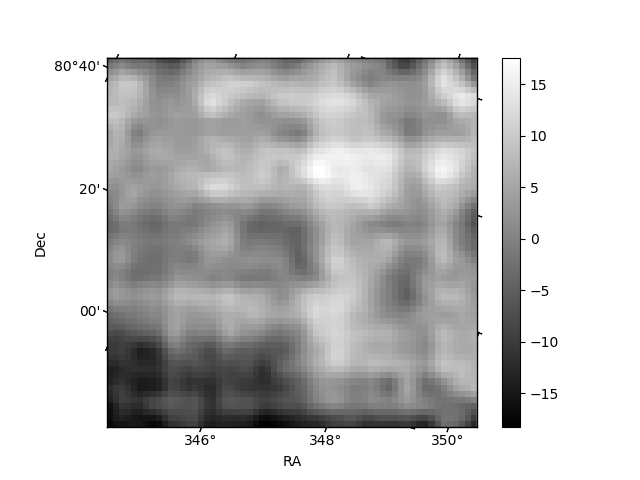
Histogram calculated using DETX and DETY for each event in the final _common_clean file
| Quadrant A | 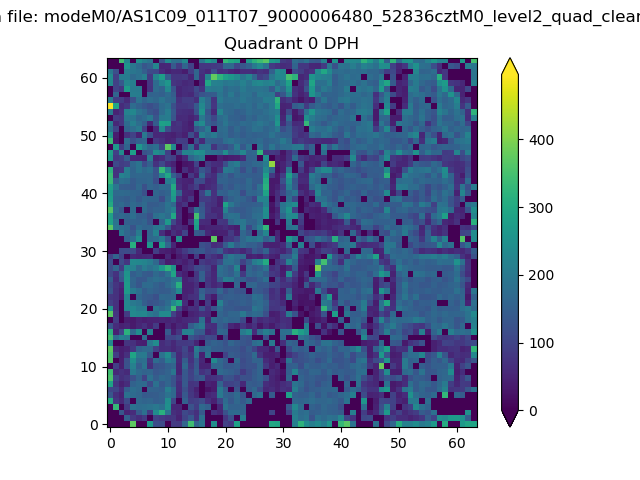 |
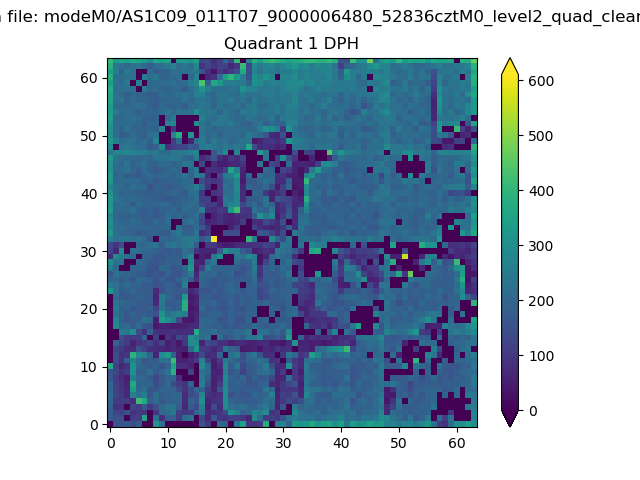 |
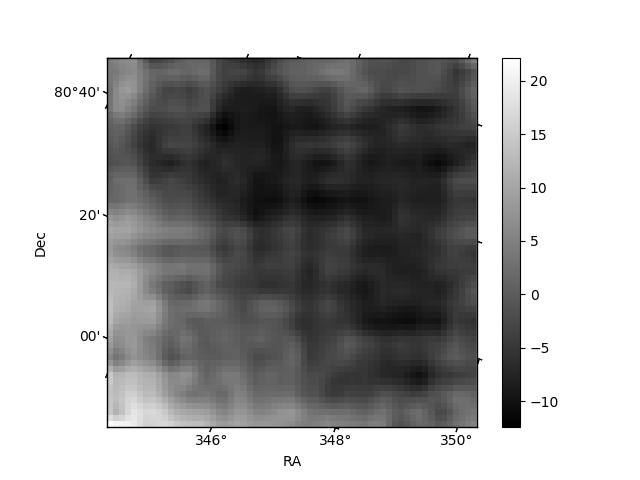
Quadrant B |
|---|---|---|---|
| Quadrant D | 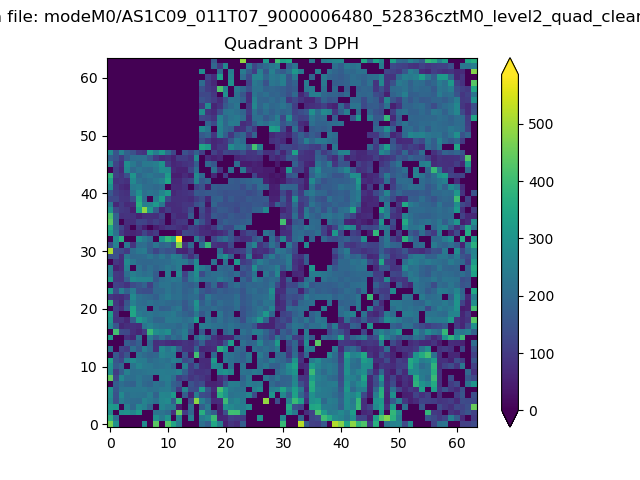 |
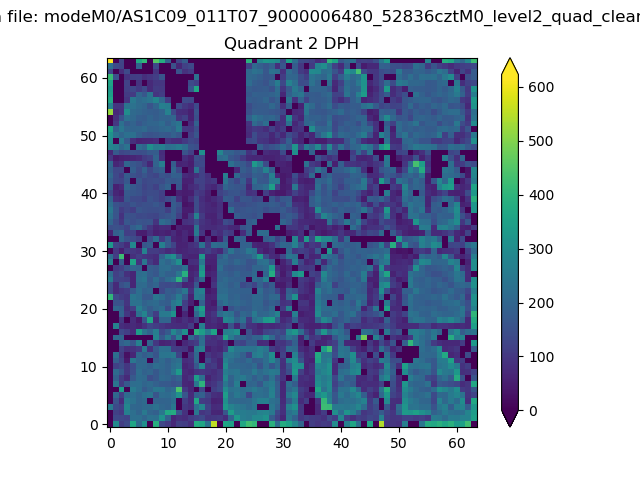 |
Quadrant C |
| Plot type | Count rate plots | Images |
|---|---|---|
| Comparison with Poisson distribution Blue bars denote a histogram of data divided into 1 sec bins. Red curve is a Poisson curve with rate = median count rate of data. |
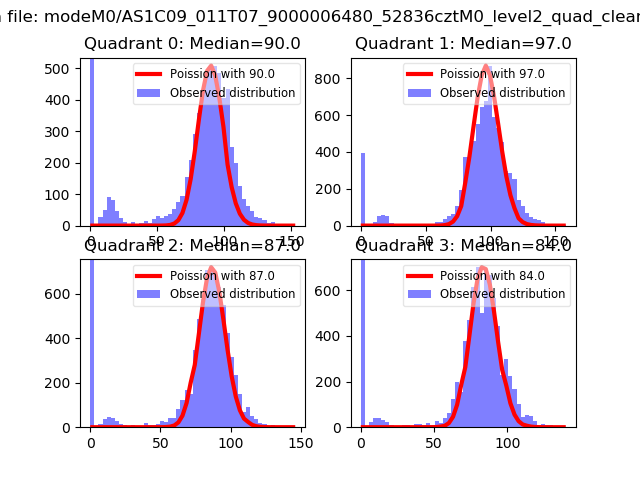 |
 |
| Quadrant-wise count rates Data is divided into 100 sec bins |
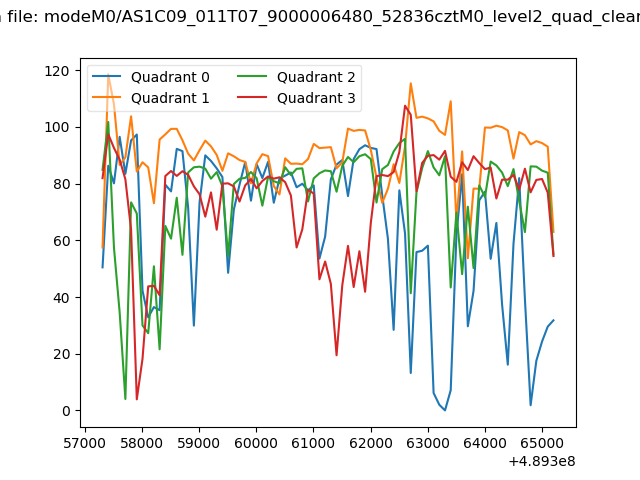 |
|
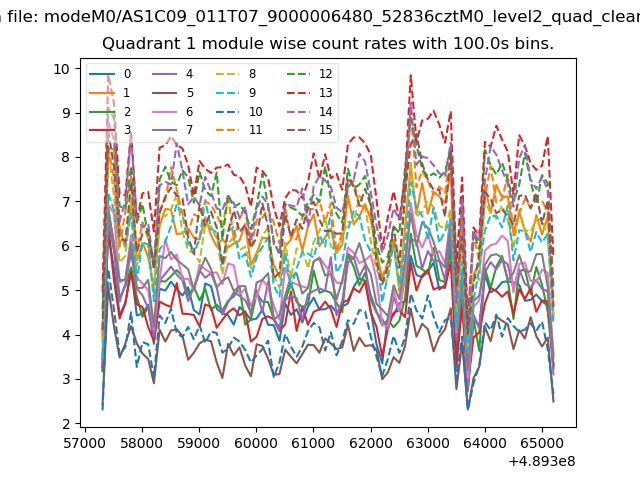
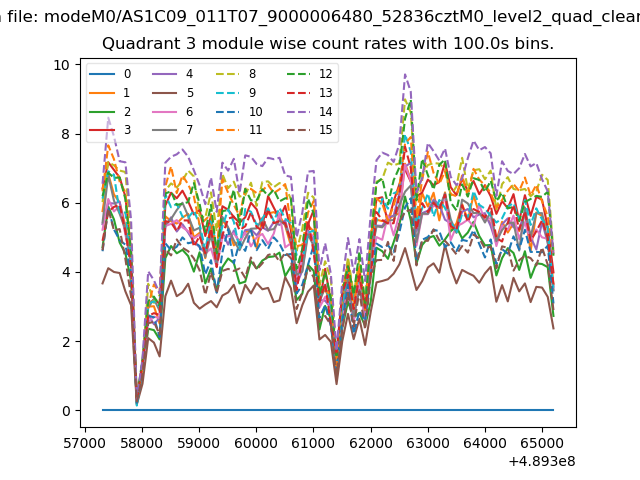
| Module-wise count rates for Quadrant A Data is divided into 100 sec bins |
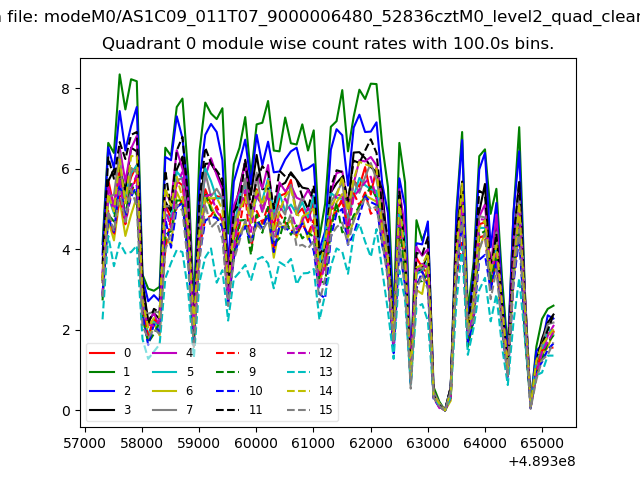 |
 |
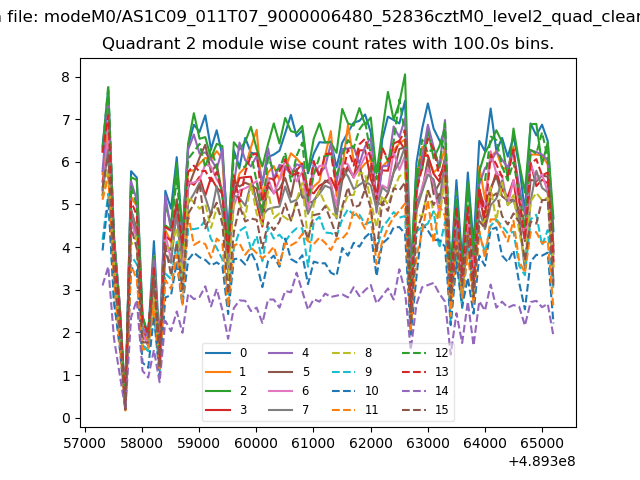
| Module-wise count rates for Quadrant B Data is divided into 100 sec bins |
 |
 |
| Module-wise count rates for Quadrant C Data is divided into 100 sec bins |
 |
 |
| Module-wise count rates for Quadrant D Data is divided into 100 sec bins |
 |
 |
| Parameter | Plot |
|---|---|
| CZT HV Monitor | 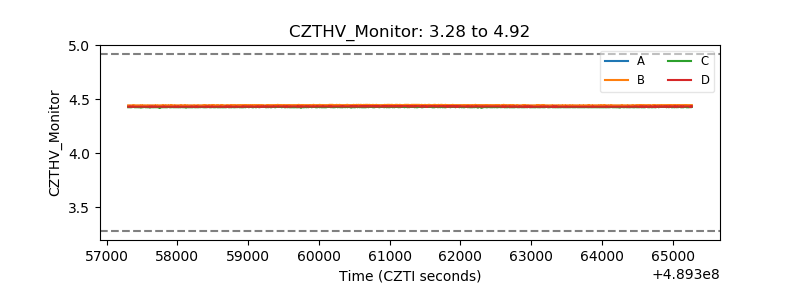 |
| D_VDD | 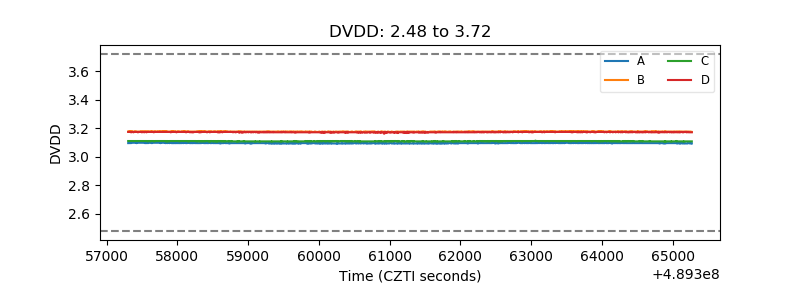 |
| Temperature 1 | 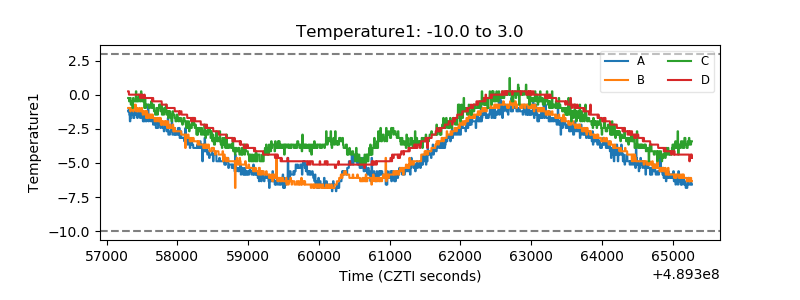 |
| Veto HV Monitor | 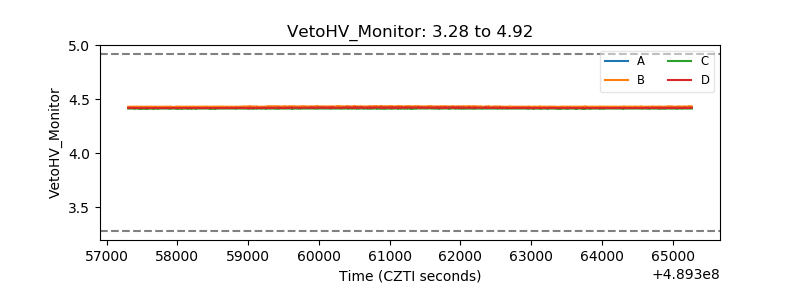 |
| Veto LLD | 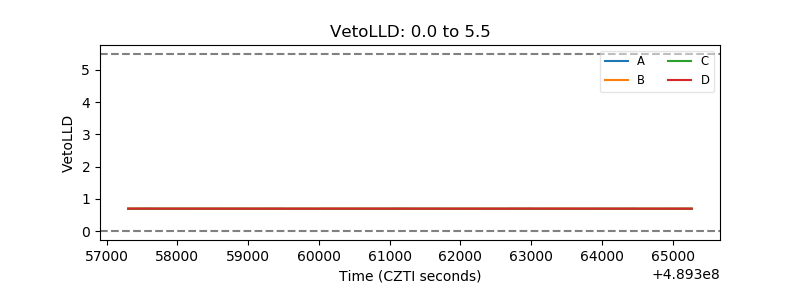 |
| Alpha Counter | 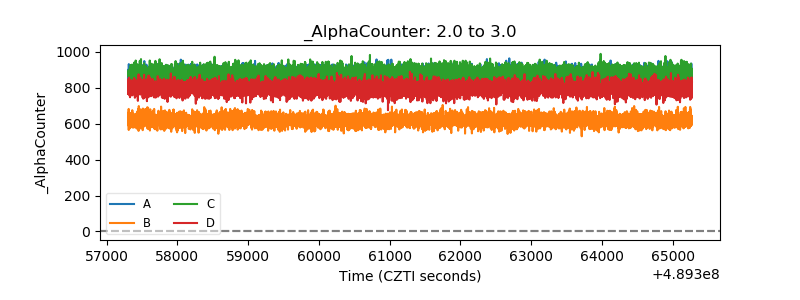 |
| _CPM_Rate | 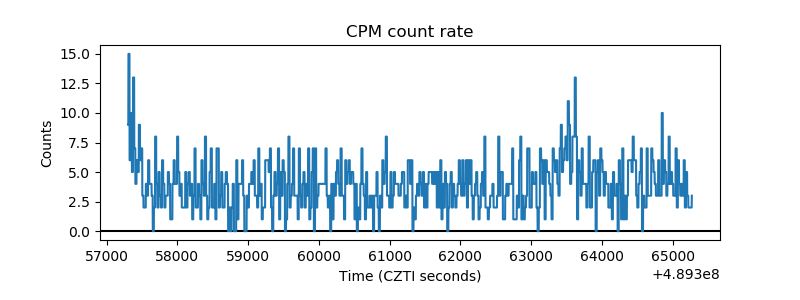 |
| CZT Counter | 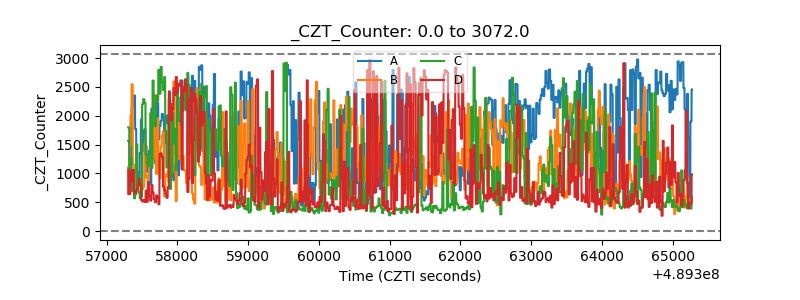 |
| +2.5 Volts monitor |  |
| +5 Volts monitor |  |
| _ROLL_ROT | 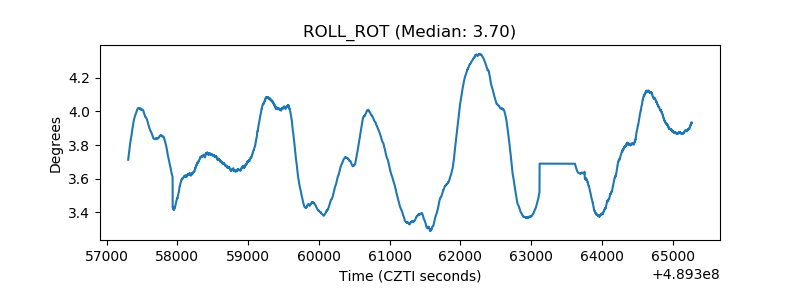 |
| _Roll_DEC | 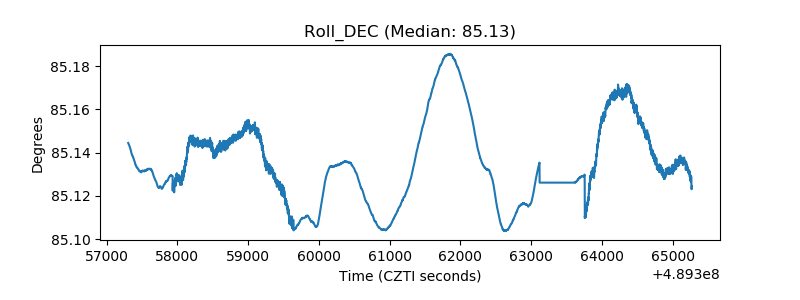 |
| _Roll_RA | 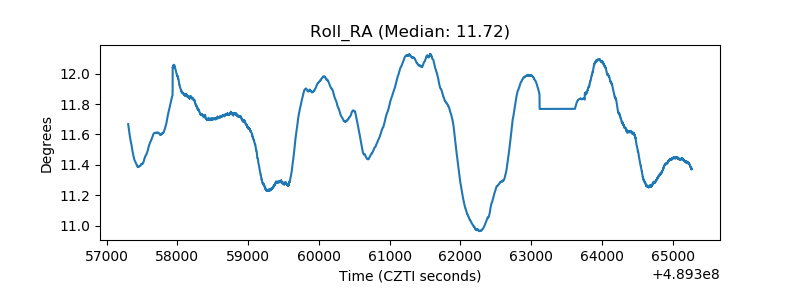 |
| Veto Counter | 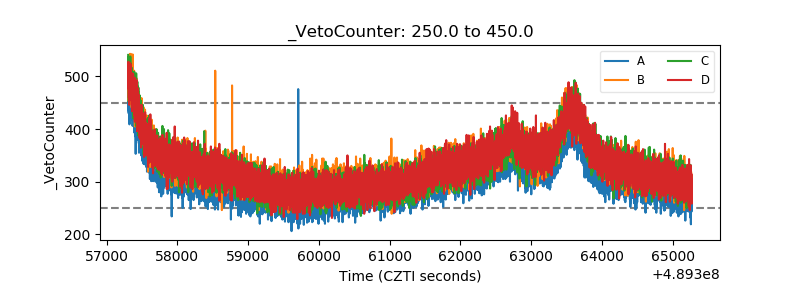 |