| Param | Original file | Final file |
|---|---|---|
| Filename | modeM0/AS1C09_011T07_9000006480_52841cztM0_level2.fits | modeM0/AS1C09_011T07_9000006480_52841cztM0_level2_quad_clean.evt |
| Size (bytes) | 870,644,160 | 73,681,920 |
| Size | 830.3 MB | 70.3 MB |
| Events in quadrant A | 7,789,791 | 509,457 |
| Events in quadrant B | 12,076,569 | 289,786 |
| Events in quadrant C | 3,651,297 | 555,009 |
| Events in quadrant D | 8,218,355 | 431,241 |
| Mode M9 | |||
|---|---|---|---|
| Quadrant | BADHDUFLAG | Total packets | Discarded packets |
| A | 0 | 8 | 0 |
| B | 0 | 8 | 0 |
| C | 0 | 8 | 0 |
| D | 0 | 8 | 0 |
| Mode SS | |||
|---|---|---|---|
| Quadrant | BADHDUFLAG | Total packets | Discarded packets |
| A | 0 | 132 | 0 |
| B | 0 | 132 | 0 |
| C | 0 | 132 | 0 |
| D | 0 | 132 | 0 |
| Mode M0 | |||
|---|---|---|---|
| Quadrant | BADHDUFLAG | Total packets | Discarded packets |
| A | 0 | 27649 | 1 |
| B | 0 | 40284 | 1 |
| C | 0 | 15753 | 1 |
| D | 0 | 28856 | 1 |
| Quadrant | Total seconds | Saturated seconds | Saturation percentage |
|---|---|---|---|
| A | 6369 | 1318 | 20.693986% |
| B | 6369 | 3850 | 60.449050% |
| C | 6368 | 310 | 4.868090% |
| D | 6368 | 1674 | 26.287688% |
Noise dominated data is calculated using 1-second bins in cleaned event files. If a bin has >2000 counts, and if more than 50% of those come from <1% of pixels, then it is considered to be noise-dominated and hence unusable.
| Quadrant | # 1 sec bins | Bins with >0 counts | Bins with >2000 counts | High rate bins dominated by noise | Noise dominated (total time) | Noise dominated (detector-on time) | Marked lightcurve |
|---|---|---|---|---|---|---|---|
| A | 7254 | 6370 | 1158 | 1158 | 15.96% | 18.18% | 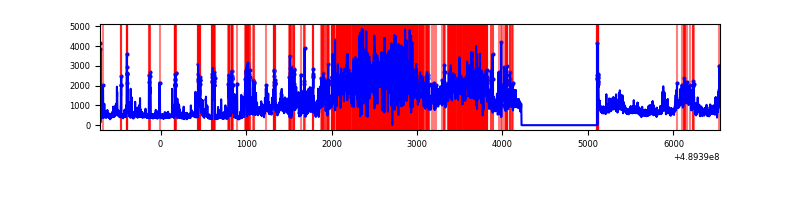 |
| B | 7254 | 6370 | 3135 | 3135 | 43.22% | 49.22% | 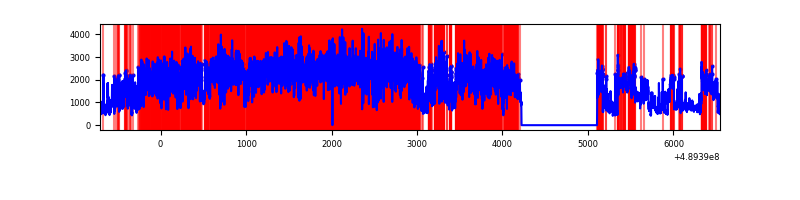 |
| C | 7253 | 6369 | 204 | 204 | 2.81% | 3.20% | 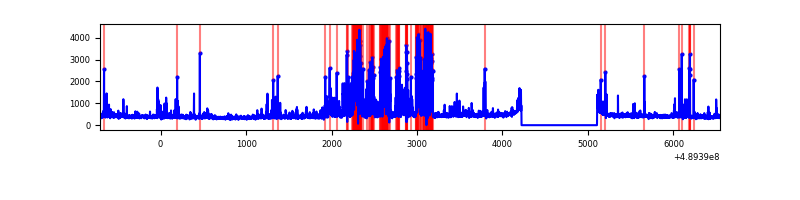 |
| D | 7253 | 6369 | 1538 | 1538 | 21.21% | 24.15% | 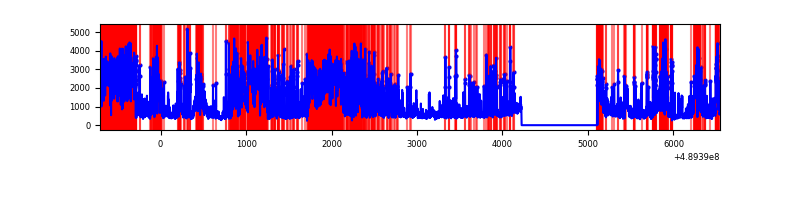 |
Top three noisy pixels from each quadrant. If the there are fewer than three noisy pixels in the level2.evt file, extra rows are filled as -1
| Pixel properties | Quadrant properties | ||||||
|---|---|---|---|---|---|---|---|
| Quadrant | DetID | PixID | Counts | Sigma | Mean | Median | Sigma |
| A | 9 | 191 | 3512540 | 22353.8 | 618 | 601 | 157.1 |
| A | 5 | 243 | 676128 | 4299.79 | 618 | 601 | 157.1 |
| A | 4 | 238 | 346595 | 2202.28 | 618 | 601 | 157.1 |
| B | 8 | 3 | 8723931 | 80818.06 | 502 | 487 | 107.9 |
| B | 5 | 172 | 968972 | 8972.5 | 502 | 487 | 107.9 |
| B | 5 | 185 | 138914 | 1282.45 | 502 | 487 | 107.9 |
| C | 15 | 224 | 862242 | 4965.96 | 626 | 620 | 173.5 |
| C | 12 | 249 | 119678 | 686.19 | 626 | 620 | 173.5 |
| C | 14 | 254 | 45211 | 257.0 | 626 | 620 | 173.5 |
| D | 8 | 176 | 3288263 | 20361.96 | 559 | 533 | 161.5 |
| D | 11 | 176 | 723608 | 4478.23 | 559 | 533 | 161.5 |
| D | 10 | 172 | 681068 | 4214.77 | 559 | 533 | 161.5 |
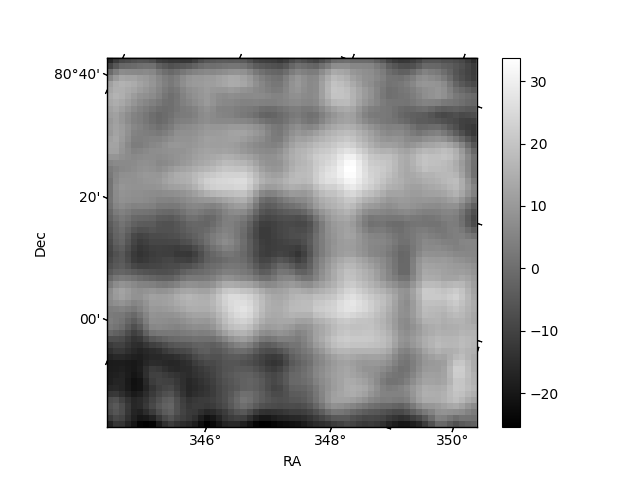
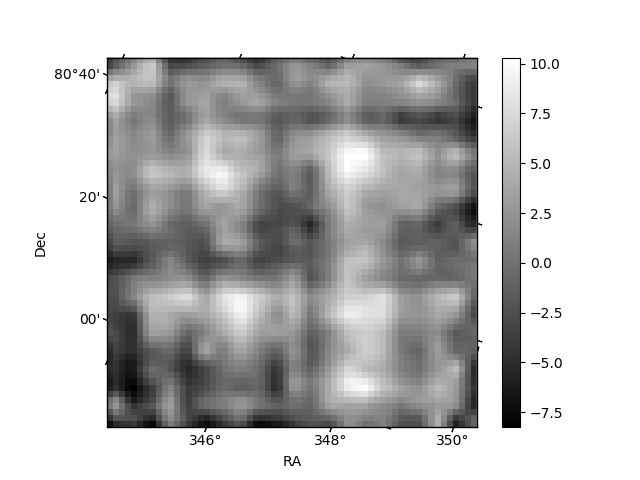
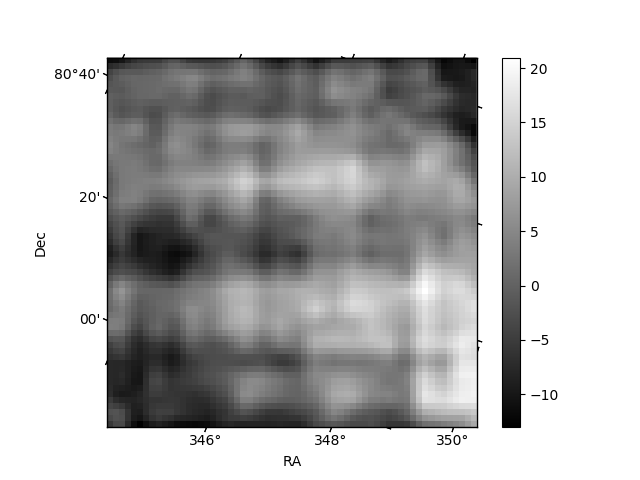
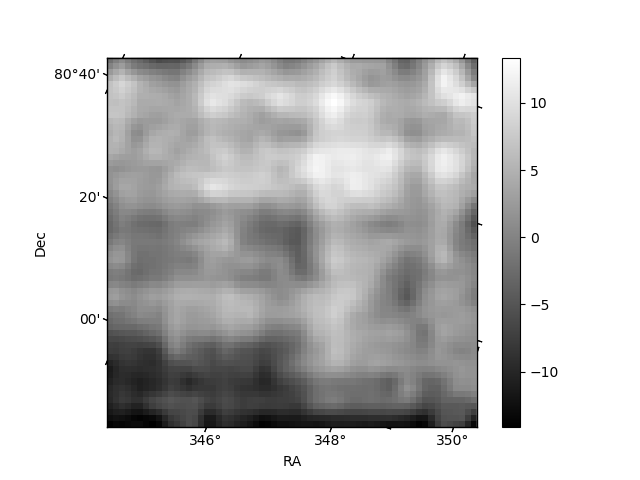
Histogram calculated using DETX and DETY for each event in the final _common_clean file
| Quadrant A | 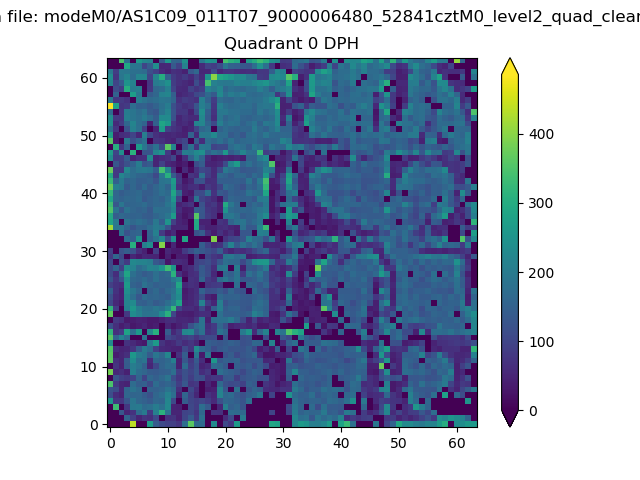 |
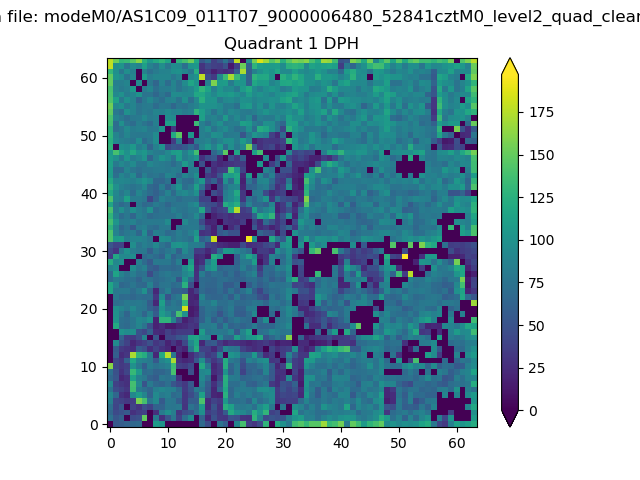 |
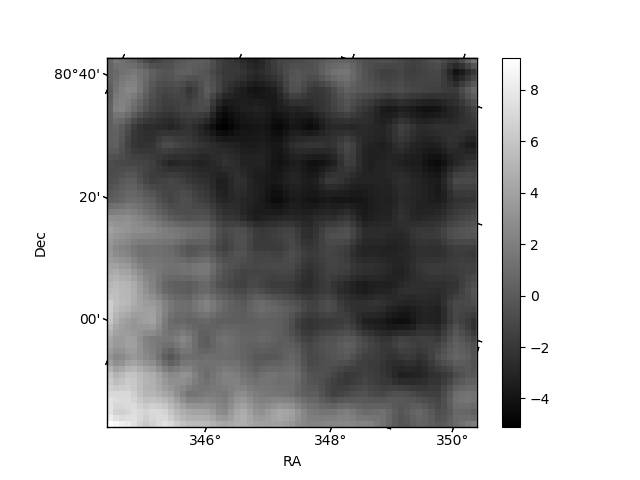
Quadrant B |
|---|---|---|---|
| Quadrant D | 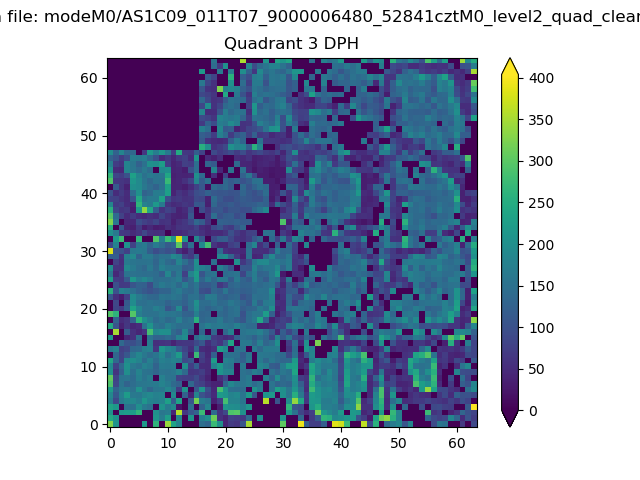 |
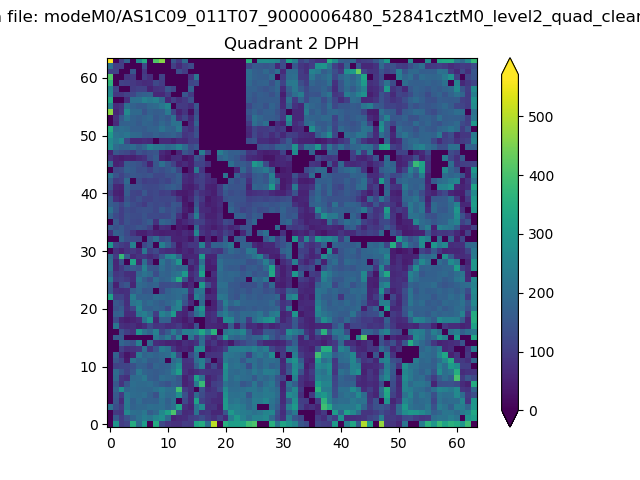 |
Quadrant C |
| Plot type | Count rate plots | Images |
|---|---|---|
| Comparison with Poisson distribution Blue bars denote a histogram of data divided into 1 sec bins. Red curve is a Poisson curve with rate = median count rate of data. |
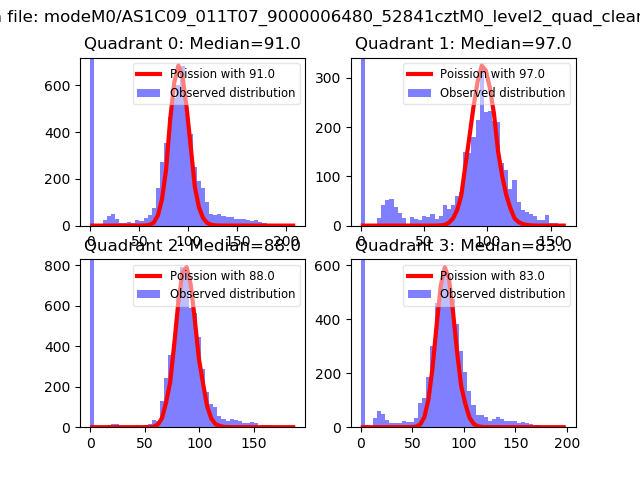 |
 |
| Quadrant-wise count rates Data is divided into 100 sec bins |
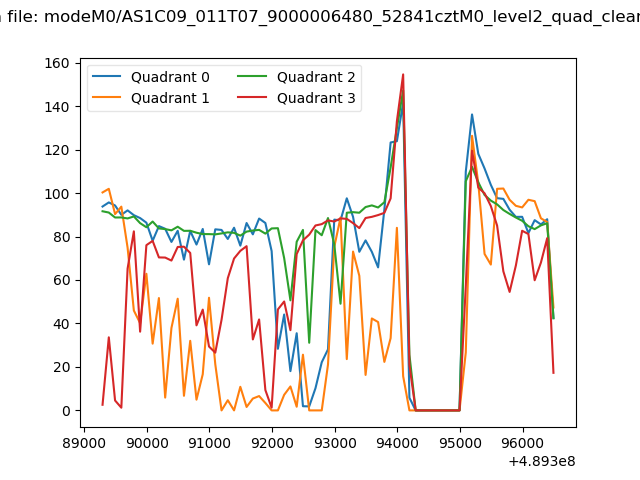 |
|
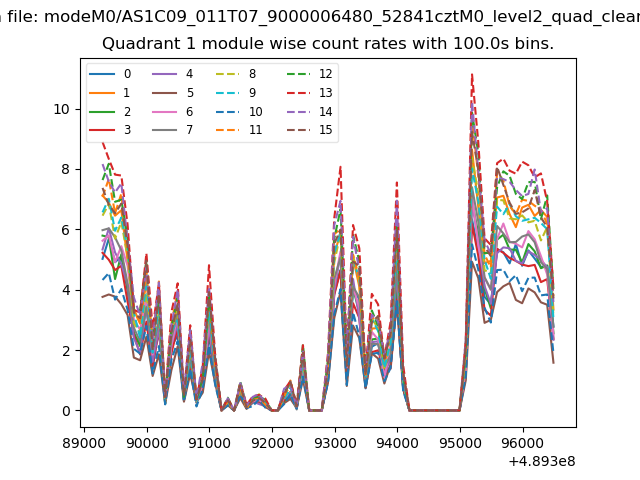
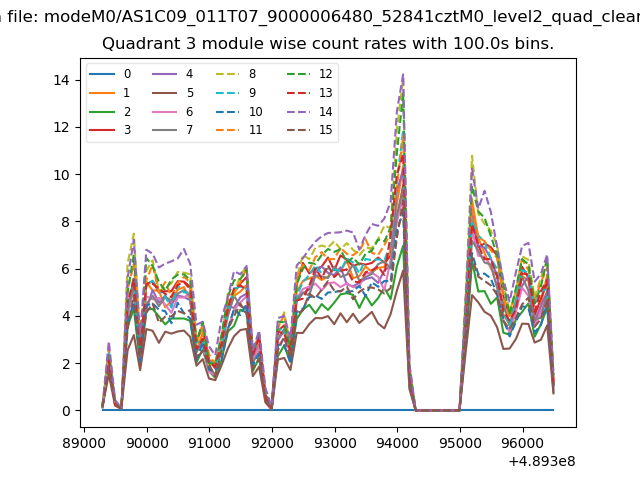
| Module-wise count rates for Quadrant A Data is divided into 100 sec bins |
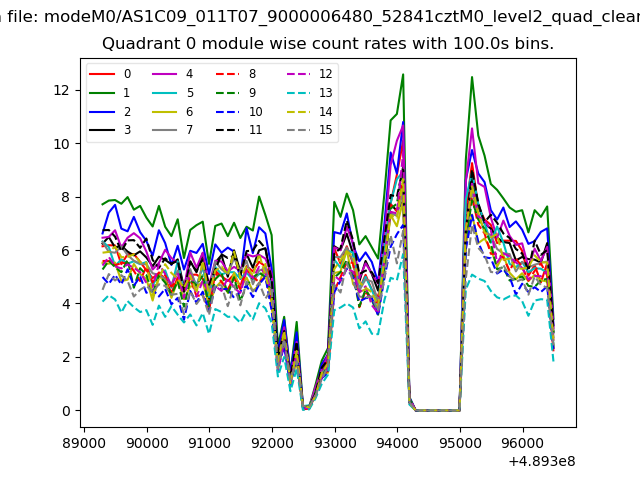 |
 |
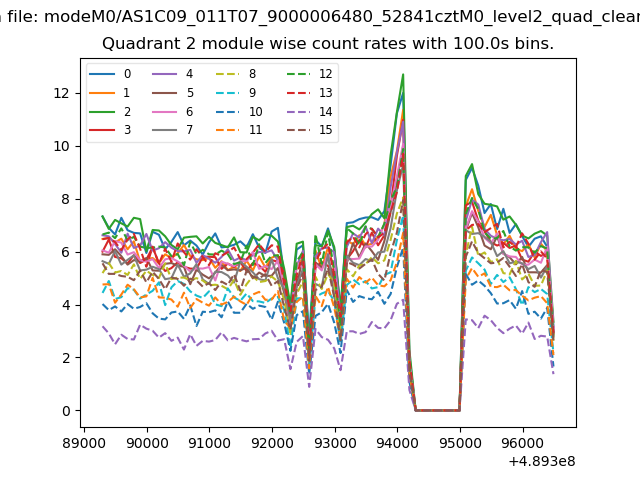
| Module-wise count rates for Quadrant B Data is divided into 100 sec bins |
 |
 |
| Module-wise count rates for Quadrant C Data is divided into 100 sec bins |
 |
 |
| Module-wise count rates for Quadrant D Data is divided into 100 sec bins |
 |
 |
| Parameter | Plot |
|---|---|
| CZT HV Monitor | 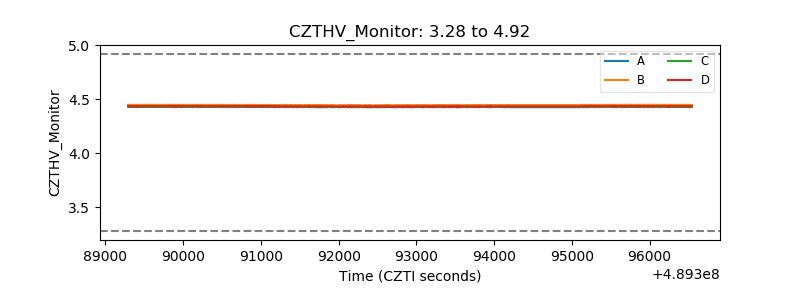 |
| D_VDD | 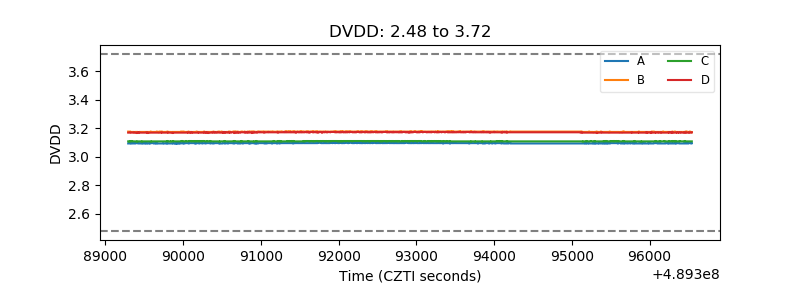 |
| Temperature 1 | 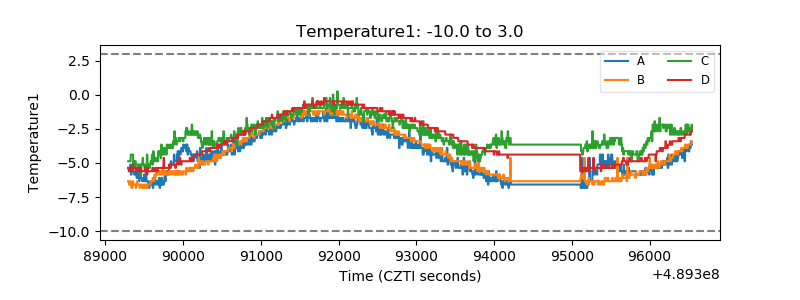 |
| Veto HV Monitor | 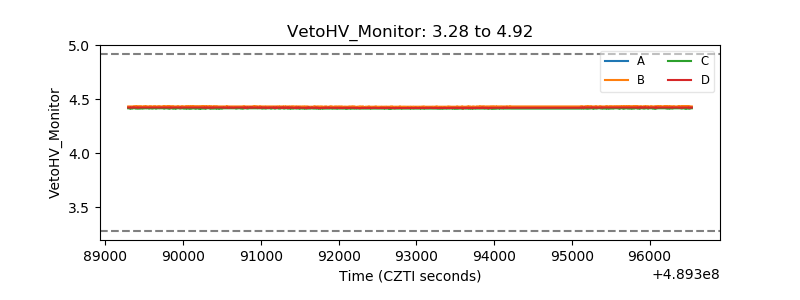 |
| Veto LLD | 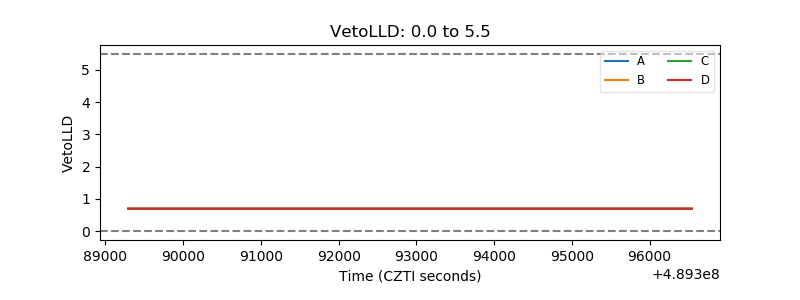 |
| Alpha Counter | 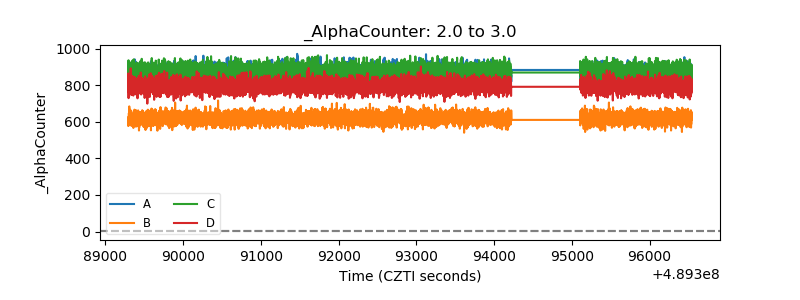 |
| _CPM_Rate | 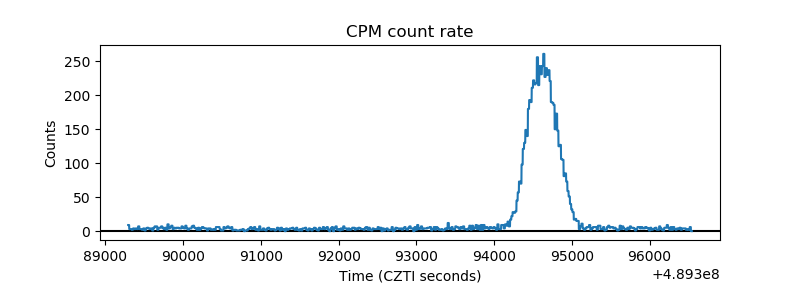 |
| CZT Counter | 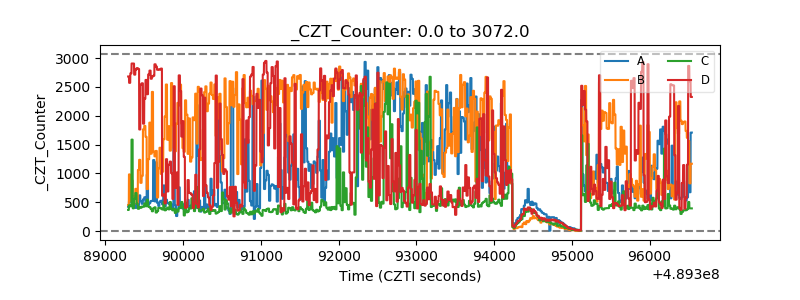 |
| +2.5 Volts monitor |  |
| +5 Volts monitor | 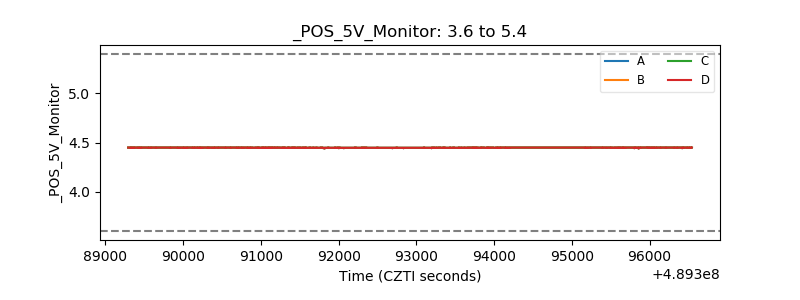 |
| _ROLL_ROT | 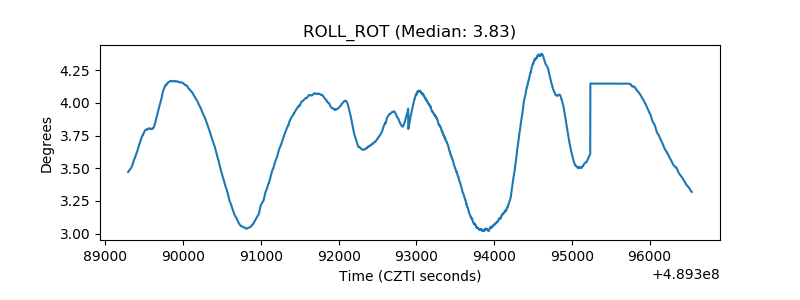 |
| _Roll_DEC | 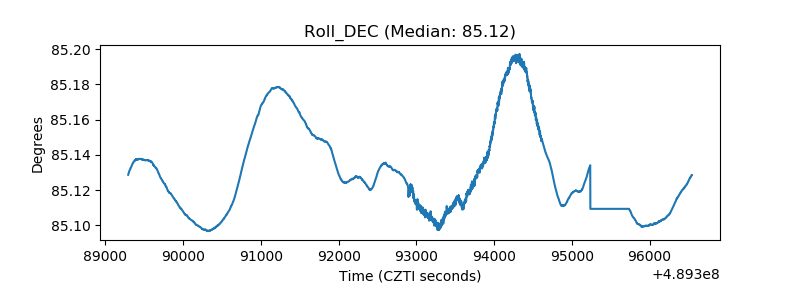 |
| _Roll_RA | 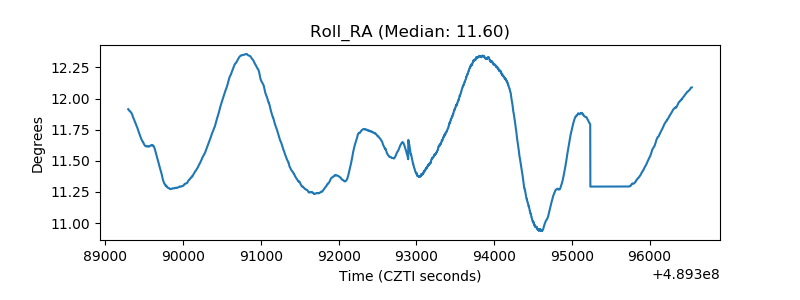 |
| Veto Counter | 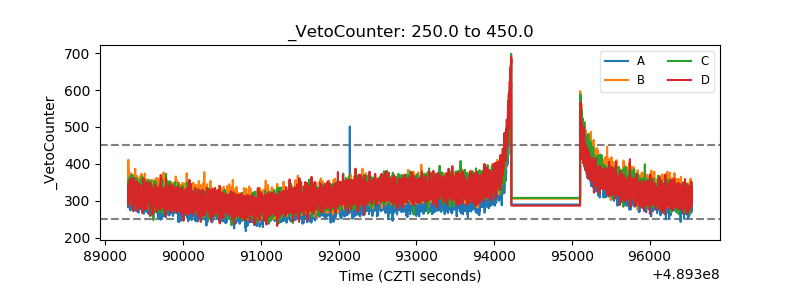 |