| Param | Original file | Final file |
|---|---|---|
| Filename | modeM0/AS1C09_011T07_9000006480_52851cztM0_level2.fits | modeM0/AS1C09_011T07_9000006480_52851cztM0_level2_quad_clean.evt |
| Size (bytes) | 1,247,636,160 | 84,936,960 |
| Size | 1.2 GB | 81.0 MB |
| Events in quadrant A | 8,146,310 | 671,875 |
| Events in quadrant B | 10,950,230 | 563,804 |
| Events in quadrant C | 7,896,356 | 586,122 |
| Events in quadrant D | 18,564,678 | 185,352 |
| Mode SS | |||
|---|---|---|---|
| Quadrant | BADHDUFLAG | Total packets | Discarded packets |
| A | 0 | 162 | 0 |
| B | 0 | 162 | 0 |
| C | 0 | 162 | 0 |
| D | 0 | 162 | 0 |
| Mode M0 | |||
|---|---|---|---|
| Quadrant | BADHDUFLAG | Total packets | Discarded packets |
| A | 0 | 29876 | 0 |
| B | 0 | 38143 | 0 |
| C | 0 | 29533 | 0 |
| D | 0 | 60620 | 7 |
| Quadrant | Total seconds | Saturated seconds | Saturation percentage |
|---|---|---|---|
| A | 8114 | 1332 | 16.416071% |
| B | 8115 | 2677 | 32.988293% |
| C | 8115 | 1644 | 20.258780% |
| D | 8114 | 6324 | 77.939364% |
Noise dominated data is calculated using 1-second bins in cleaned event files. If a bin has >2000 counts, and if more than 50% of those come from <1% of pixels, then it is considered to be noise-dominated and hence unusable.
| Quadrant | # 1 sec bins | Bins with >0 counts | Bins with >2000 counts | High rate bins dominated by noise | Noise dominated (total time) | Noise dominated (detector-on time) | Marked lightcurve |
|---|---|---|---|---|---|---|---|
| A | 8113 | 8113 | 1202 | 1202 | 14.82% | 14.82% | 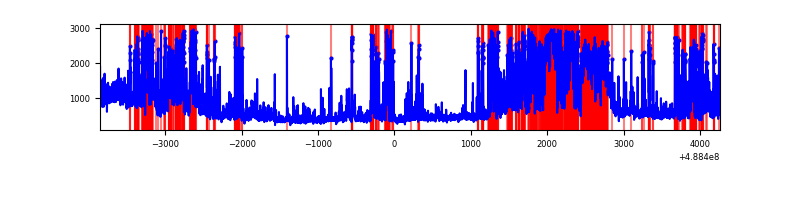 |
| B | 8114 | 8114 | 2285 | 2285 | 28.16% | 28.16% | 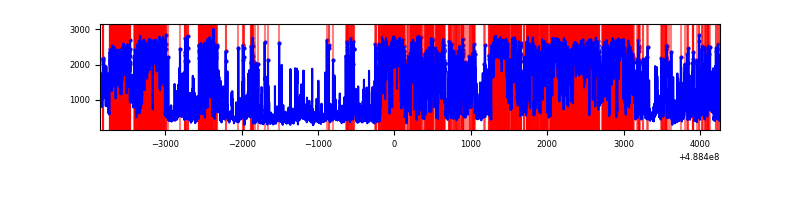 |
| C | 8114 | 8114 | 1391 | 1391 | 17.14% | 17.14% | 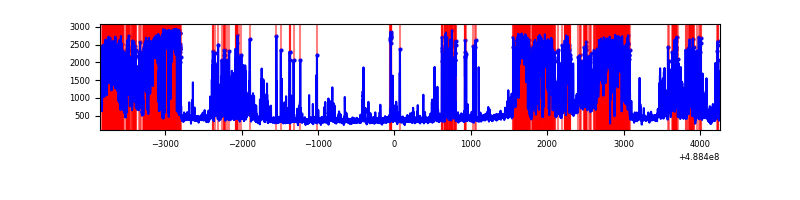 |
| D | 8113 | 8113 | 6261 | 6261 | 77.17% | 77.17% | 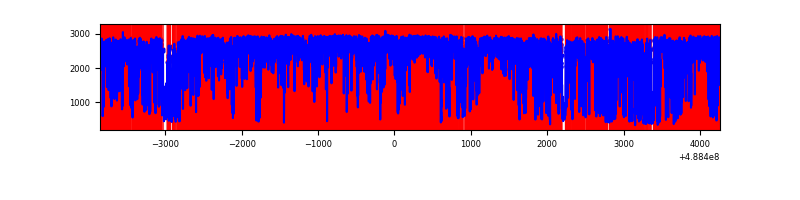 |
Top three noisy pixels from each quadrant. If the there are fewer than three noisy pixels in the level2.evt file, extra rows are filled as -1
| Pixel properties | Quadrant properties | ||||||
|---|---|---|---|---|---|---|---|
| Quadrant | DetID | PixID | Counts | Sigma | Mean | Median | Sigma |
| A | 3 | 62 | 1734292 | 8772.4 | 792 | 774 | 197.6 |
| A | 9 | 191 | 753690 | 3810.1 | 792 | 774 | 197.6 |
| A | 0 | 12 | 654330 | 3307.3 | 792 | 774 | 197.6 |
| B | 8 | 3 | 6879243 | 44325.61 | 731 | 707 | 155.2 |
| B | 10 | 254 | 282817 | 1817.93 | 731 | 707 | 155.2 |
| B | 1 | 223 | 173663 | 1114.54 | 731 | 707 | 155.2 |
| C | 15 | 224 | 3484677 | 16765.13 | 748 | 742 | 207.8 |
| C | 2 | 12 | 689305 | 3313.45 | 748 | 742 | 207.8 |
| C | 7 | 80 | 237384 | 1138.75 | 748 | 742 | 207.8 |
| D | 12 | 2 | 14921406 | 120373.07 | 418 | 398 | 124.0 |
| D | 8 | 176 | 759062 | 6120.41 | 418 | 398 | 124.0 |
| D | 11 | 176 | 338078 | 2724.18 | 418 | 398 | 124.0 |
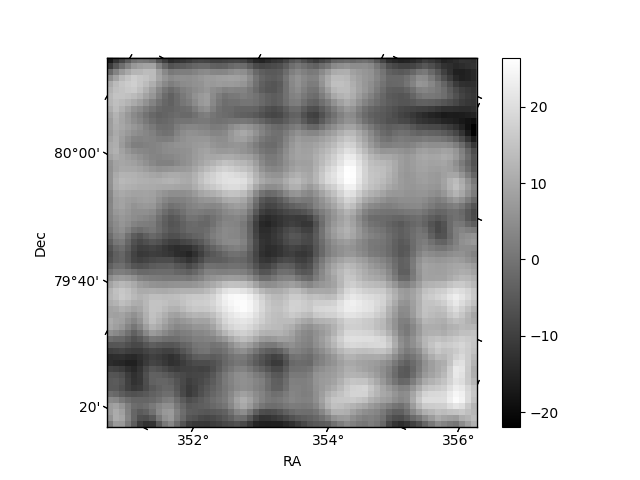
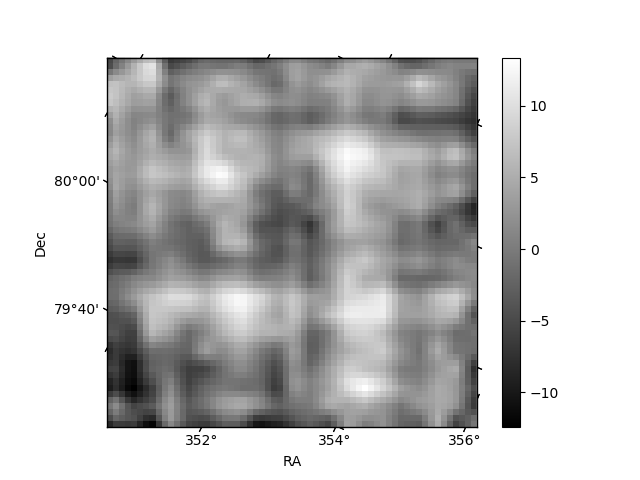
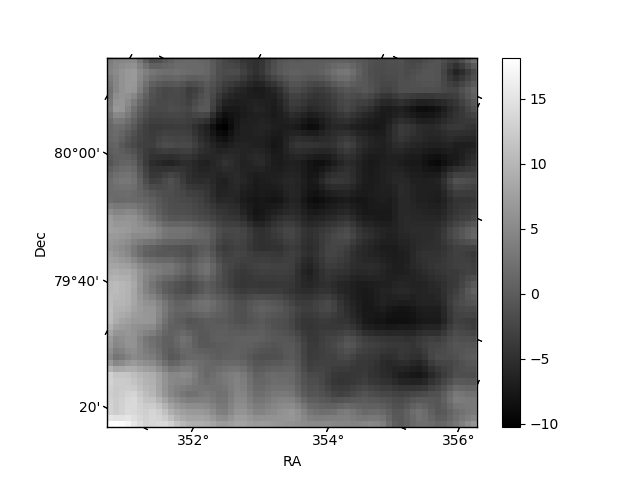
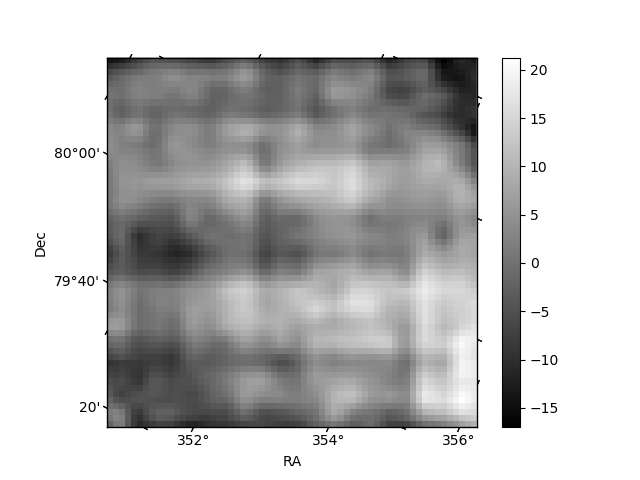
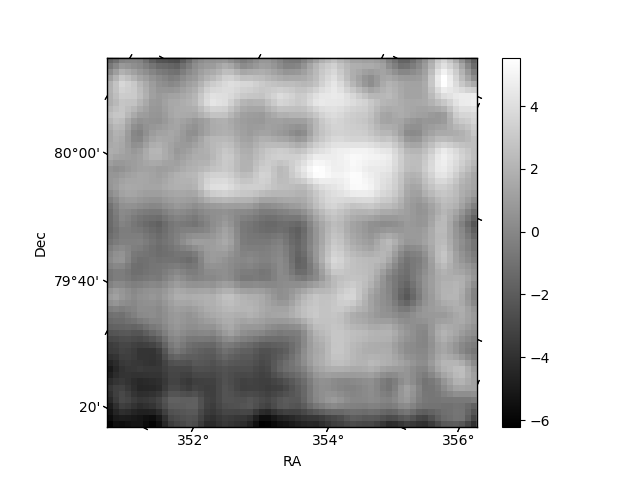
Histogram calculated using DETX and DETY for each event in the final _common_clean file
| Quadrant A | 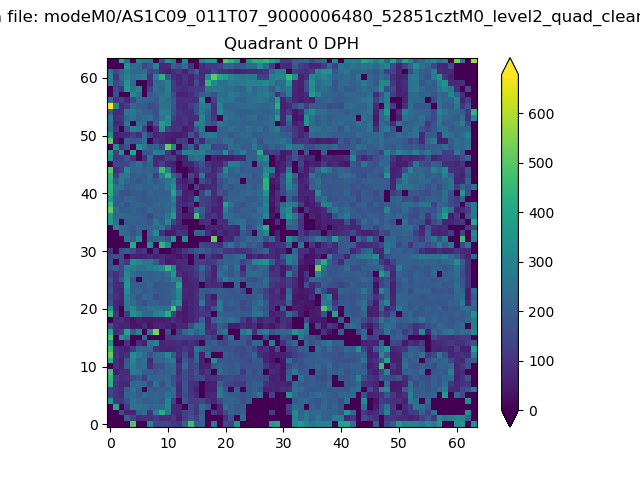 |
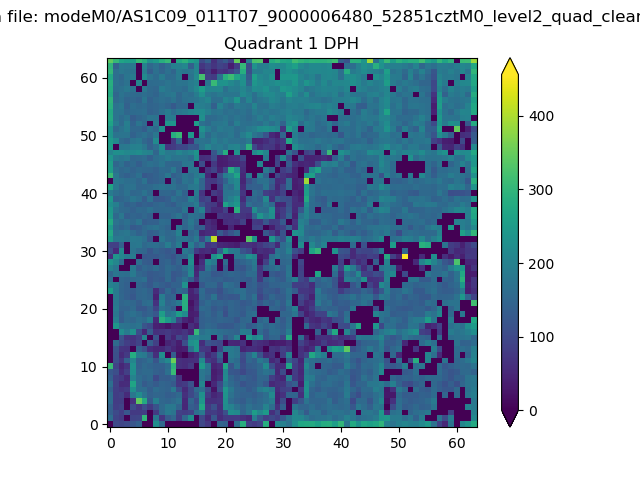 |
Quadrant B |
|---|---|---|---|
| Quadrant D | 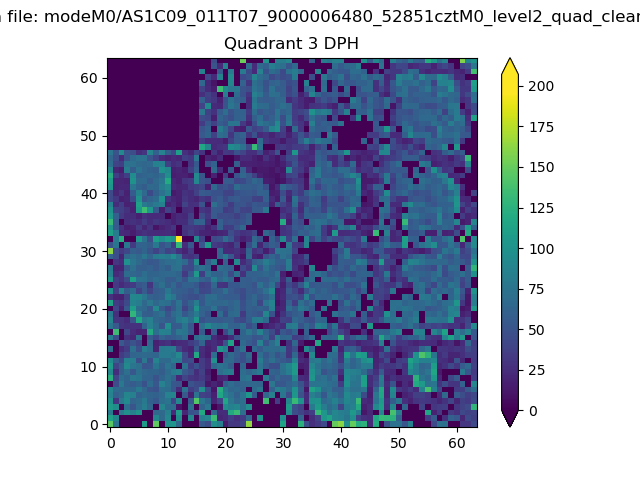 |
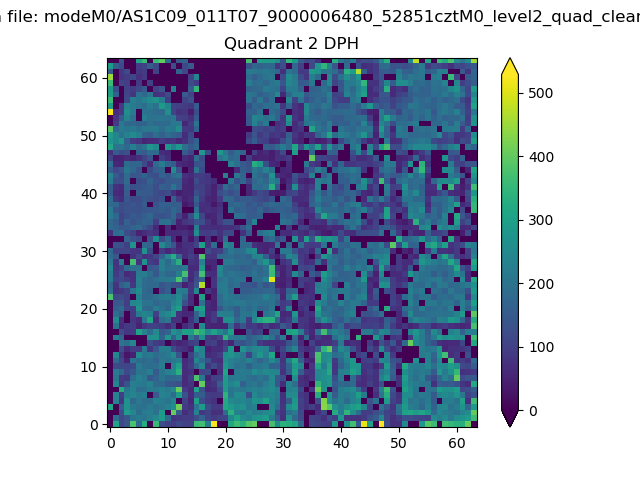 |
Quadrant C |
| Plot type | Count rate plots | Images |
|---|---|---|
| Comparison with Poisson distribution Blue bars denote a histogram of data divided into 1 sec bins. Red curve is a Poisson curve with rate = median count rate of data. |
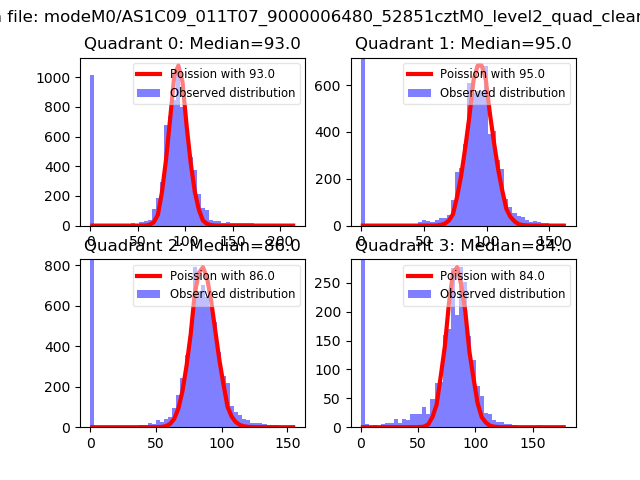 |
 |
| Quadrant-wise count rates Data is divided into 100 sec bins |
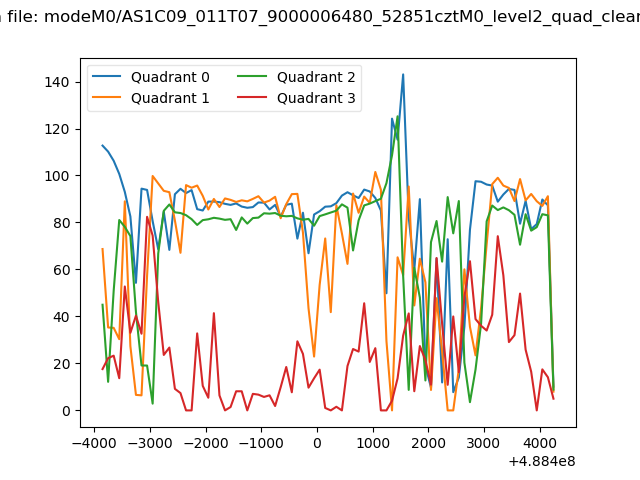 |
|
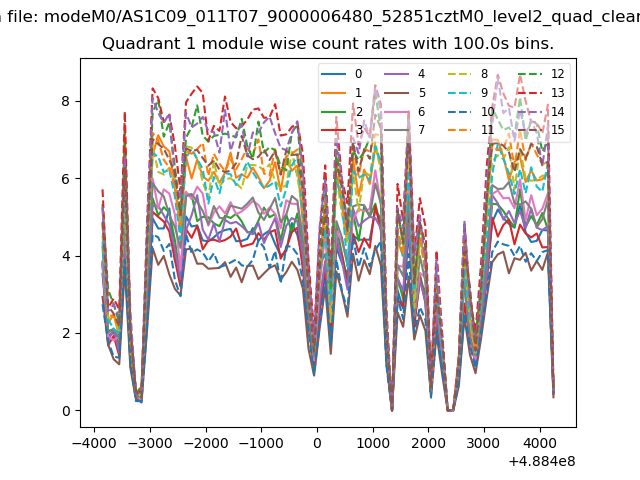
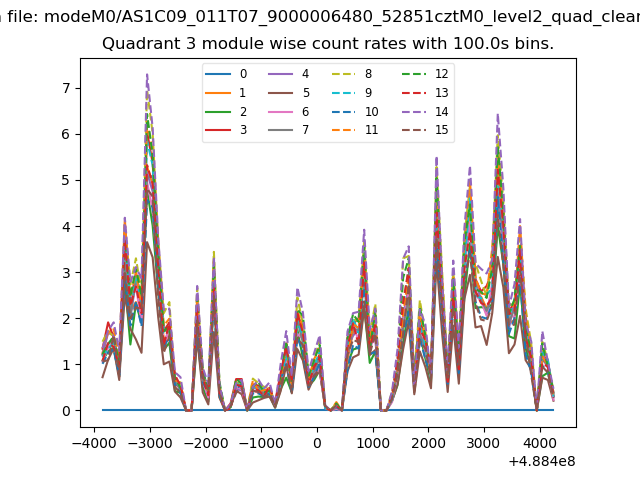
| Module-wise count rates for Quadrant A Data is divided into 100 sec bins |
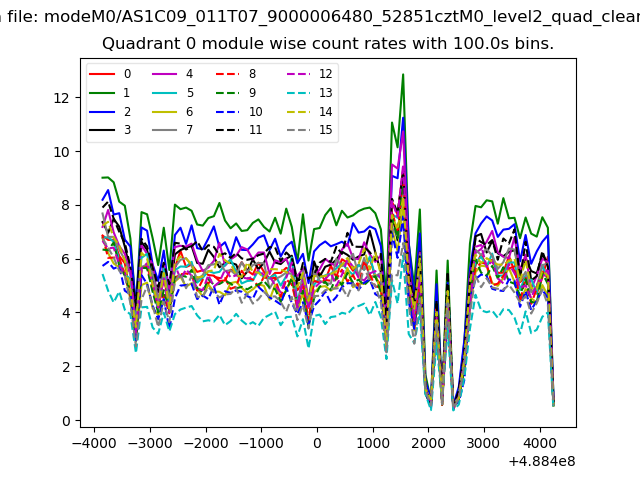 |
 |
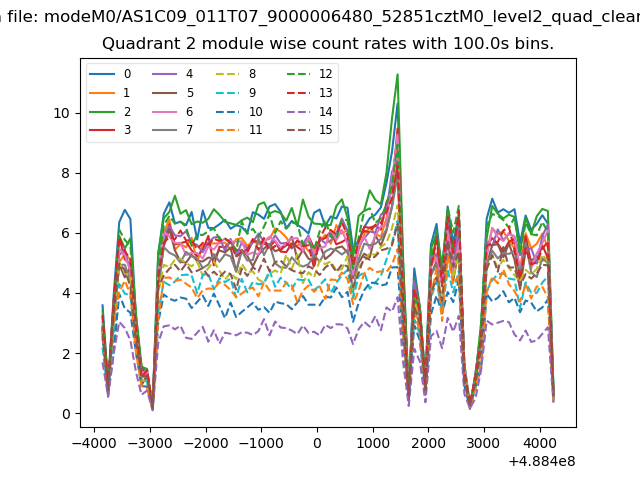
| Module-wise count rates for Quadrant B Data is divided into 100 sec bins |
 |
 |
| Module-wise count rates for Quadrant C Data is divided into 100 sec bins |
 |
 |
| Module-wise count rates for Quadrant D Data is divided into 100 sec bins |
 |
 |
| Parameter | Plot |
|---|---|
| CZT HV Monitor | 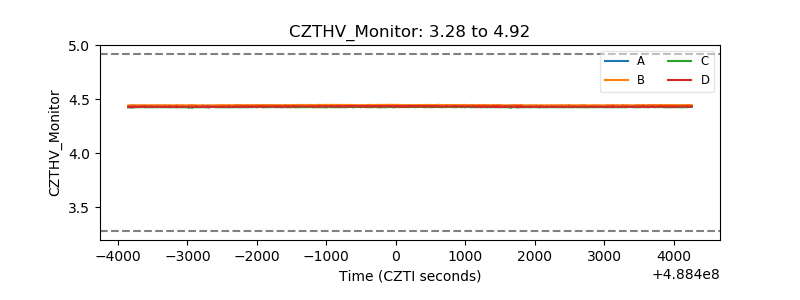 |
| D_VDD | 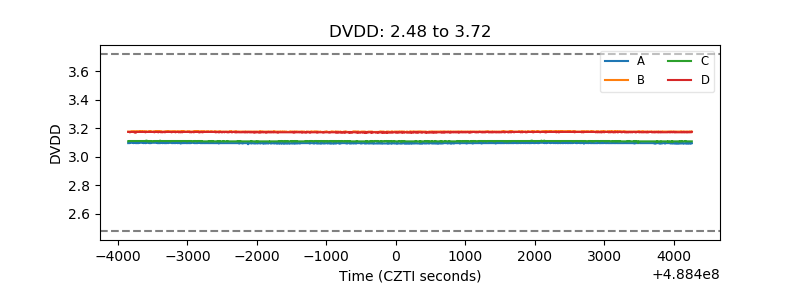 |
| Temperature 1 | 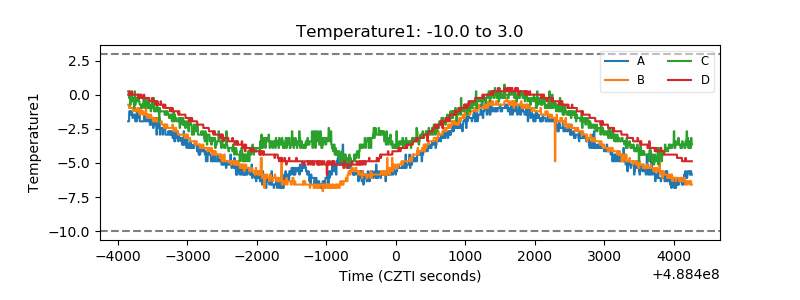 |
| Veto HV Monitor | 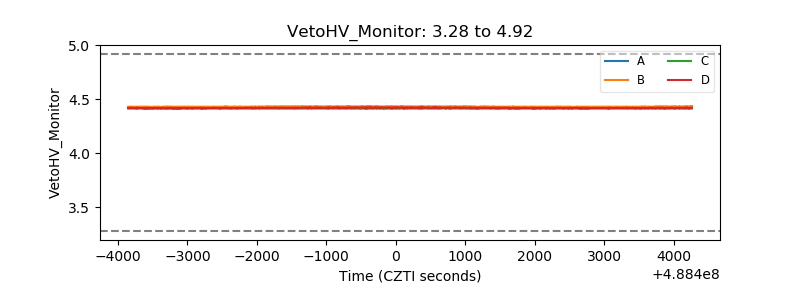 |
| Veto LLD | 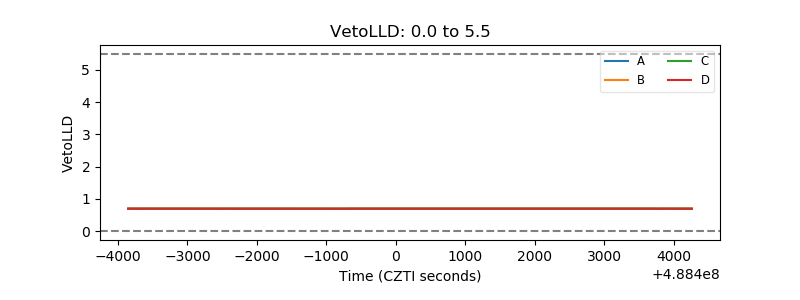 |
| Alpha Counter | 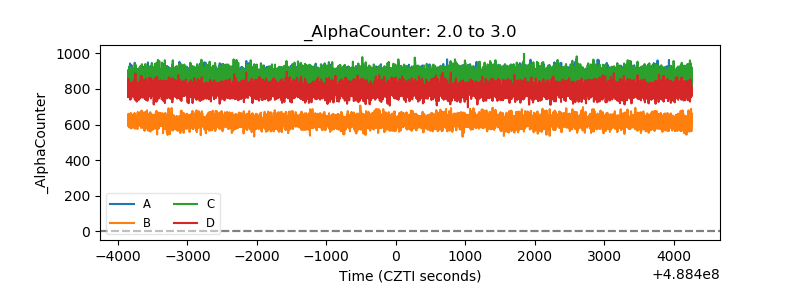 |
| _CPM_Rate | 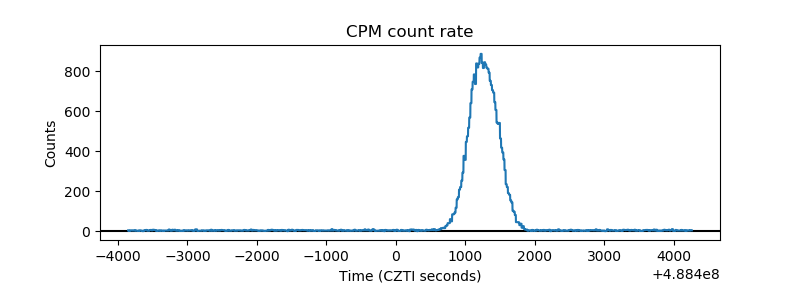 |
| CZT Counter | 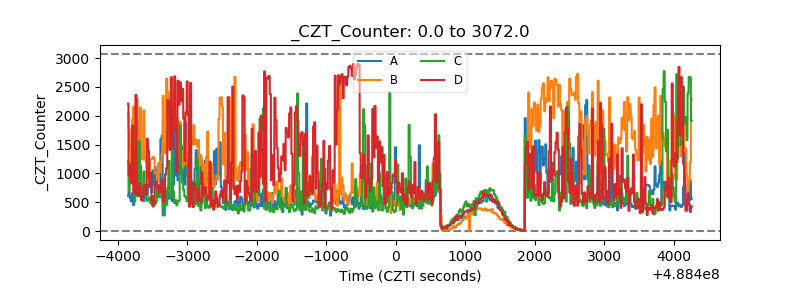 |
| +2.5 Volts monitor |  |
| +5 Volts monitor | 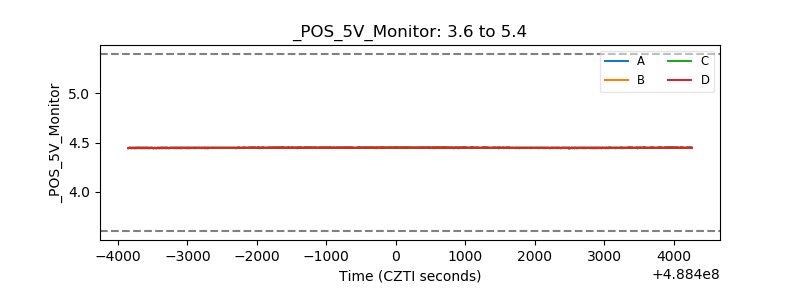 |
| _ROLL_ROT | 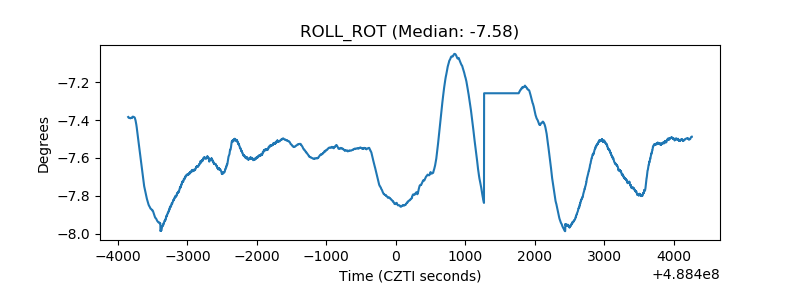 |
| _Roll_DEC | 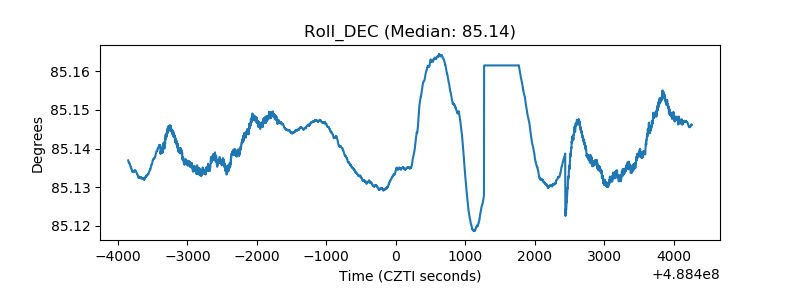 |
| _Roll_RA | 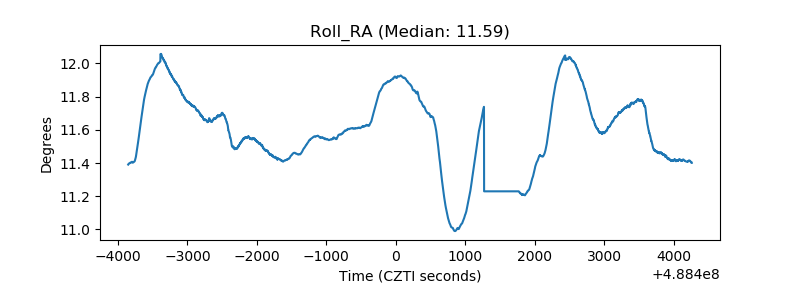 |
| Veto Counter | 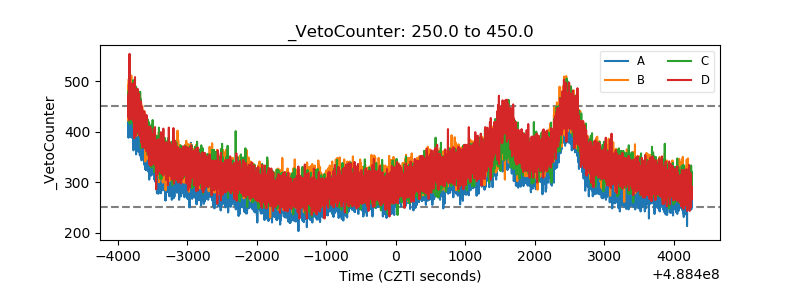 |