| Param | Original file | Final file |
|---|---|---|
| Filename | modeM0/AS1C09_011T07_9000006480_52860cztM0_level2.fits | modeM0/AS1C09_011T07_9000006480_52860cztM0_level2_quad_clean.evt |
| Size (bytes) | 851,716,800 | 80,939,520 |
| Size | 812.3 MB | 77.2 MB |
| Events in quadrant A | 9,903,519 | 451,991 |
| Events in quadrant B | 10,092,570 | 469,558 |
| Events in quadrant C | 4,606,672 | 559,427 |
| Events in quadrant D | 6,428,746 | 521,342 |
| Mode M9 | |||
|---|---|---|---|
| Quadrant | BADHDUFLAG | Total packets | Discarded packets |
| A | 0 | 12 | 0 |
| B | 0 | 12 | 0 |
| C | 0 | 12 | 0 |
| D | 0 | 12 | 0 |
| Mode SS | |||
|---|---|---|---|
| Quadrant | BADHDUFLAG | Total packets | Discarded packets |
| A | 0 | 128 | 0 |
| B | 0 | 128 | 0 |
| C | 0 | 128 | 0 |
| D | 0 | 128 | 0 |
| Mode M0 | |||
|---|---|---|---|
| Quadrant | BADHDUFLAG | Total packets | Discarded packets |
| A | 0 | 33802 | 1 |
| B | 0 | 34465 | 1 |
| C | 0 | 18248 | 1 |
| D | 0 | 23533 | 1 |
| Quadrant | Total seconds | Saturated seconds | Saturation percentage |
|---|---|---|---|
| A | 6427 | 2345 | 36.486697% |
| B | 6428 | 2447 | 38.067828% |
| C | 6428 | 575 | 8.945240% |
| D | 6427 | 834 | 12.976505% |
Noise dominated data is calculated using 1-second bins in cleaned event files. If a bin has >2000 counts, and if more than 50% of those come from <1% of pixels, then it is considered to be noise-dominated and hence unusable.
| Quadrant | # 1 sec bins | Bins with >0 counts | Bins with >2000 counts | High rate bins dominated by noise | Noise dominated (total time) | Noise dominated (detector-on time) | Marked lightcurve |
|---|---|---|---|---|---|---|---|
| A | 7592 | 6428 | 2222 | 2222 | 29.27% | 34.57% | 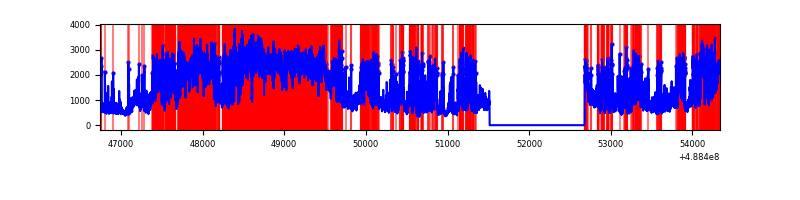 |
| B | 7593 | 6429 | 2202 | 2202 | 29.00% | 34.25% | 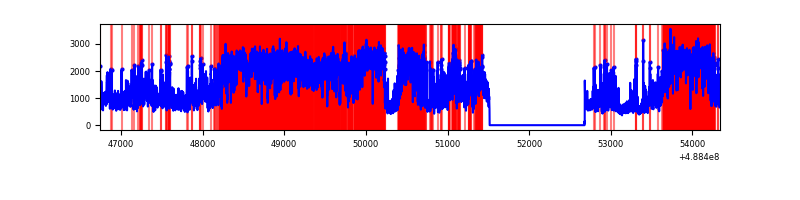 |
| C | 7593 | 6429 | 468 | 468 | 6.16% | 7.28% | 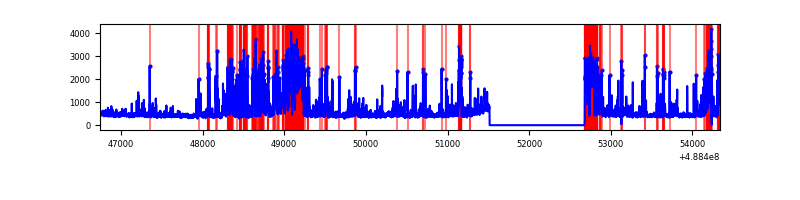 |
| D | 7592 | 6428 | 751 | 751 | 9.89% | 11.68% | 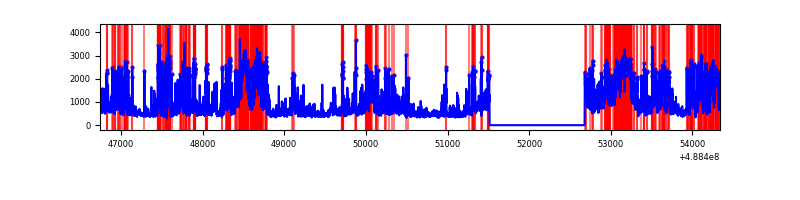 |
Top three noisy pixels from each quadrant. If the there are fewer than three noisy pixels in the level2.evt file, extra rows are filled as -1
| Pixel properties | Quadrant properties | ||||||
|---|---|---|---|---|---|---|---|
| Quadrant | DetID | PixID | Counts | Sigma | Mean | Median | Sigma |
| A | 9 | 191 | 4217828 | 27757.76 | 608 | 594 | 151.9 |
| A | 3 | 62 | 2311241 | 15208.64 | 608 | 594 | 151.9 |
| A | 15 | 174 | 367282 | 2413.53 | 608 | 594 | 151.9 |
| B | 8 | 3 | 7002830 | 55565.06 | 604 | 585 | 126.0 |
| B | 0 | 213 | 213451 | 1689.16 | 604 | 585 | 126.0 |
| B | 4 | 81 | 89874 | 708.54 | 604 | 585 | 126.0 |
| C | 15 | 224 | 1164089 | 6534.05 | 642 | 635 | 178.1 |
| C | 7 | 80 | 297674 | 1668.19 | 642 | 635 | 178.1 |
| C | 13 | 3 | 208022 | 1164.7 | 642 | 635 | 178.1 |
| D | 8 | 176 | 1291253 | 7046.53 | 642 | 615 | 183.2 |
| D | 2 | 37 | 1175852 | 6416.47 | 642 | 615 | 183.2 |
| D | 12 | 2 | 461343 | 2515.45 | 642 | 615 | 183.2 |
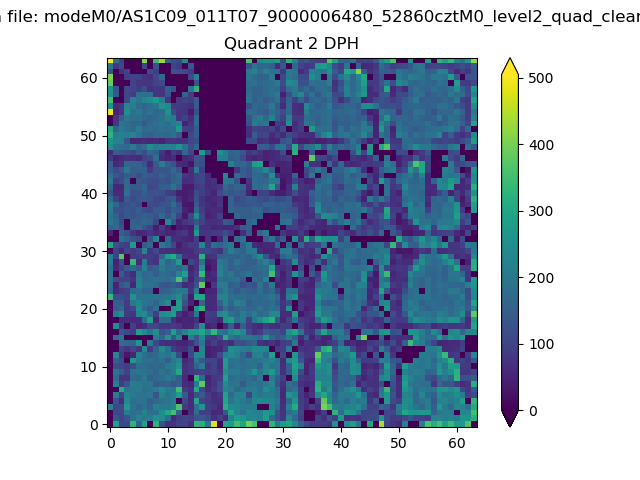
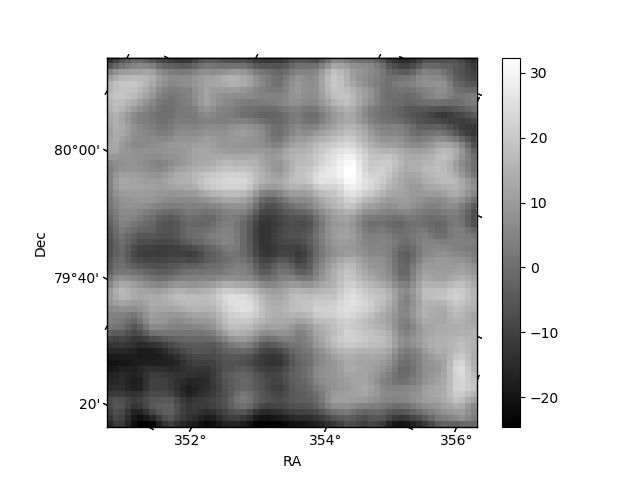
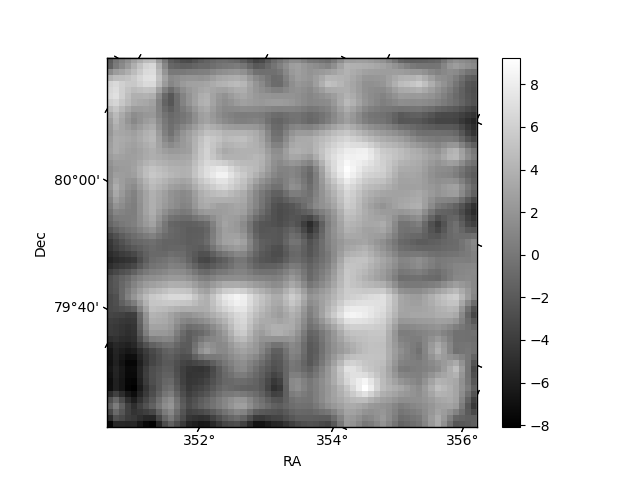
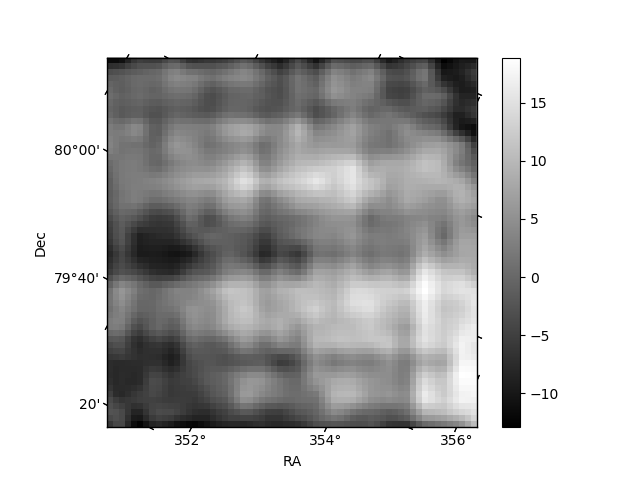
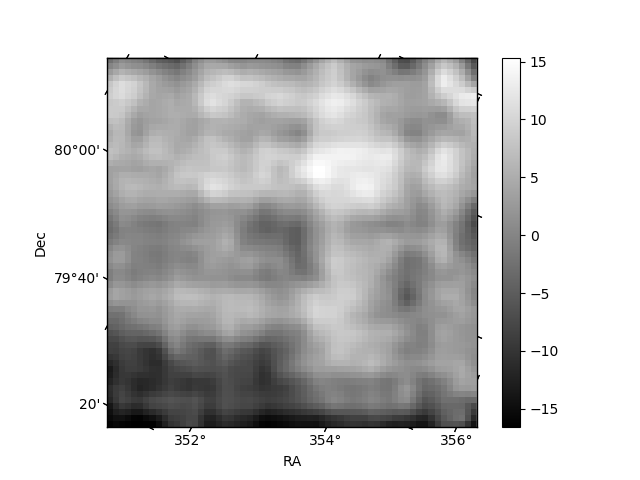
Histogram calculated using DETX and DETY for each event in the final _common_clean file
| Quadrant A | 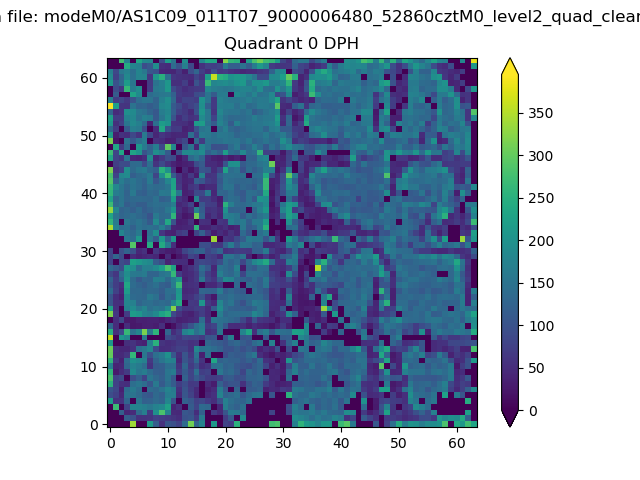 |
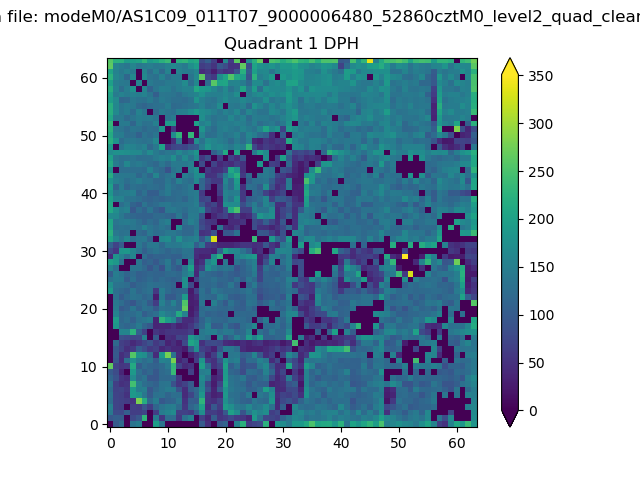 |
Quadrant B |
|---|---|---|---|
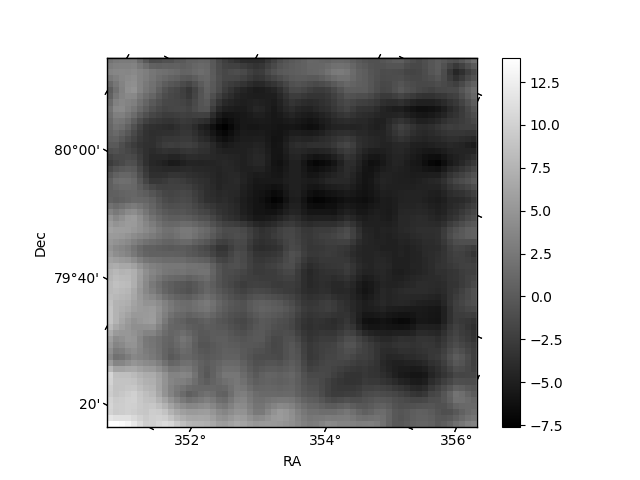
| Quadrant D | 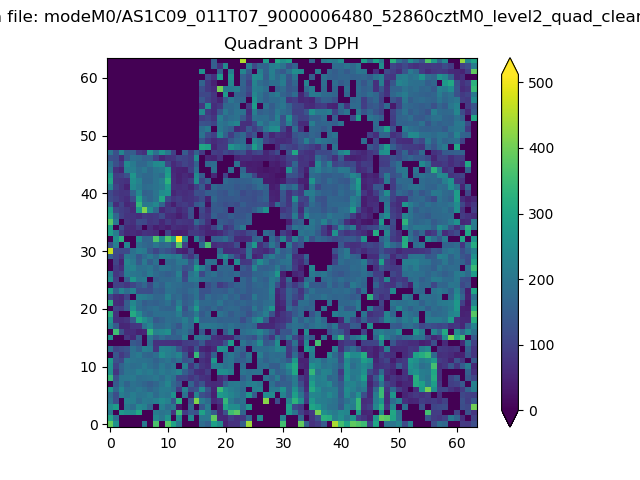 |
 |
Quadrant C |
| Plot type | Count rate plots | Images |
|---|---|---|
| Comparison with Poisson distribution Blue bars denote a histogram of data divided into 1 sec bins. Red curve is a Poisson curve with rate = median count rate of data. |
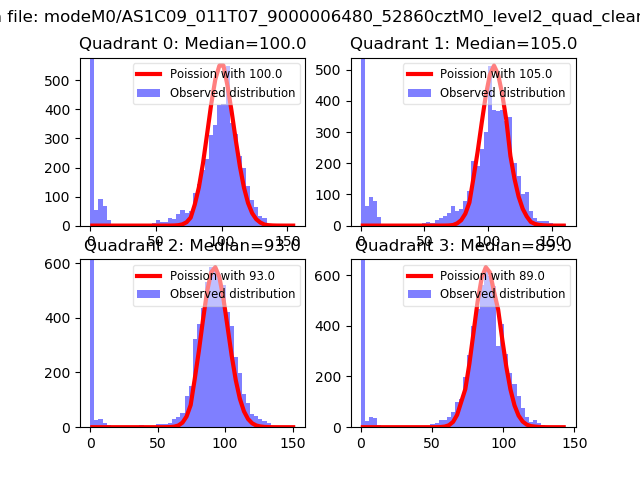 |
 |
| Quadrant-wise count rates Data is divided into 100 sec bins |
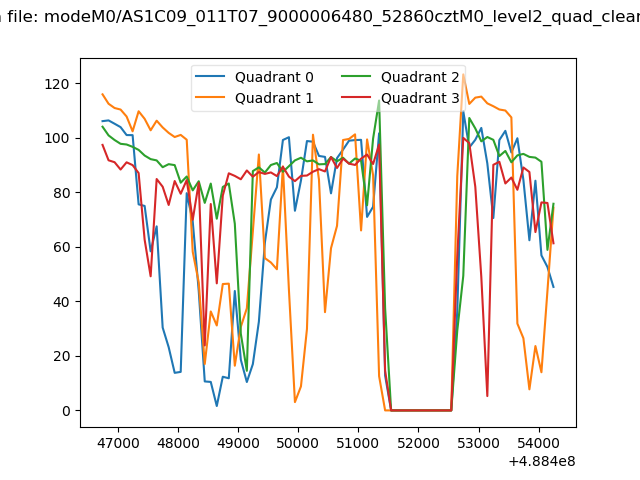 |
|
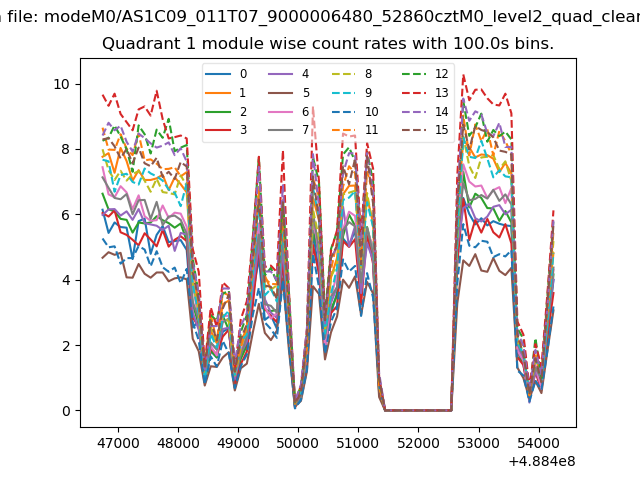
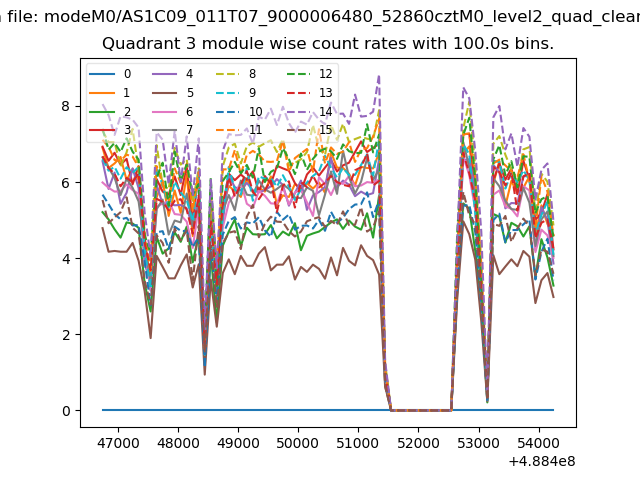
| Module-wise count rates for Quadrant A Data is divided into 100 sec bins |
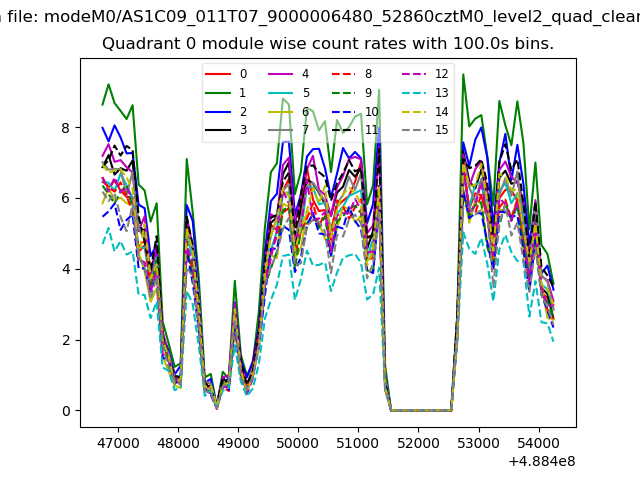 |
 |
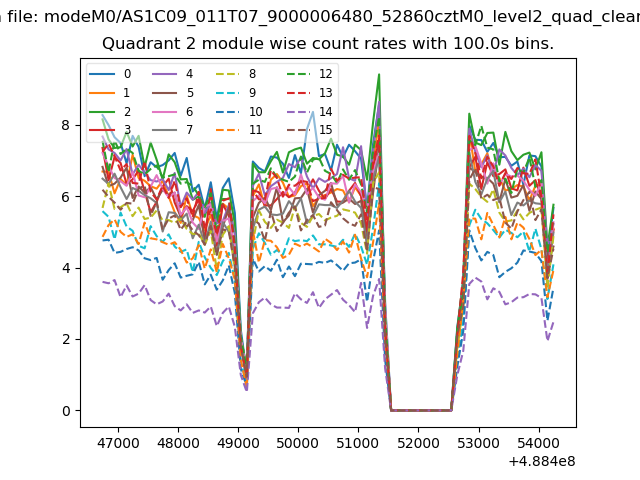
| Module-wise count rates for Quadrant B Data is divided into 100 sec bins |
 |
 |
| Module-wise count rates for Quadrant C Data is divided into 100 sec bins |
 |
 |
| Module-wise count rates for Quadrant D Data is divided into 100 sec bins |
 |
 |
| Parameter | Plot |
|---|---|
| CZT HV Monitor | 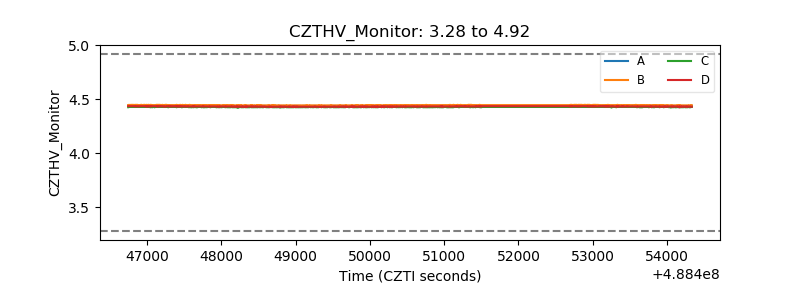 |
| D_VDD | 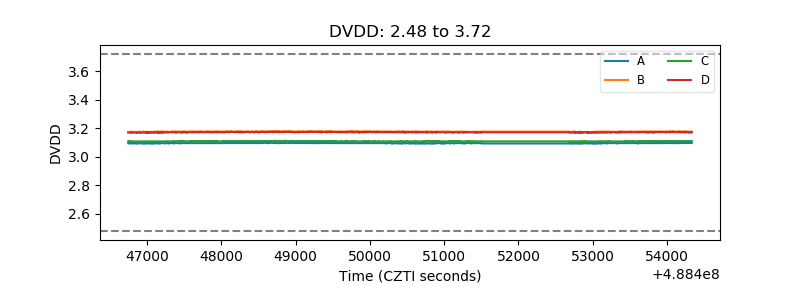 |
| Temperature 1 | 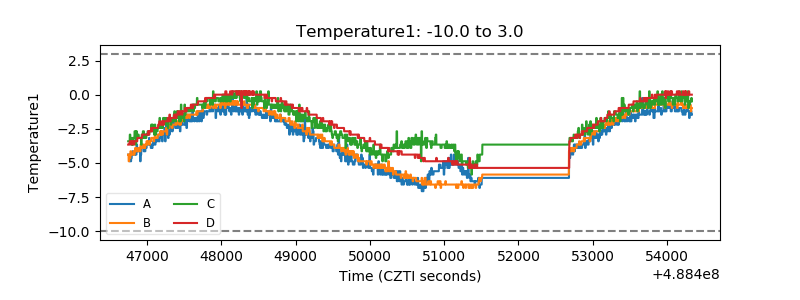 |
| Veto HV Monitor | 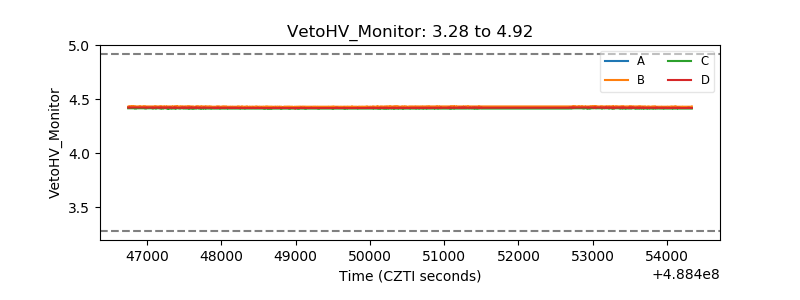 |
| Veto LLD | 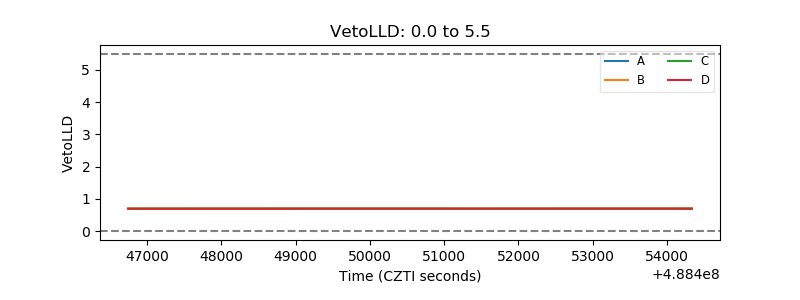 |
| Alpha Counter | 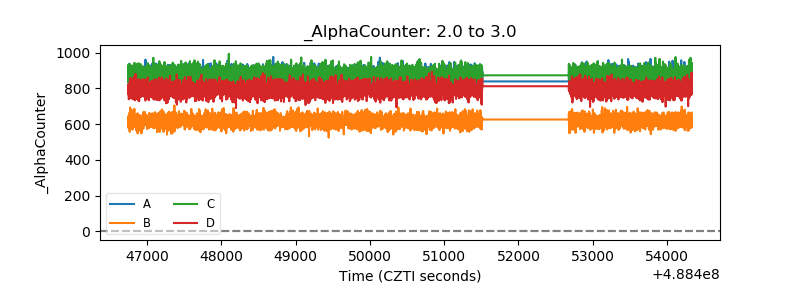 |
| _CPM_Rate | 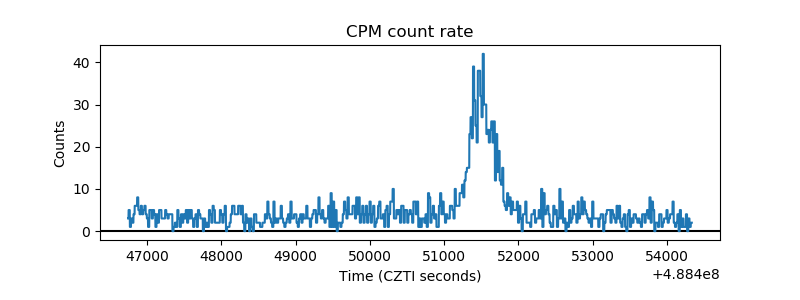 |
| CZT Counter | 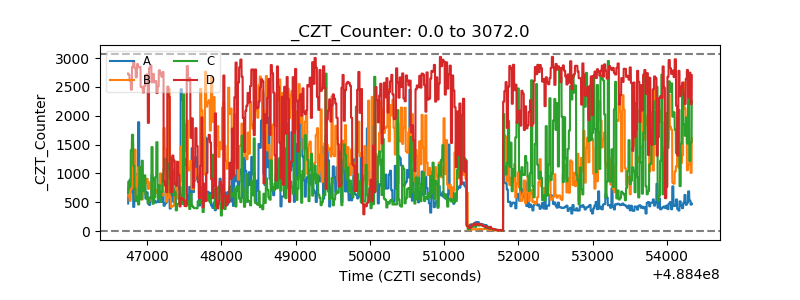 |
| +2.5 Volts monitor |  |
| +5 Volts monitor | 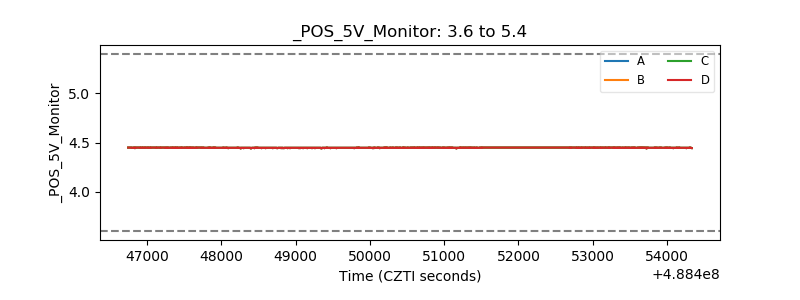 |
| _ROLL_ROT | 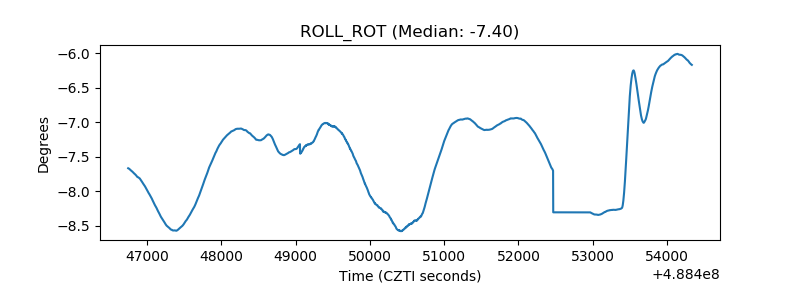 |
| _Roll_DEC | 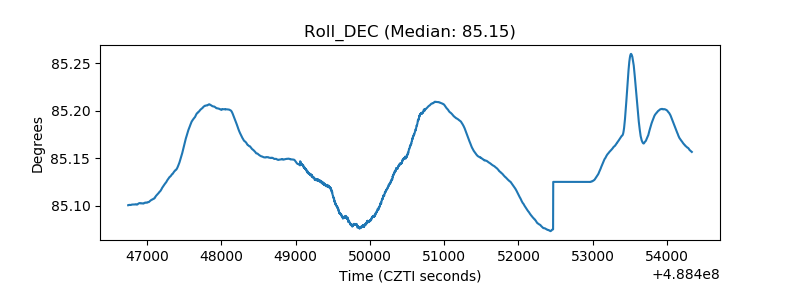 |
| _Roll_RA | 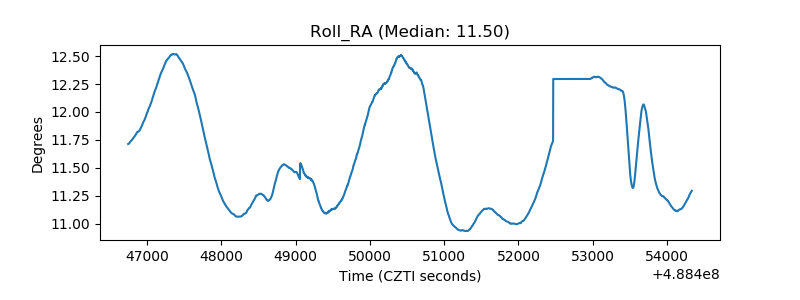 |
| Veto Counter | 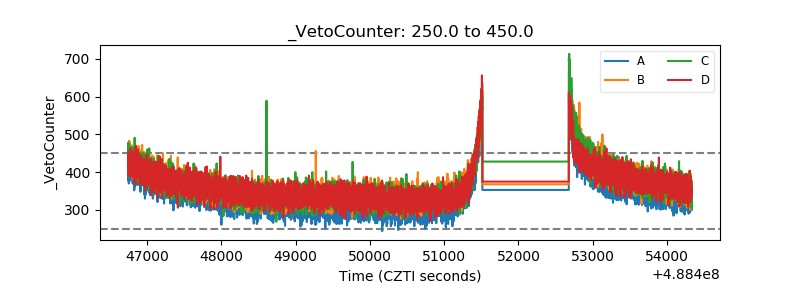 |