| Param | Original file | Final file |
|---|---|---|
| Filename | modeM0/AS1C09_011T07_9000006480_52864cztM0_level2.fits | modeM0/AS1C09_011T07_9000006480_52864cztM0_level2_quad_clean.evt |
| Size (bytes) | 319,475,520 | 22,127,040 |
| Size | 304.7 MB | 21.1 MB |
| Events in quadrant A | 2,146,488 | 183,840 |
| Events in quadrant B | 3,882,147 | 111,286 |
| Events in quadrant C | 1,838,995 | 160,052 |
| Events in quadrant D | 3,795,777 | 64,787 |
| Mode SS | |||
|---|---|---|---|
| Quadrant | BADHDUFLAG | Total packets | Discarded packets |
| A | 0 | 40 | 0 |
| B | 0 | 40 | 0 |
| C | 0 | 40 | 0 |
| D | 0 | 40 | 0 |
| Mode M0 | |||
|---|---|---|---|
| Quadrant | BADHDUFLAG | Total packets | Discarded packets |
| A | 0 | 7859 | 0 |
| B | 0 | 12966 | 0 |
| C | 0 | 6975 | 0 |
| D | 0 | 12698 | 0 |
| Quadrant | Total seconds | Saturated seconds | Saturation percentage |
|---|---|---|---|
| A | 2072 | 187 | 9.025097% |
| B | 2073 | 1090 | 52.580801% |
| C | 2073 | 282 | 13.603473% |
| D | 2073 | 1373 | 66.232513% |
Noise dominated data is calculated using 1-second bins in cleaned event files. If a bin has >2000 counts, and if more than 50% of those come from <1% of pixels, then it is considered to be noise-dominated and hence unusable.
| Quadrant | # 1 sec bins | Bins with >0 counts | Bins with >2000 counts | High rate bins dominated by noise | Noise dominated (total time) | Noise dominated (detector-on time) | Marked lightcurve |
|---|---|---|---|---|---|---|---|
| A | 2072 | 2072 | 185 | 185 | 8.93% | 8.93% | 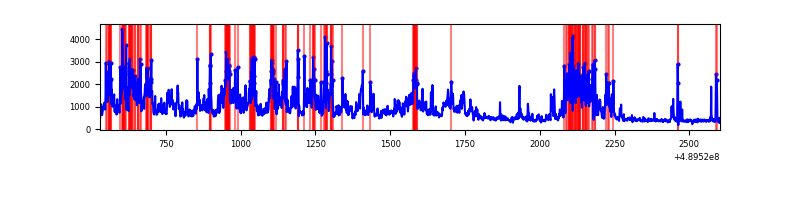 |
| B | 2073 | 2073 | 968 | 968 | 46.70% | 46.70% | 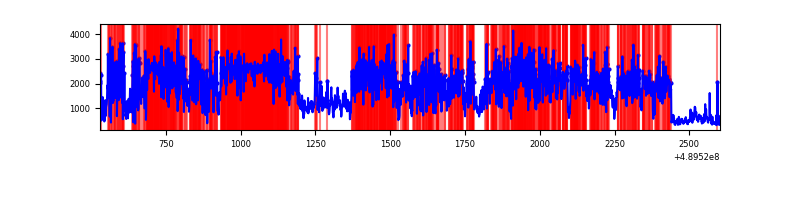 |
| C | 2073 | 2073 | 226 | 226 | 10.90% | 10.90% | 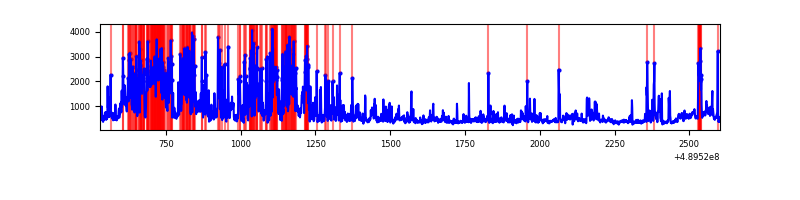 |
| D | 2073 | 2073 | 1044 | 1044 | 50.36% | 50.36% | 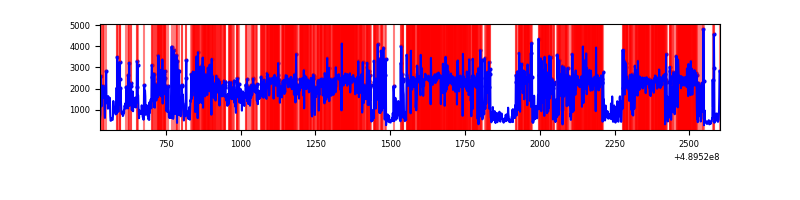 |
Top three noisy pixels from each quadrant. If the there are fewer than three noisy pixels in the level2.evt file, extra rows are filled as -1
| Pixel properties | Quadrant properties | ||||||
|---|---|---|---|---|---|---|---|
| Quadrant | DetID | PixID | Counts | Sigma | Mean | Median | Sigma |
| A | 9 | 191 | 713465 | 14074.17 | 194 | 189 | 50.7 |
| A | 3 | 78 | 368168 | 7260.86 | 194 | 189 | 50.7 |
| A | 3 | 14 | 64317 | 1265.36 | 194 | 189 | 50.7 |
| B | 8 | 3 | 2390606 | 66492.74 | 161 | 155 | 36.0 |
| B | 0 | 213 | 699165 | 19443.64 | 161 | 155 | 36.0 |
| B | 5 | 185 | 43274 | 1199.38 | 161 | 155 | 36.0 |
| C | 15 | 224 | 855326 | 16127.5 | 188 | 186 | 53.0 |
| C | 7 | 80 | 82859 | 1559.17 | 188 | 186 | 53.0 |
| C | 4 | 5 | 49734 | 934.45 | 188 | 186 | 53.0 |
| D | 15 | 125 | 3014004 | 89926.91 | 109 | 104 | 33.5 |
| D | 8 | 176 | 130965 | 3904.55 | 109 | 104 | 33.5 |
| D | 3 | 12 | 44084 | 1312.25 | 109 | 104 | 33.5 |
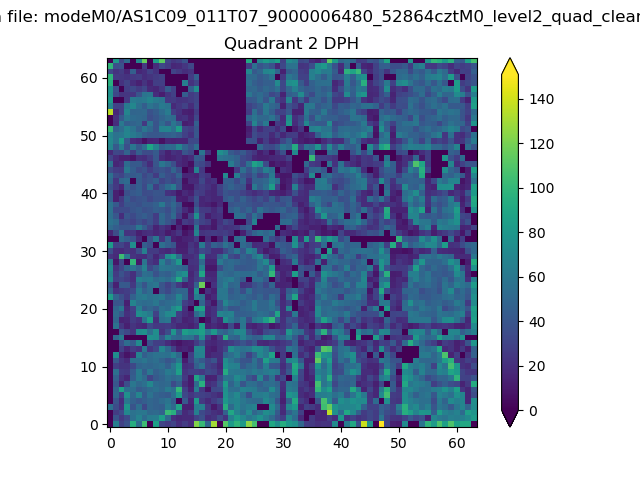
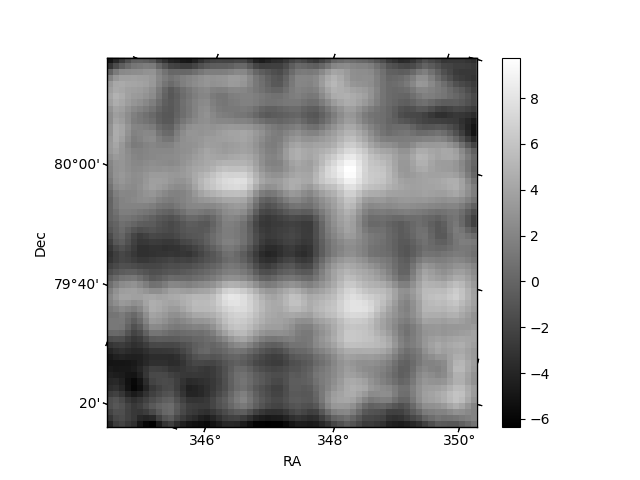
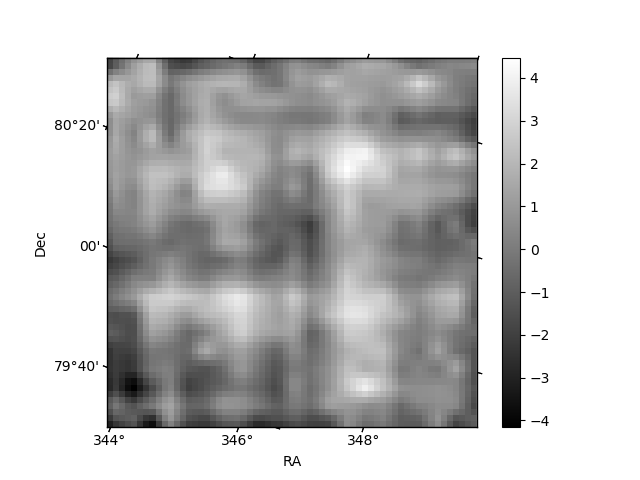
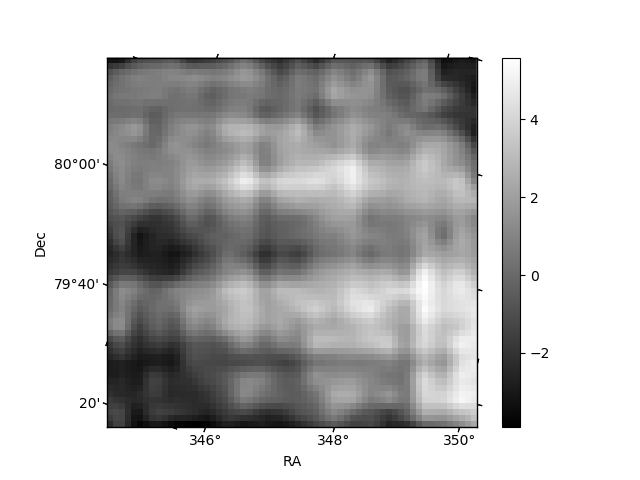
Histogram calculated using DETX and DETY for each event in the final _common_clean file
| Quadrant A | 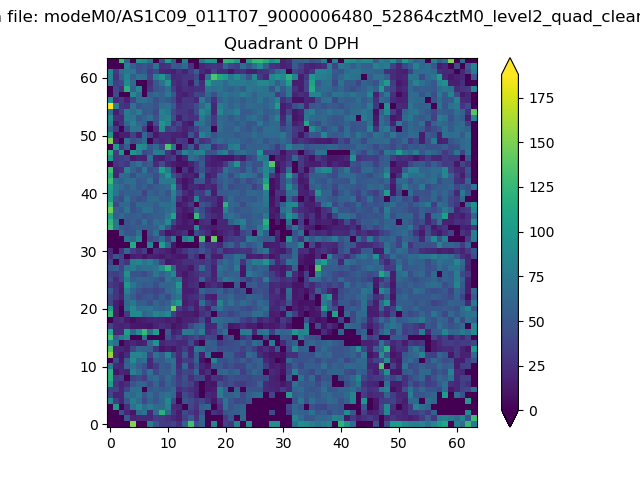 |
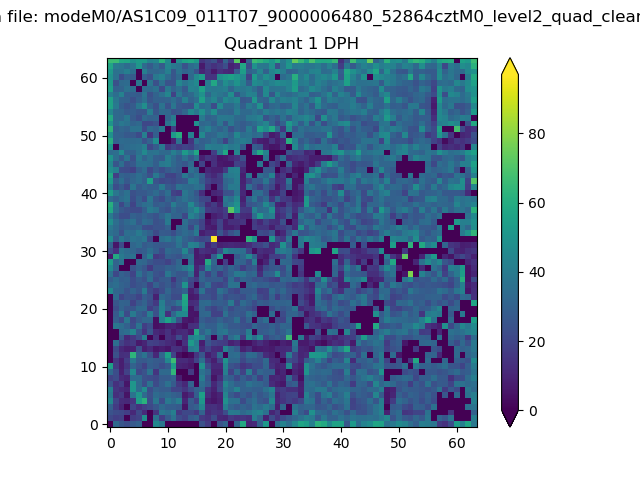 |
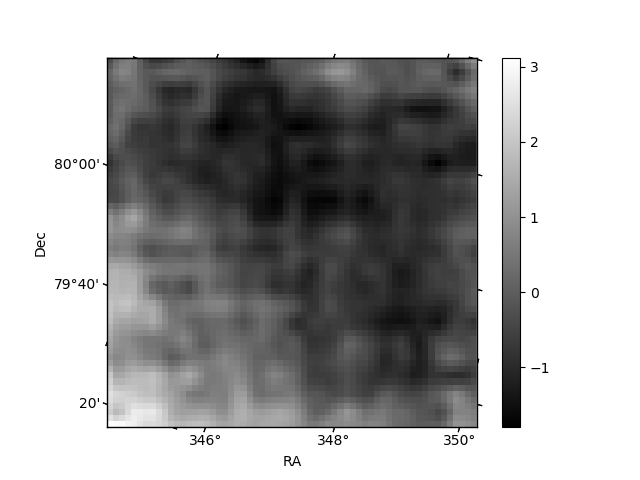
Quadrant B |
|---|---|---|---|
| Quadrant D | 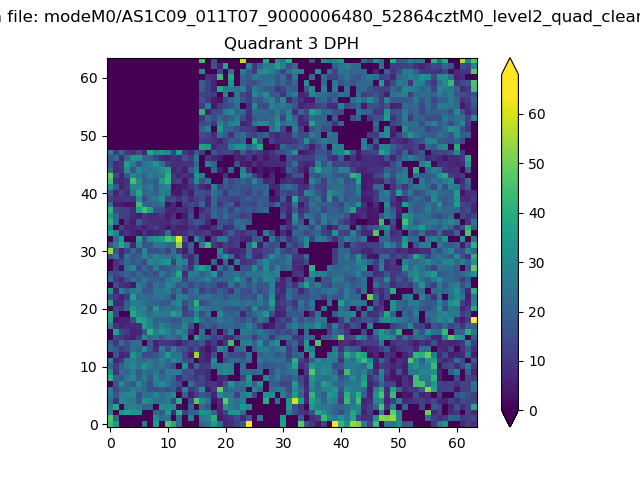 |
 |
Quadrant C |
| Plot type | Count rate plots | Images |
|---|---|---|
| Comparison with Poisson distribution Blue bars denote a histogram of data divided into 1 sec bins. Red curve is a Poisson curve with rate = median count rate of data. |
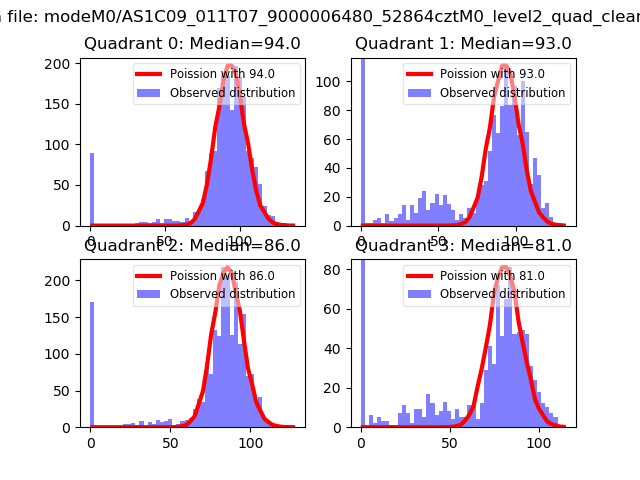 |
 |
| Quadrant-wise count rates Data is divided into 100 sec bins |
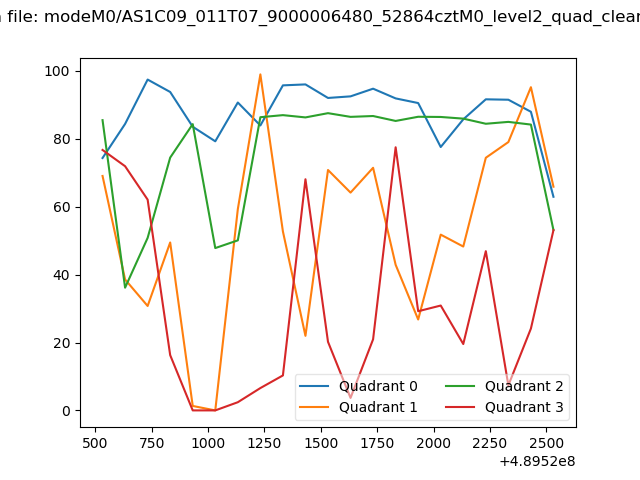 |
|
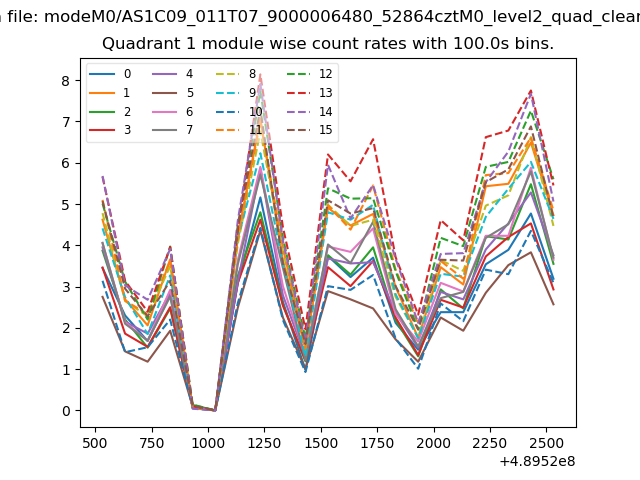
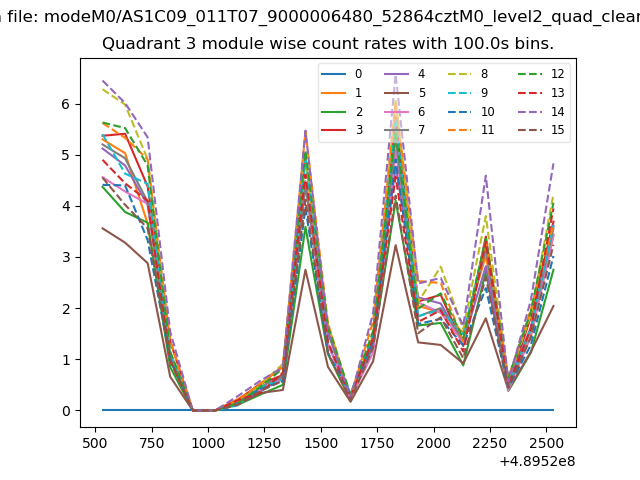
| Module-wise count rates for Quadrant A Data is divided into 100 sec bins |
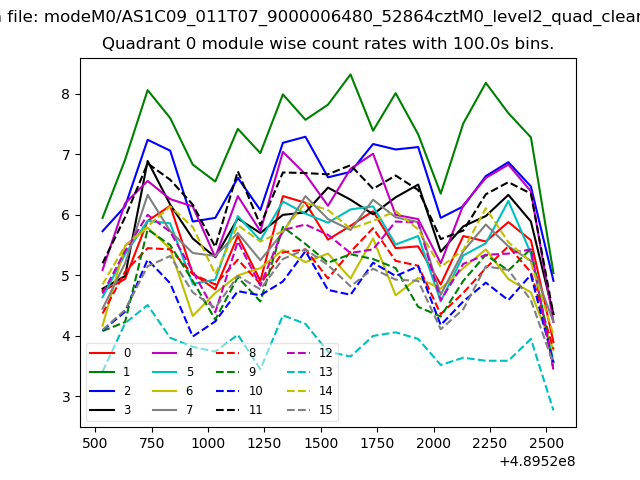 |
 |
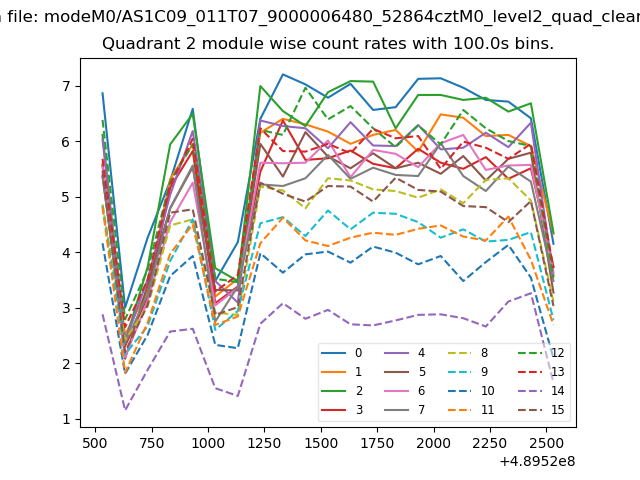
| Module-wise count rates for Quadrant B Data is divided into 100 sec bins |
 |
 |
| Module-wise count rates for Quadrant C Data is divided into 100 sec bins |
 |
 |
| Module-wise count rates for Quadrant D Data is divided into 100 sec bins |
 |
 |
| Parameter | Plot |
|---|---|
| CZT HV Monitor | 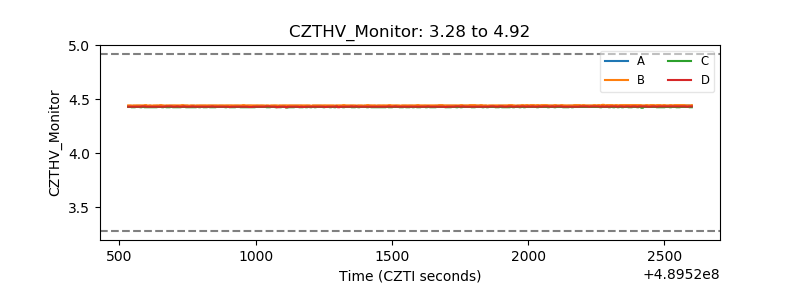 |
| D_VDD | 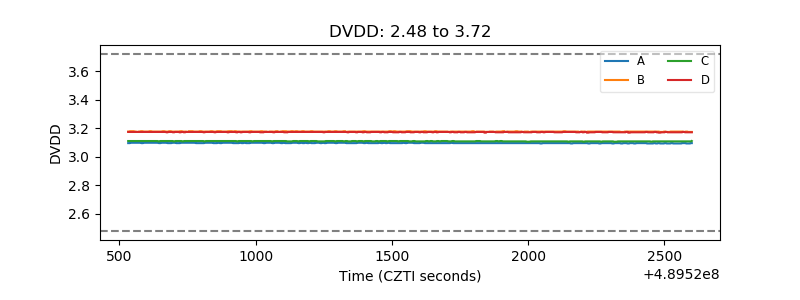 |
| Temperature 1 | 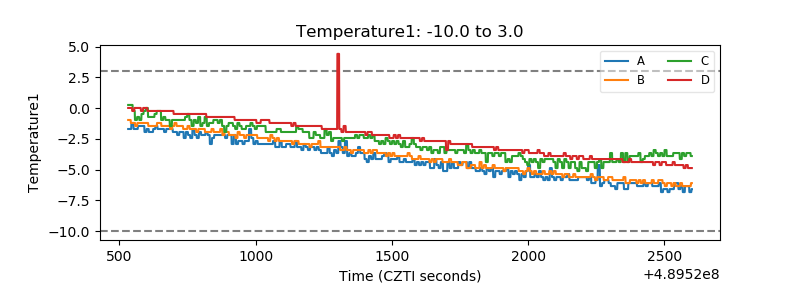 |
| Veto HV Monitor | 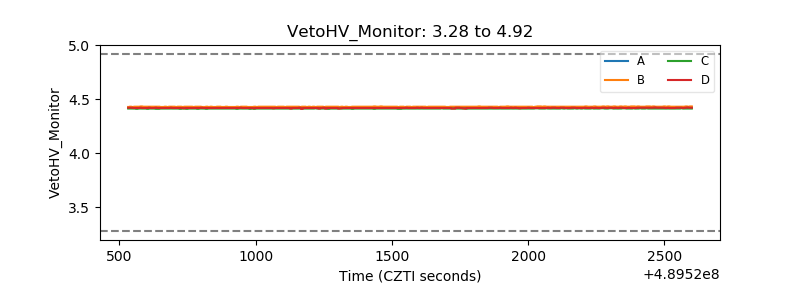 |
| Veto LLD | 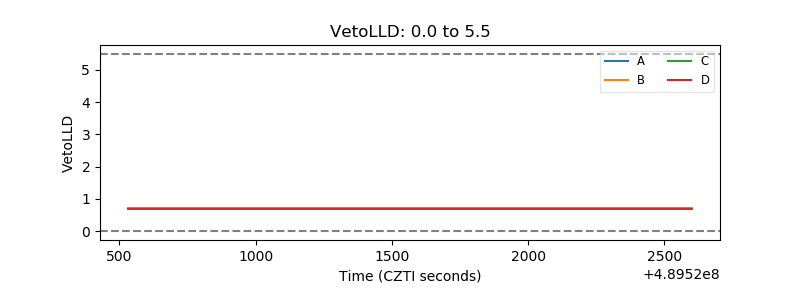 |
| Alpha Counter | 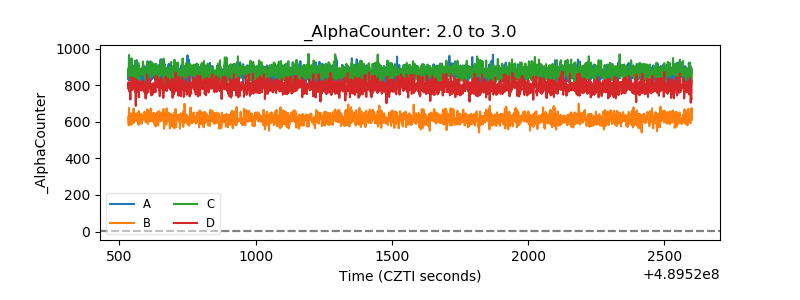 |
| _CPM_Rate | 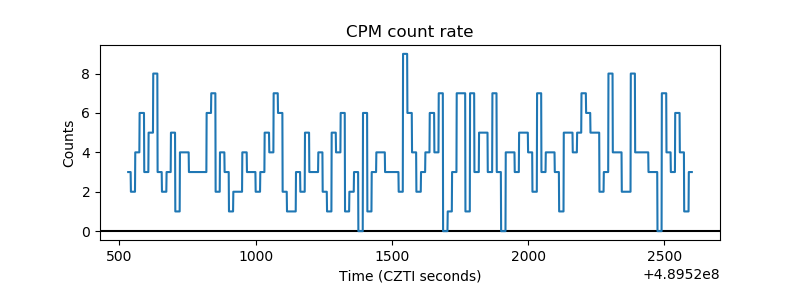 |
| CZT Counter | 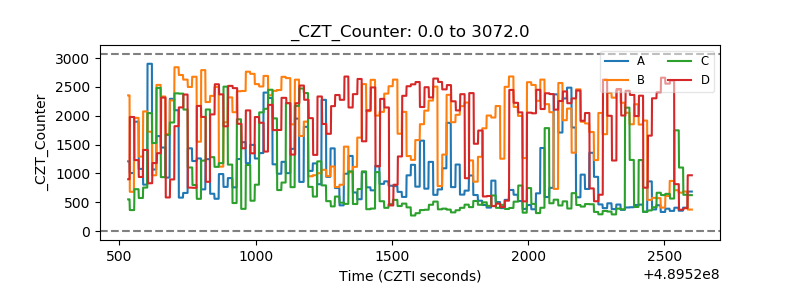 |
| +2.5 Volts monitor | 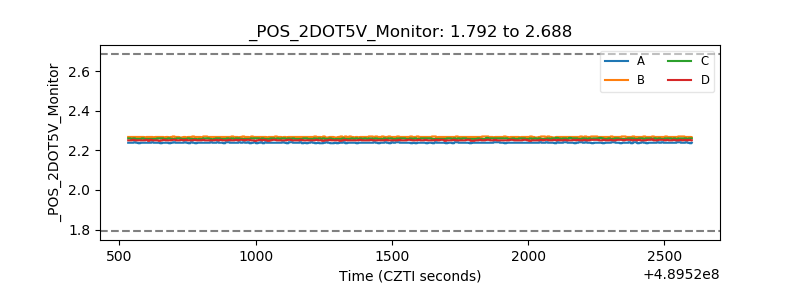 |
| +5 Volts monitor | 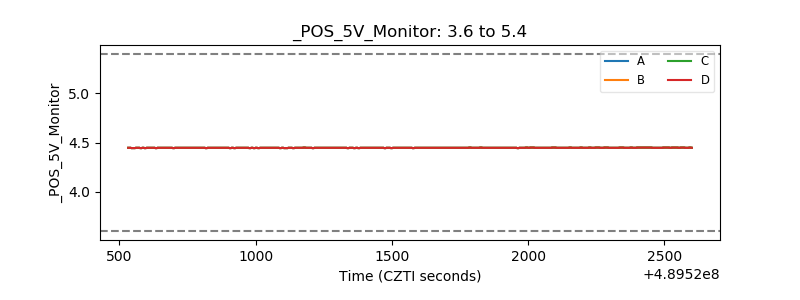 |
| _ROLL_ROT | 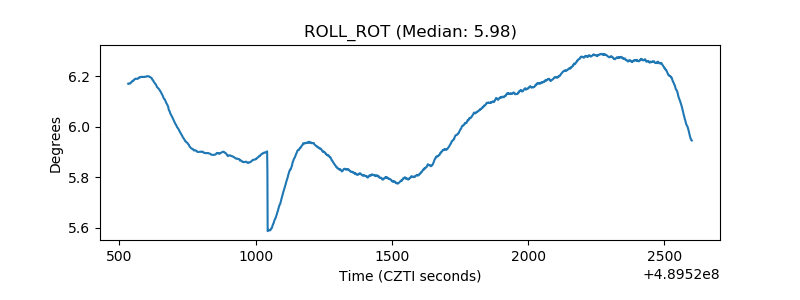 |
| _Roll_DEC | 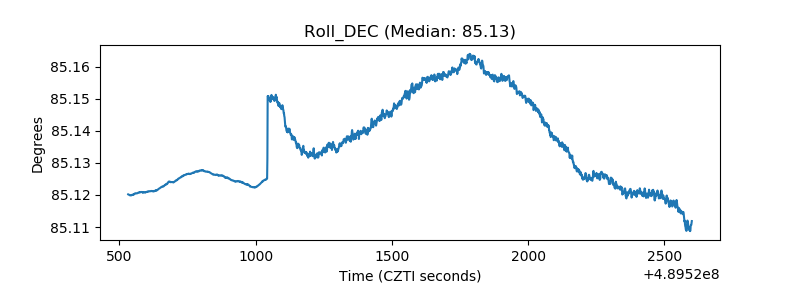 |
| _Roll_RA | 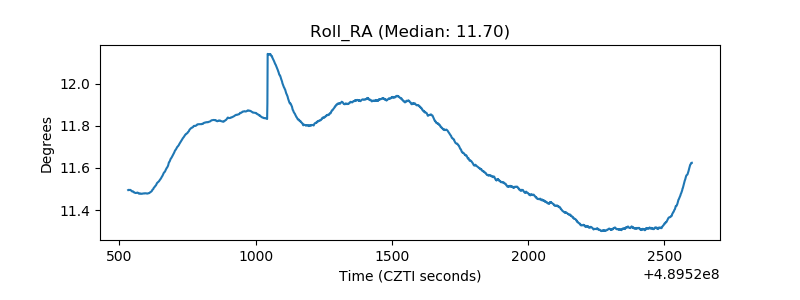 |
| Veto Counter | 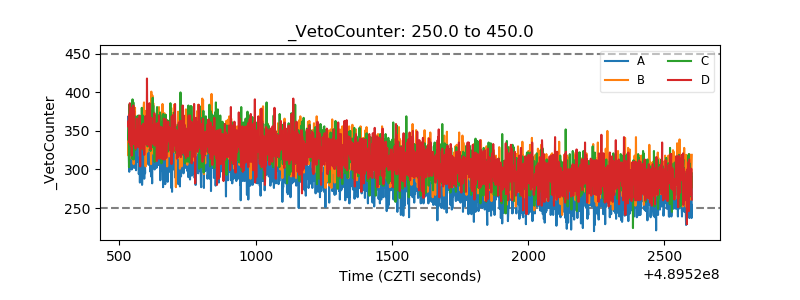 |