| Param | Original file | Final file |
|---|---|---|
| Filename | modeM0/AS1C09_011T08_9000006482_52825cztM0_level2.fits | modeM0/AS1C09_011T08_9000006482_52825cztM0_level2_quad_clean.evt |
| Size (bytes) | 3,146,754,240 | 176,555,520 |
| Size | 2.9 GB | 168.4 MB |
| Events in quadrant A | 40,331,893 | 471,146 |
| Events in quadrant B | 41,542,110 | 471,734 |
| Events in quadrant C | 11,507,348 | 1,664,534 |
| Events in quadrant D | 21,598,726 | 1,391,375 |
| Mode M0 | |||
|---|---|---|---|
| Quadrant | BADHDUFLAG | Total packets | Discarded packets |
| A | 0 | 132921 | 3 |
| B | 0 | 136656 | 3 |
| C | 0 | 48775 | 3 |
| D | 0 | 77709 | 5 |
| Mode M9 | |||
|---|---|---|---|
| Quadrant | BADHDUFLAG | Total packets | Discarded packets |
| A | 0 | 11 | 0 |
| B | 0 | 11 | 0 |
| C | 0 | 11 | 0 |
| D | 0 | 11 | 0 |
| Mode SS | |||
|---|---|---|---|
| Quadrant | BADHDUFLAG | Total packets | Discarded packets |
| A | 0 | 394 | 0 |
| B | 0 | 394 | 0 |
| C | 0 | 394 | 0 |
| D | 0 | 394 | 0 |
| Quadrant | Total seconds | Saturated seconds | Saturation percentage |
|---|---|---|---|
| A | 19531 | 14743 | 75.485126% |
| B | 19532 | 15426 | 78.978087% |
| C | 19532 | 636 | 3.256195% |
| D | 19531 | 3291 | 16.850136% |
Noise dominated data is calculated using 1-second bins in cleaned event files. If a bin has >2000 counts, and if more than 50% of those come from <1% of pixels, then it is considered to be noise-dominated and hence unusable.
| Quadrant | # 1 sec bins | Bins with >0 counts | Bins with >2000 counts | High rate bins dominated by noise | Noise dominated (total time) | Noise dominated (detector-on time) | Marked lightcurve |
|---|---|---|---|---|---|---|---|
| A | 20600 | 19531 | 14537 | 14537 | 70.57% | 74.43% | 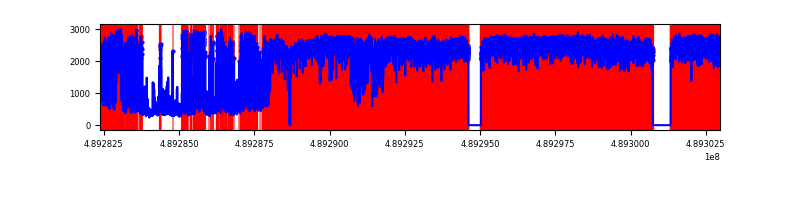 |
| B | 20601 | 19532 | 14297 | 14297 | 69.40% | 73.20% | 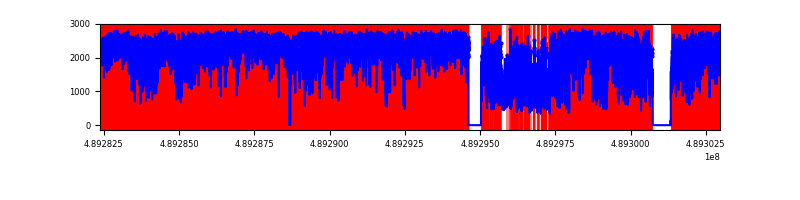 |
| C | 20601 | 19533 | 534 | 534 | 2.59% | 2.73% | 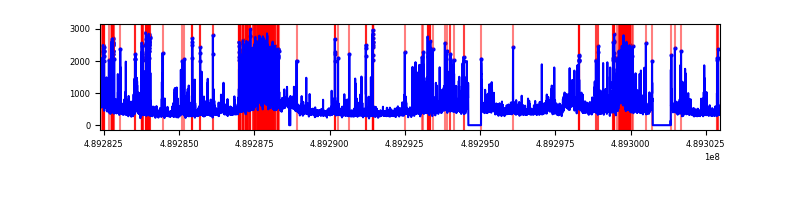 |
| D | 20600 | 19531 | 3233 | 3233 | 15.69% | 16.55% | 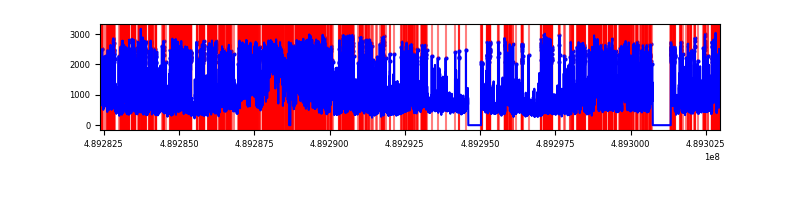 |
Top three noisy pixels from each quadrant. If the there are fewer than three noisy pixels in the level2.evt file, extra rows are filled as -1
| Pixel properties | Quadrant properties | ||||||
|---|---|---|---|---|---|---|---|
| Quadrant | DetID | PixID | Counts | Sigma | Mean | Median | Sigma |
| A | 9 | 191 | 30898346 | 136358.63 | 908 | 885 | 226.6 |
| A | 3 | 62 | 4030319 | 17782.95 | 908 | 885 | 226.6 |
| A | 4 | 238 | 767483 | 3383.2 | 908 | 885 | 226.6 |
| B | 8 | 3 | 32329342 | 125903.27 | 1221 | 1176 | 256.8 |
| B | 12 | 32 | 2953474 | 11497.84 | 1221 | 1176 | 256.8 |
| B | 4 | 81 | 370864 | 1439.76 | 1221 | 1176 | 256.8 |
| C | 15 | 224 | 977899 | 1804.51 | 1967 | 1946 | 540.8 |
| C | 2 | 12 | 647267 | 1193.18 | 1967 | 1946 | 540.8 |
| C | 10 | 22 | 574839 | 1059.26 | 1967 | 1946 | 540.8 |
| D | 8 | 176 | 7284541 | 13769.27 | 1858 | 1779 | 528.9 |
| D | 10 | 172 | 2916082 | 5509.97 | 1858 | 1779 | 528.9 |
| D | 2 | 249 | 451007 | 849.34 | 1858 | 1779 | 528.9 |
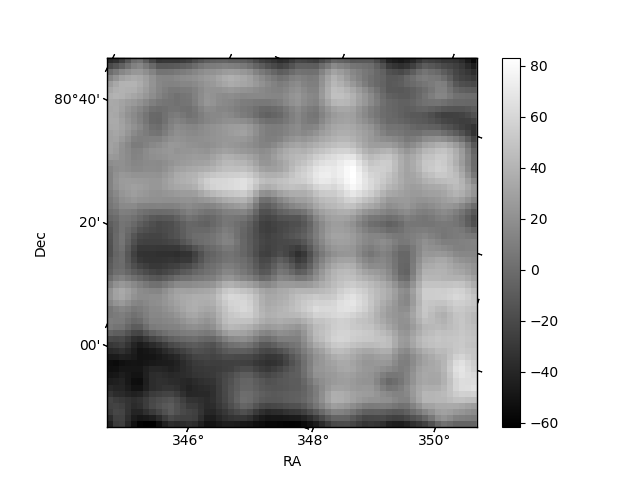
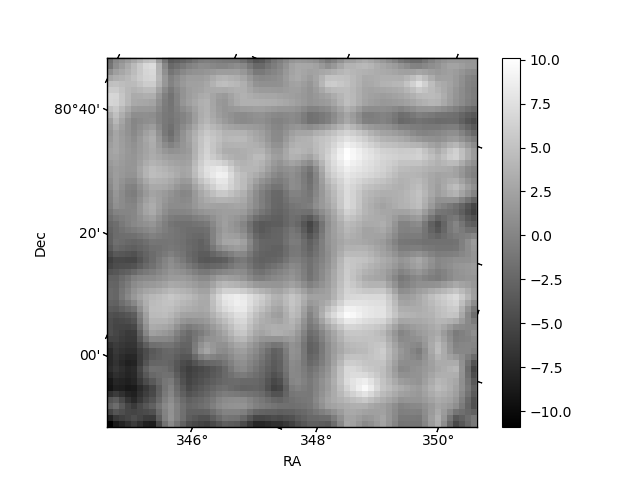
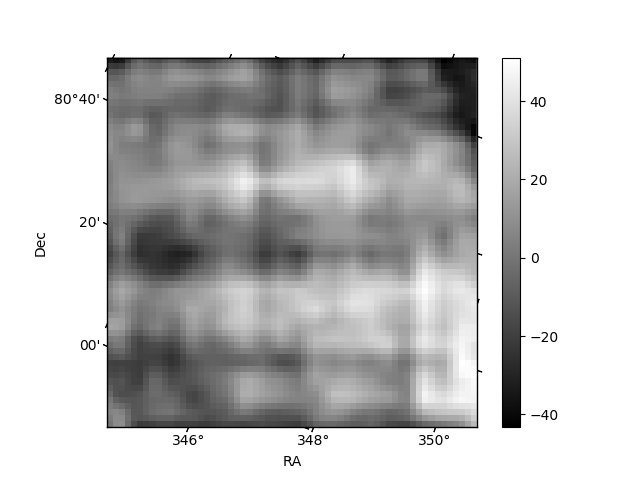
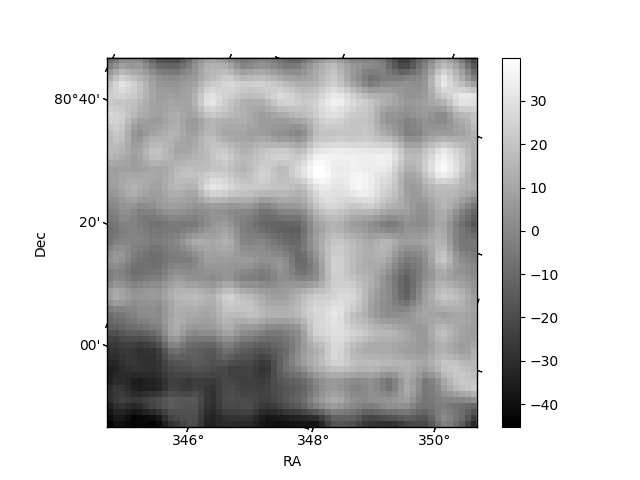
Histogram calculated using DETX and DETY for each event in the final _common_clean file
| Quadrant A | 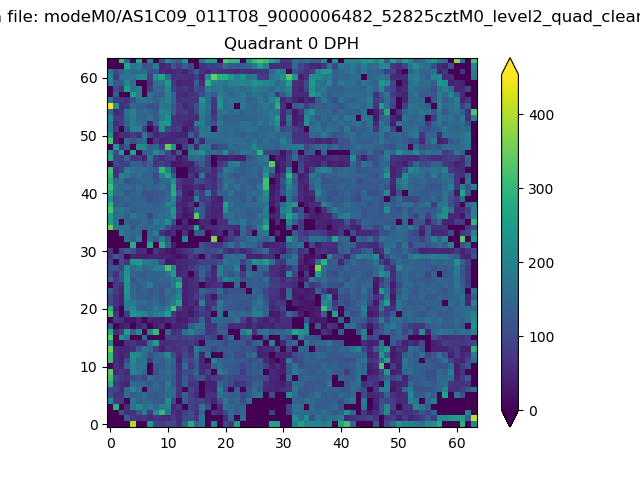 |
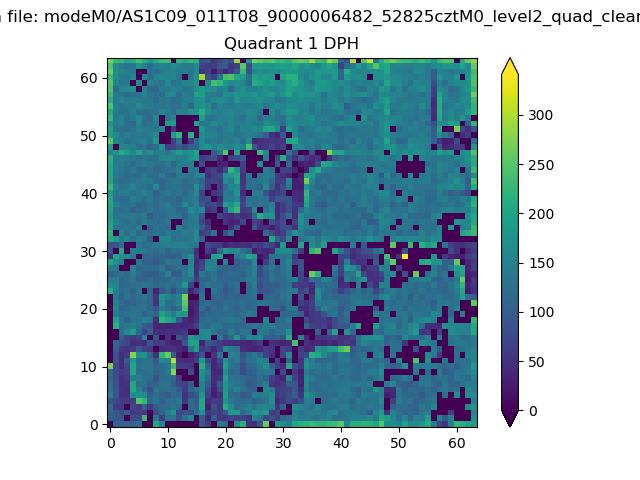 |
Quadrant B |
|---|---|---|---|
| Quadrant D | 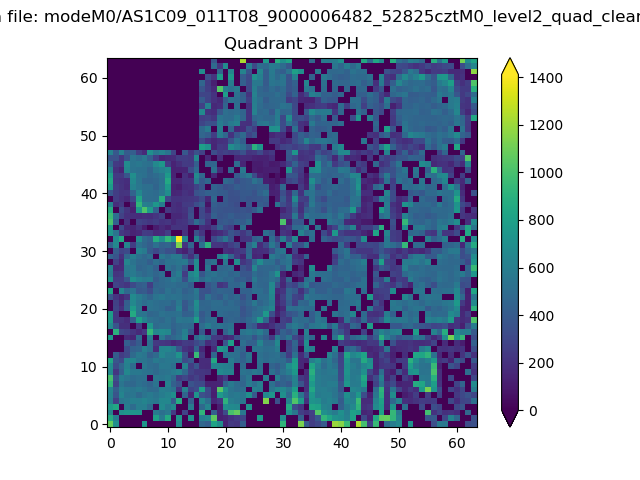 |
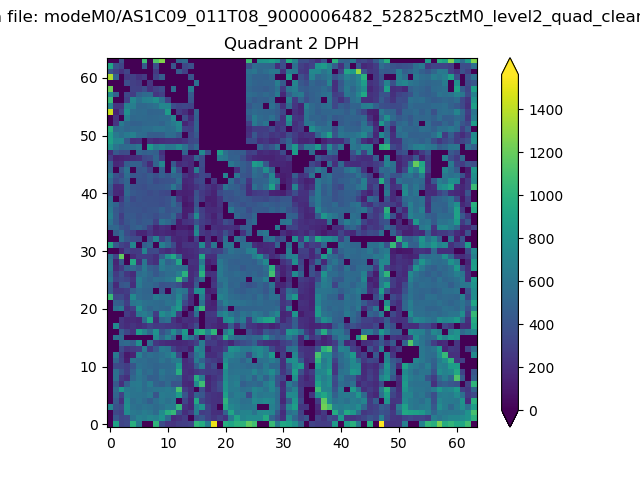 |
Quadrant C |
| Plot type | Count rate plots | Images |
|---|---|---|
| Comparison with Poisson distribution Blue bars denote a histogram of data divided into 1 sec bins. Red curve is a Poisson curve with rate = median count rate of data. |
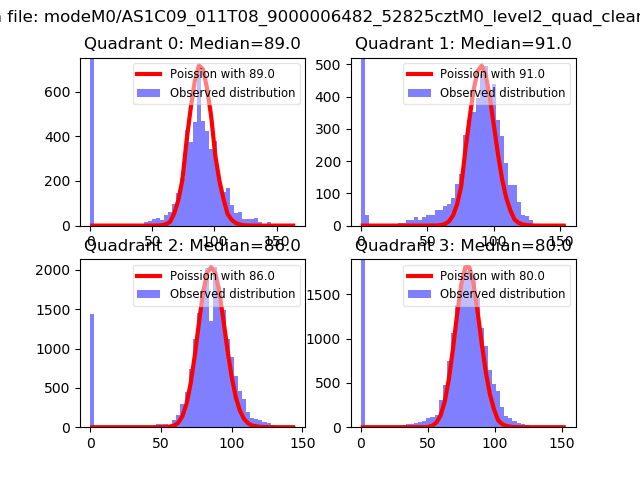 |
 |
| Quadrant-wise count rates Data is divided into 100 sec bins |
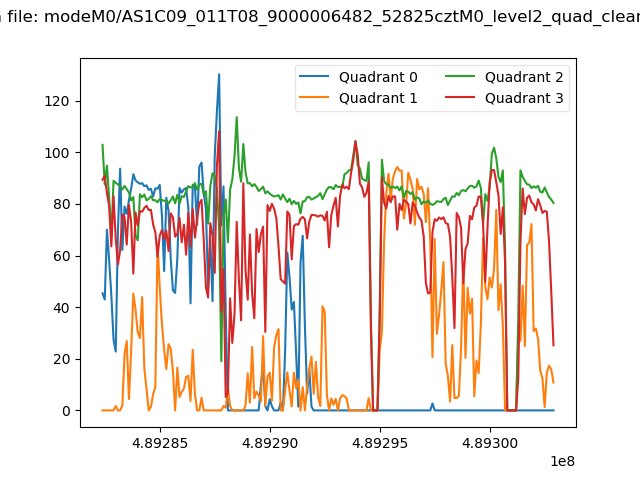 |
|
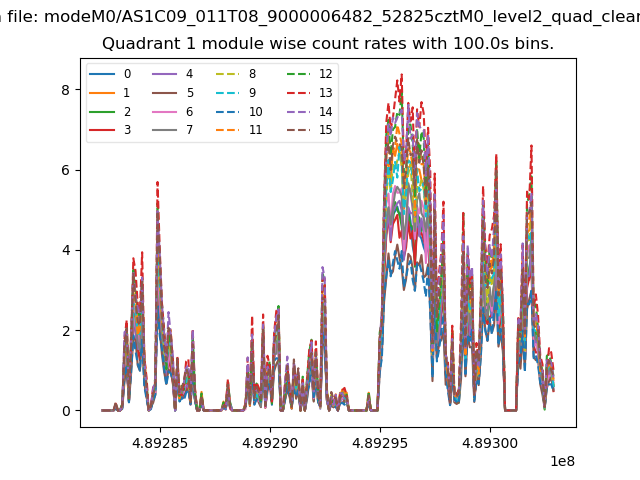
| Module-wise count rates for Quadrant A Data is divided into 100 sec bins |
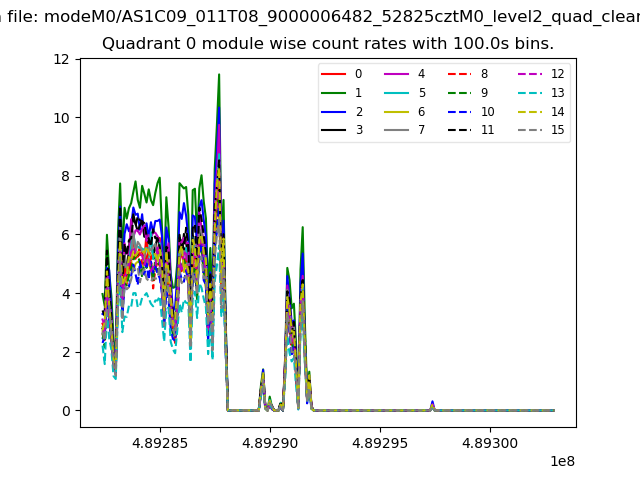 |
 |
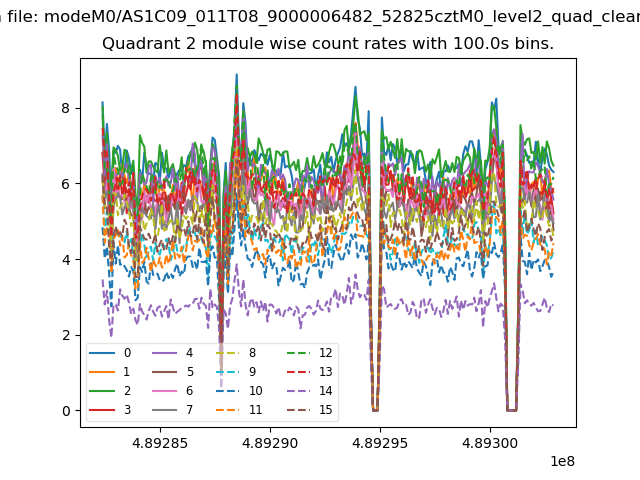
| Module-wise count rates for Quadrant B Data is divided into 100 sec bins |
 |
 |
| Module-wise count rates for Quadrant C Data is divided into 100 sec bins |
 |
 |
| Module-wise count rates for Quadrant D Data is divided into 100 sec bins |
 |
 |
| Parameter | Plot |
|---|---|
| CZT HV Monitor | 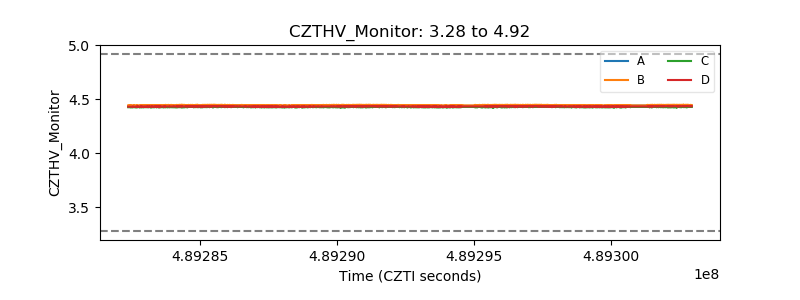 |
| D_VDD | 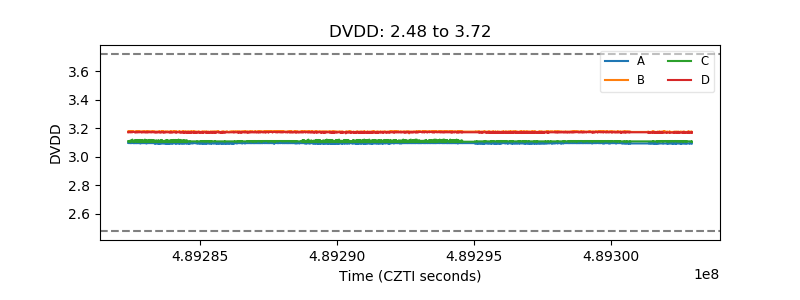 |
| Temperature 1 | 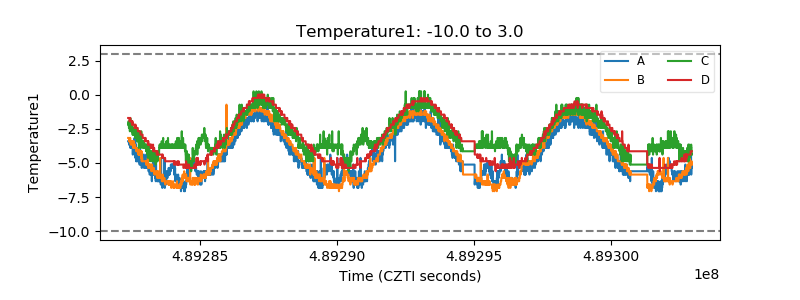 |
| Veto HV Monitor | 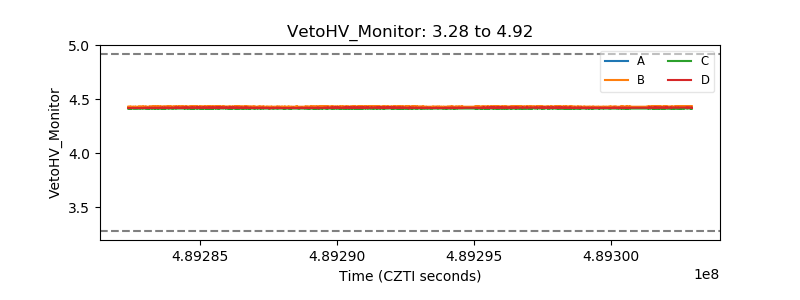 |
| Veto LLD | 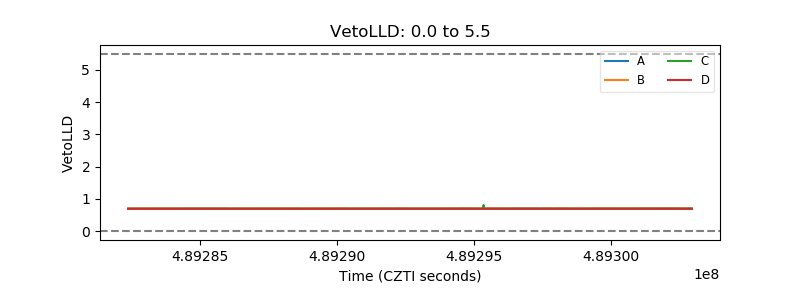 |
| Alpha Counter | 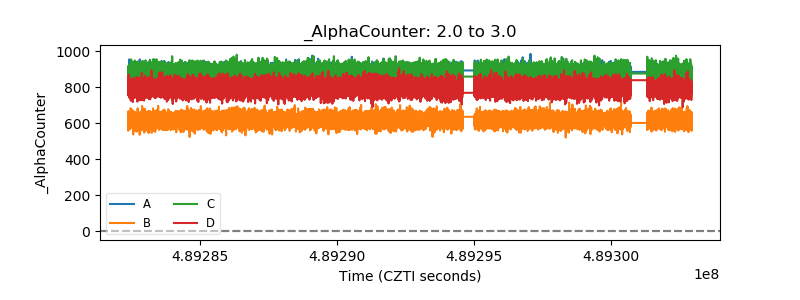 |
| _CPM_Rate | 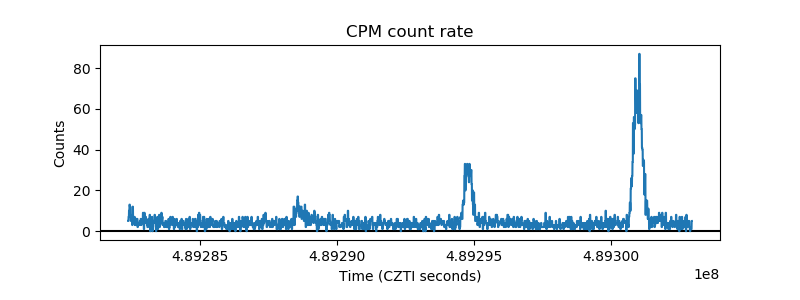 |
| CZT Counter | 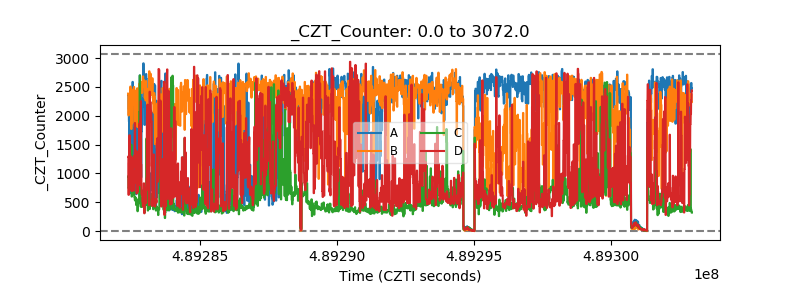 |
| +2.5 Volts monitor | 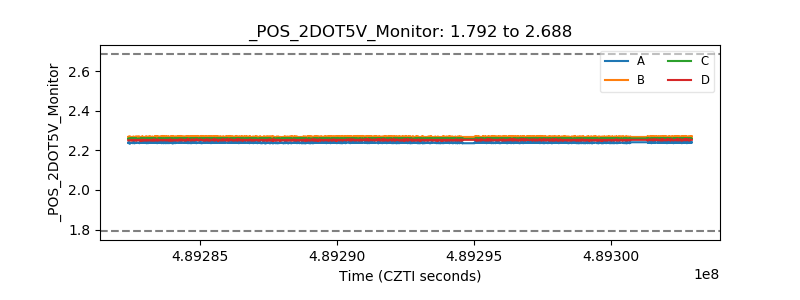 |
| +5 Volts monitor |  |
| _ROLL_ROT | 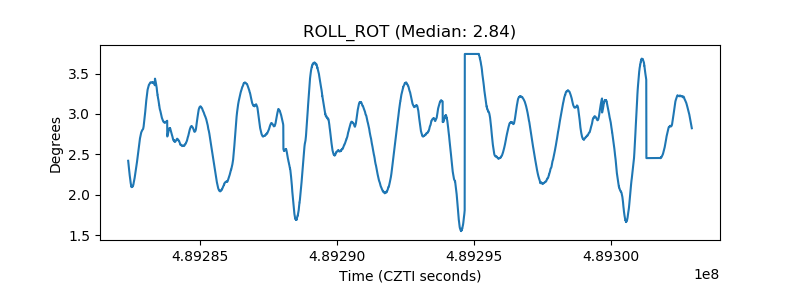 |
| _Roll_DEC | 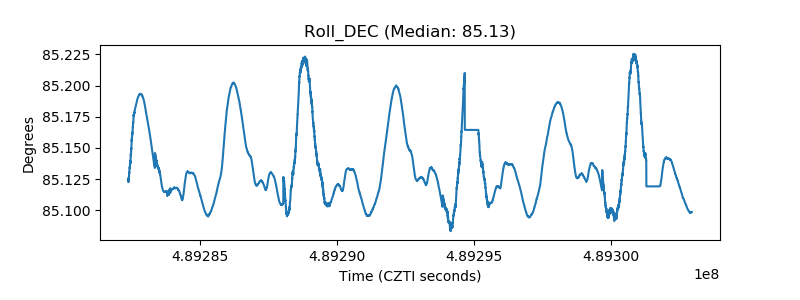 |
| _Roll_RA | 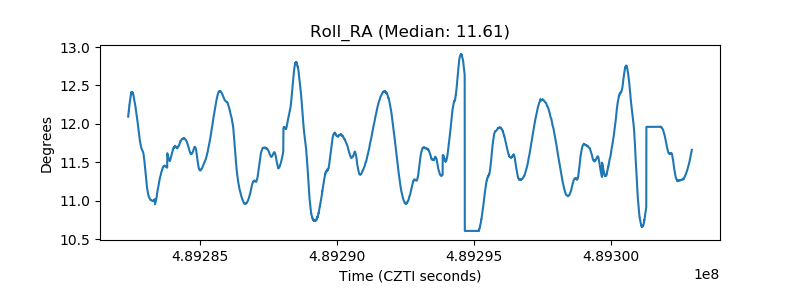 |
| Veto Counter | 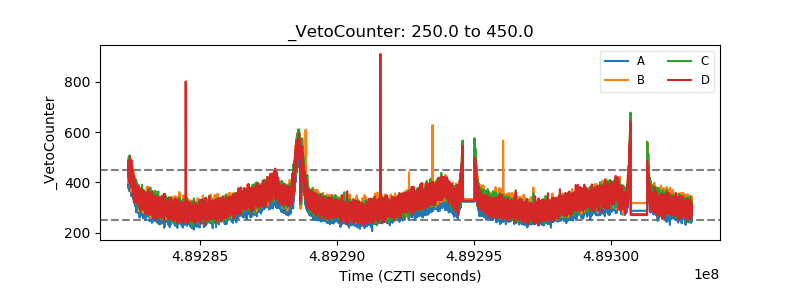 |