| Param | Original file | Final file |
|---|---|---|
| Filename | modeM0/AS1C09_011T08_9000006482_52832cztM0_level2.fits | modeM0/AS1C09_011T08_9000006482_52832cztM0_level2_quad_clean.evt |
| Size (bytes) | 966,496,320 | 58,273,920 |
| Size | 921.7 MB | 55.6 MB |
| Events in quadrant A | 11,861,630 | 192,904 |
| Events in quadrant B | 9,479,115 | 382,643 |
| Events in quadrant C | 8,023,090 | 353,492 |
| Events in quadrant D | 5,980,082 | 441,634 |
| Mode M0 | |||
|---|---|---|---|
| Quadrant | BADHDUFLAG | Total packets | Discarded packets |
| A | 0 | 39087 | 7 |
| B | 0 | 32023 | 1 |
| C | 0 | 27689 | 1 |
| D | 0 | 21638 | 1 |
| Mode M9 | |||
|---|---|---|---|
| Quadrant | BADHDUFLAG | Total packets | Discarded packets |
| A | 0 | 11 | 0 |
| B | 0 | 11 | 0 |
| C | 0 | 11 | 0 |
| D | 0 | 11 | 0 |
| Mode SS | |||
|---|---|---|---|
| Quadrant | BADHDUFLAG | Total packets | Discarded packets |
| A | 0 | 116 | 0 |
| B | 0 | 116 | 0 |
| C | 0 | 116 | 0 |
| D | 0 | 116 | 0 |
| Quadrant | Total seconds | Saturated seconds | Saturation percentage |
|---|---|---|---|
| A | 5615 | 3957 | 70.471950% |
| B | 5616 | 2310 | 41.132479% |
| C | 5616 | 2015 | 35.879630% |
| D | 5616 | 973 | 17.325499% |
Noise dominated data is calculated using 1-second bins in cleaned event files. If a bin has >2000 counts, and if more than 50% of those come from <1% of pixels, then it is considered to be noise-dominated and hence unusable.
| Quadrant | # 1 sec bins | Bins with >0 counts | Bins with >2000 counts | High rate bins dominated by noise | Noise dominated (total time) | Noise dominated (detector-on time) | Marked lightcurve |
|---|---|---|---|---|---|---|---|
| A | 6775 | 5616 | 3574 | 3574 | 52.75% | 63.64% | 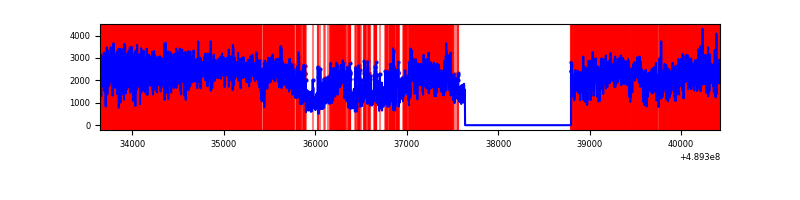 |
| B | 6776 | 5617 | 2066 | 2066 | 30.49% | 36.78% | 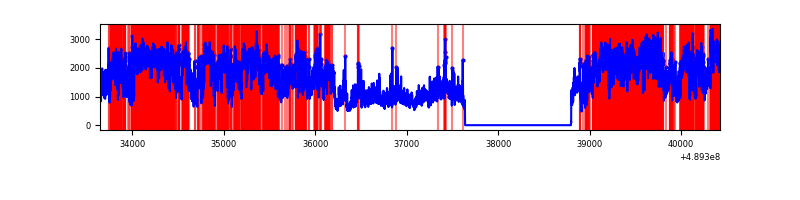 |
| C | 6776 | 5617 | 1698 | 1698 | 25.06% | 30.23% | 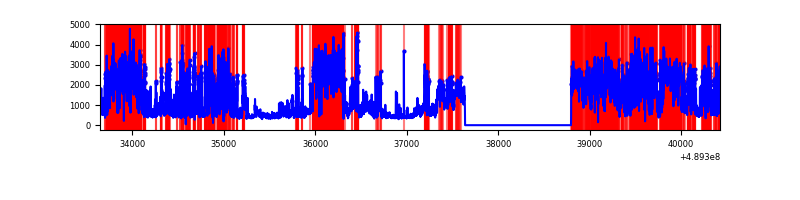 |
| D | 6776 | 5617 | 870 | 870 | 12.84% | 15.49% | 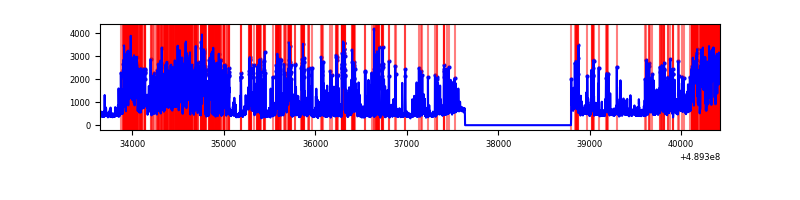 |
Top three noisy pixels from each quadrant. If the there are fewer than three noisy pixels in the level2.evt file, extra rows are filled as -1
| Pixel properties | Quadrant properties | ||||||
|---|---|---|---|---|---|---|---|
| Quadrant | DetID | PixID | Counts | Sigma | Mean | Median | Sigma |
| A | 9 | 191 | 9069665 | 90364.34 | 393 | 383 | 100.4 |
| A | 4 | 238 | 394314 | 3925.04 | 393 | 383 | 100.4 |
| A | 3 | 14 | 221355 | 2201.72 | 393 | 383 | 100.4 |
| B | 8 | 3 | 7086787 | 66055.69 | 509 | 492 | 107.3 |
| B | 10 | 254 | 57864 | 534.8 | 509 | 492 | 107.3 |
| B | 5 | 185 | 48046 | 443.28 | 509 | 492 | 107.3 |
| C | 2 | 12 | 2972025 | 22288.13 | 477 | 470 | 133.3 |
| C | 15 | 224 | 2278211 | 17084.18 | 477 | 470 | 133.3 |
| C | 7 | 80 | 606816 | 4547.89 | 477 | 470 | 133.3 |
| D | 8 | 176 | 2152718 | 13665.76 | 547 | 521 | 157.5 |
| D | 10 | 172 | 509190 | 3229.89 | 547 | 521 | 157.5 |
| D | 3 | 12 | 349838 | 2218.05 | 547 | 521 | 157.5 |
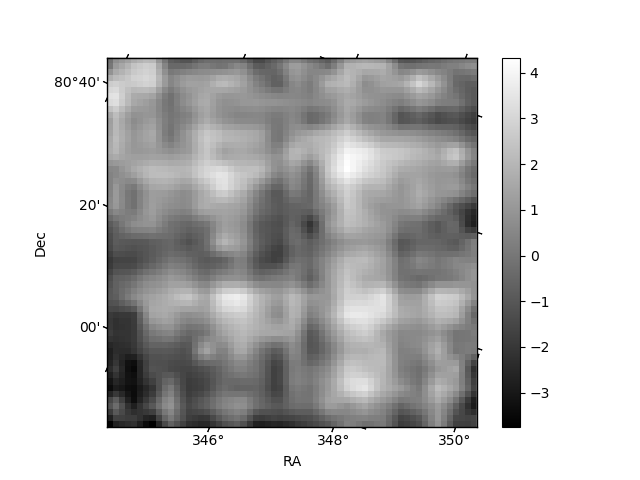
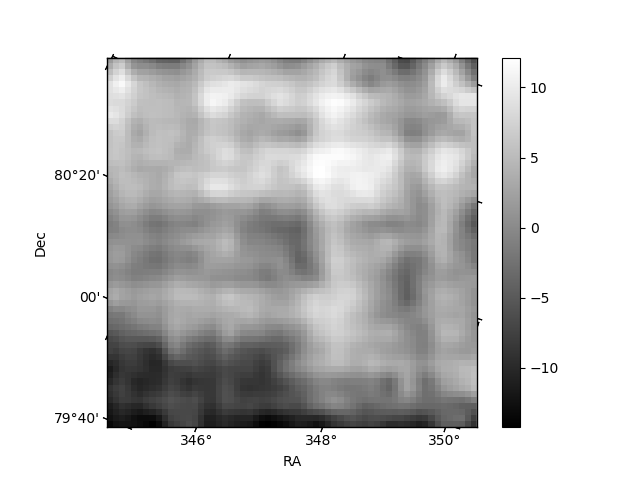
Histogram calculated using DETX and DETY for each event in the final _common_clean file
| Quadrant A | 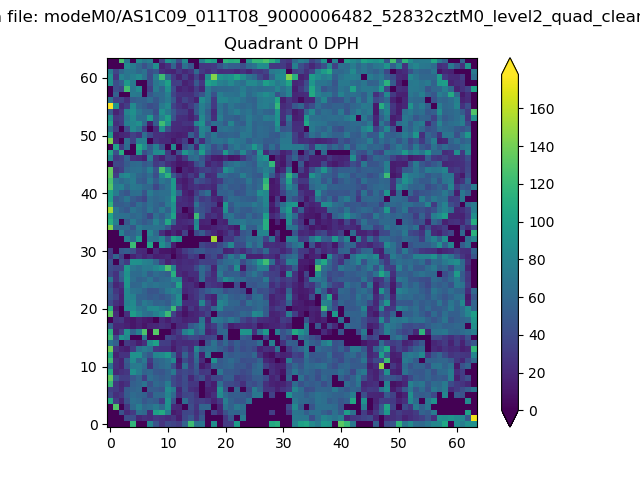 |
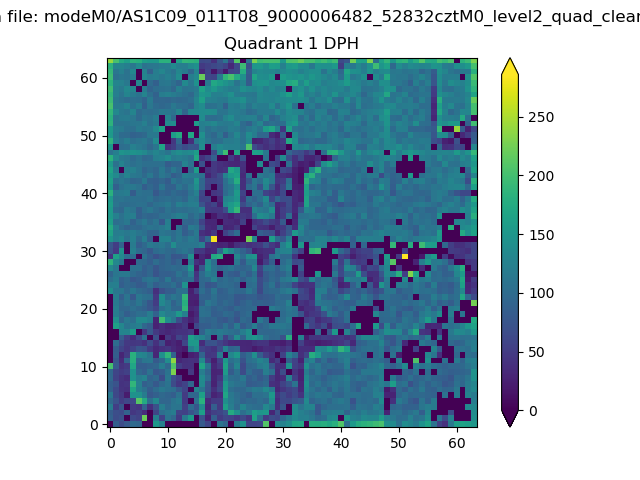 |
Quadrant B |
|---|---|---|---|
| Quadrant D | 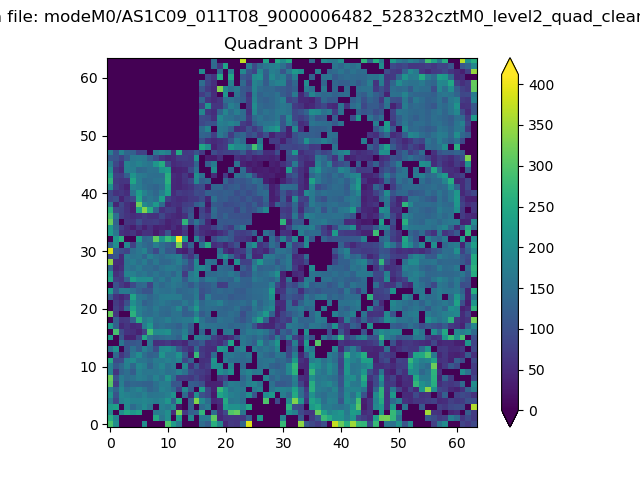 |
 |
Quadrant C |
| Plot type | Count rate plots | Images |
|---|---|---|
| Comparison with Poisson distribution Blue bars denote a histogram of data divided into 1 sec bins. Red curve is a Poisson curve with rate = median count rate of data. |
 |
 |
| Quadrant-wise count rates Data is divided into 100 sec bins |
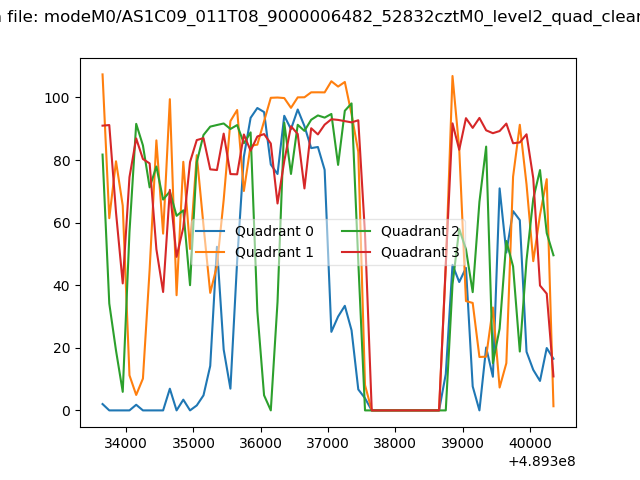 |
|
| Module-wise count rates for Quadrant A Data is divided into 100 sec bins |
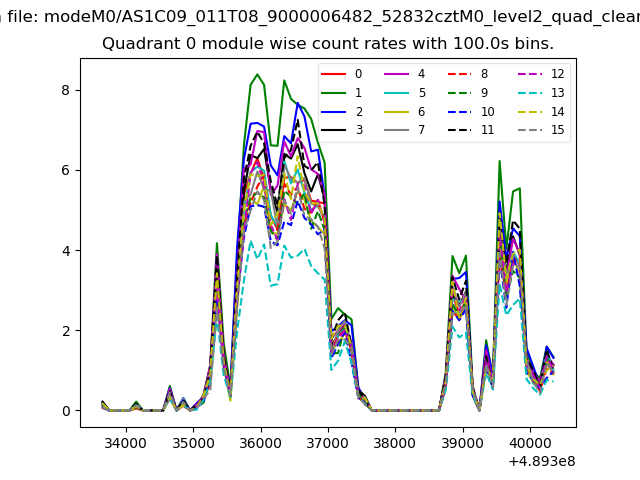 |
 |
| Module-wise count rates for Quadrant B Data is divided into 100 sec bins |
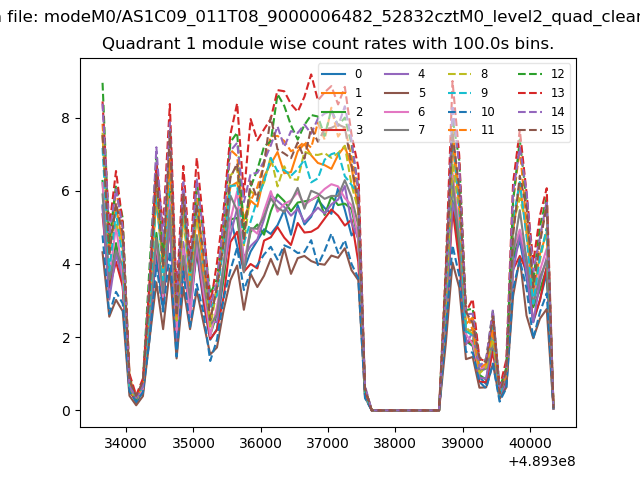 |
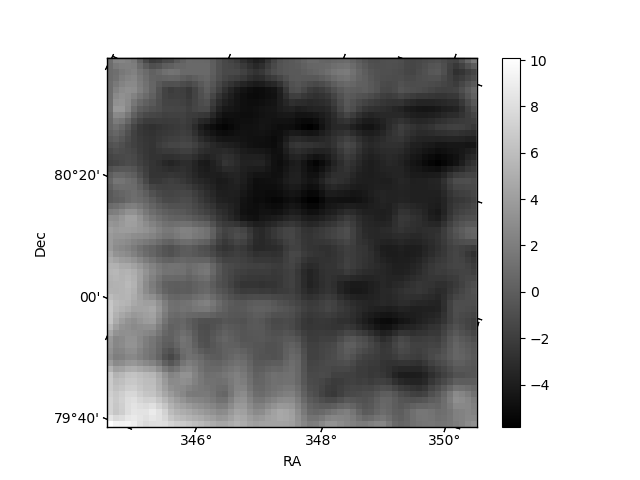 |
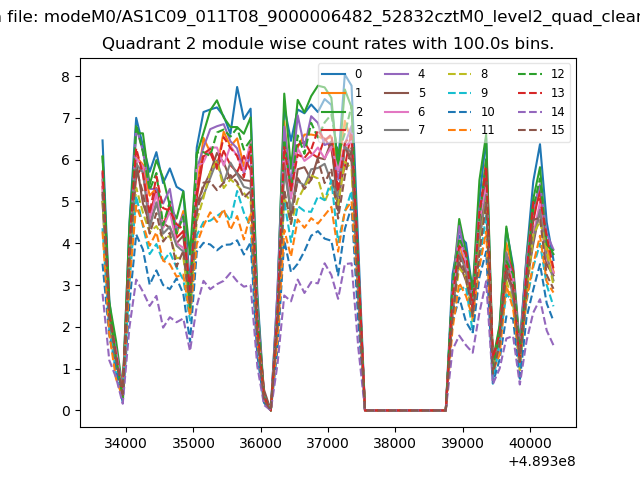
| Module-wise count rates for Quadrant C Data is divided into 100 sec bins |
 |
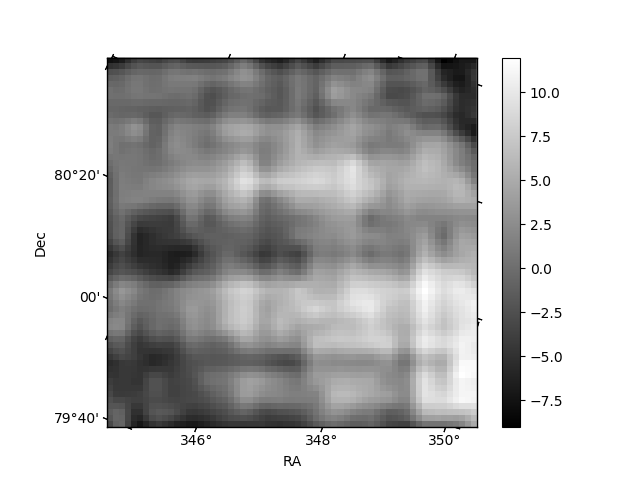 |
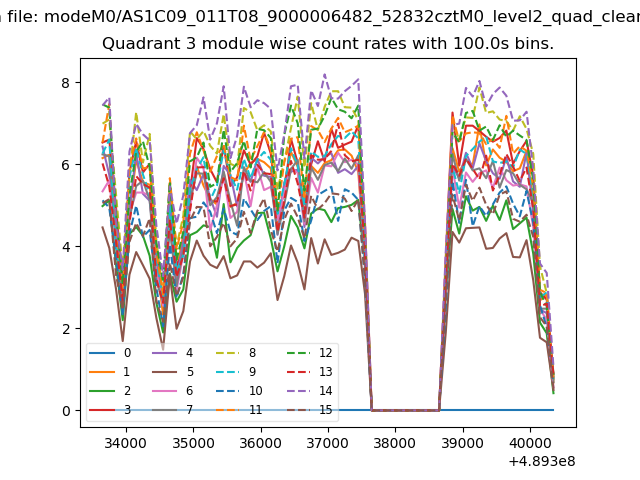
| Module-wise count rates for Quadrant D Data is divided into 100 sec bins |
 |
 |
| Parameter | Plot |
|---|---|
| CZT HV Monitor | 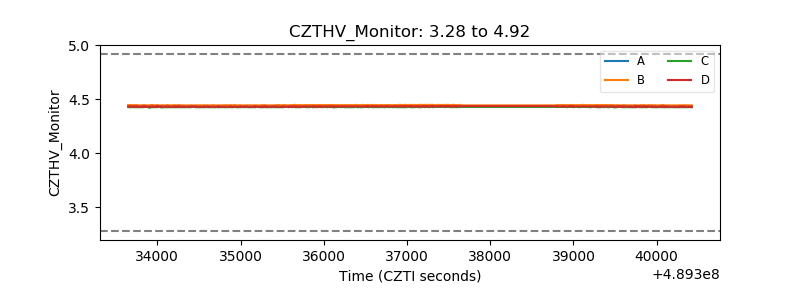 |
| D_VDD | 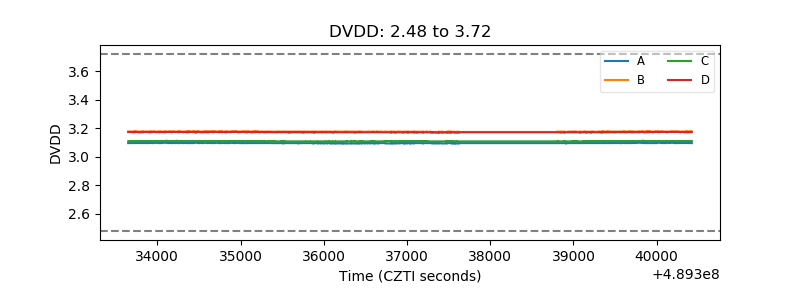 |
| Temperature 1 | 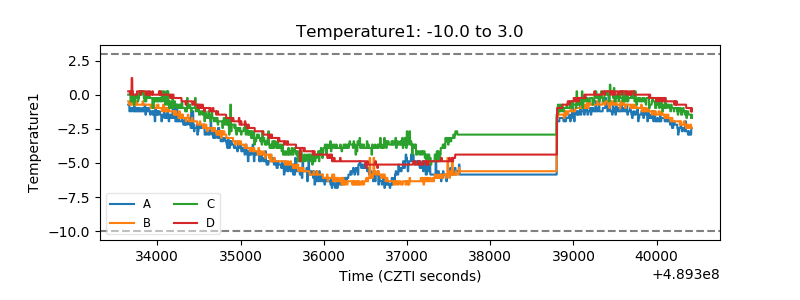 |
| Veto HV Monitor | 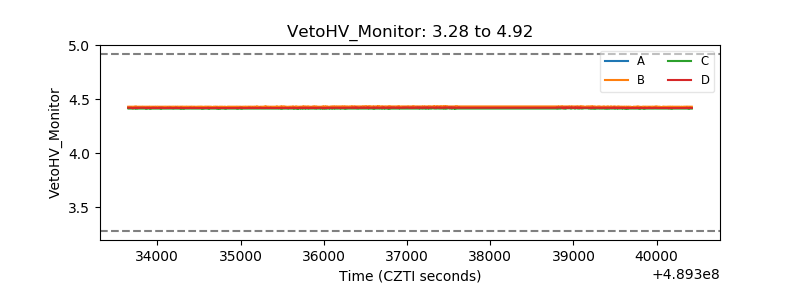 |
| Veto LLD | 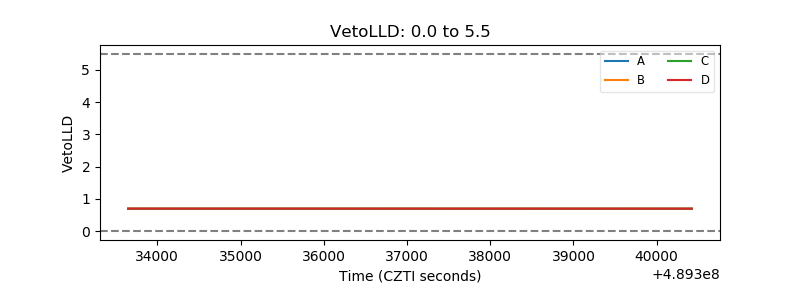 |
| Alpha Counter | 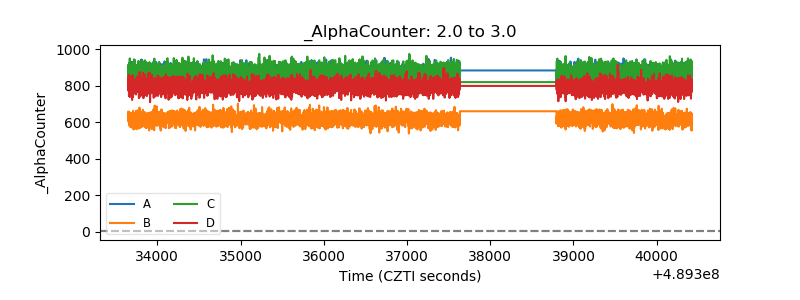 |
| _CPM_Rate | 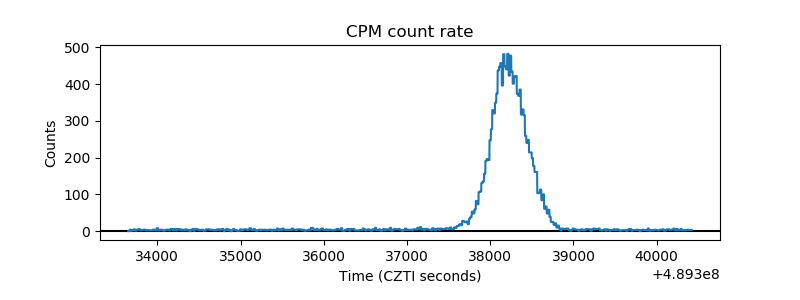 |
| CZT Counter | 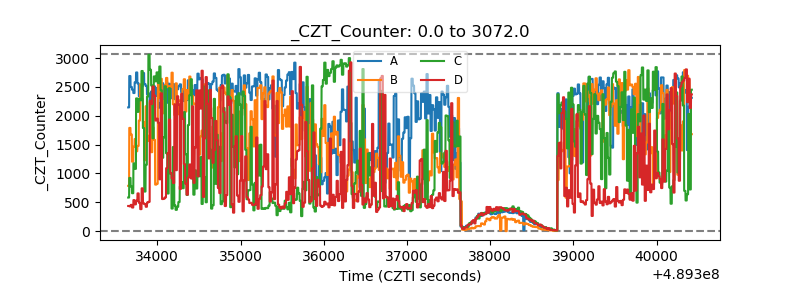 |
| +2.5 Volts monitor |  |
| +5 Volts monitor | 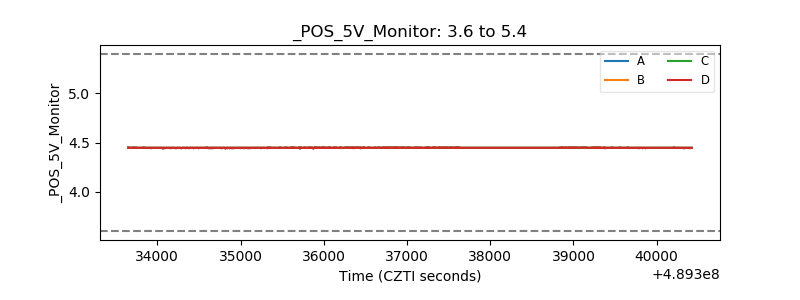 |
| _ROLL_ROT | 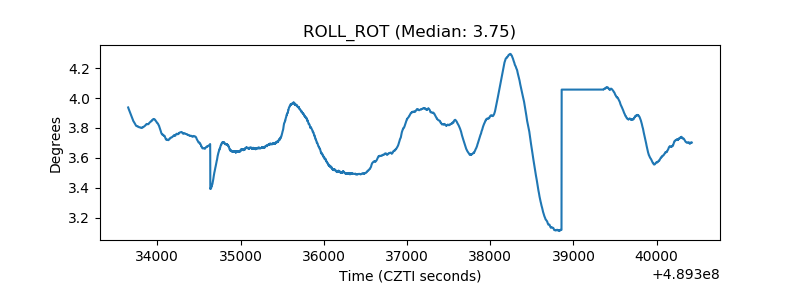 |
| _Roll_DEC | 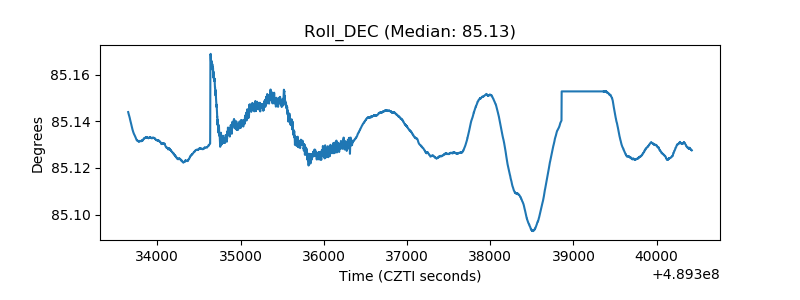 |
| _Roll_RA | 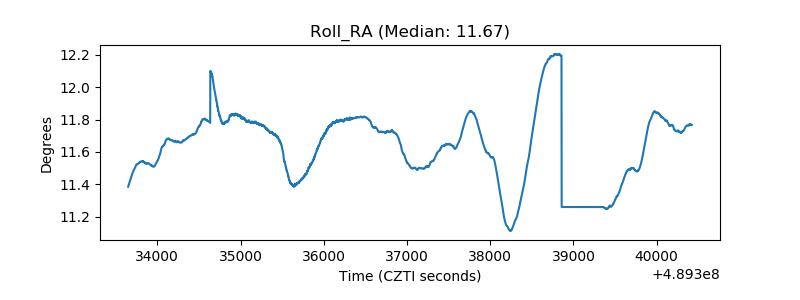 |
| Veto Counter | 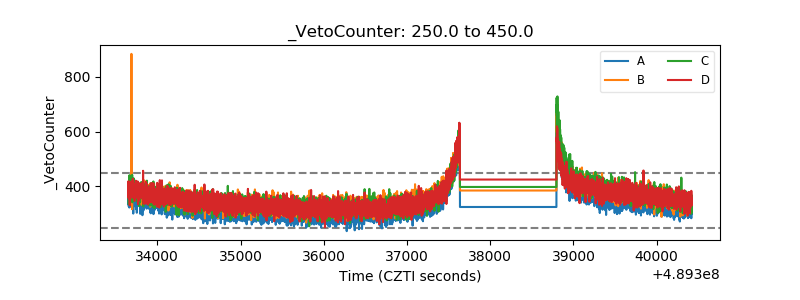 |