| Param | Original file | Final file |
|---|---|---|
| Filename | modeM0/AS1C09_011T08_9000006482_52835cztM0_level2.fits | modeM0/AS1C09_011T08_9000006482_52835cztM0_level2_quad_clean.evt |
| Size (bytes) | 927,722,880 | 91,267,200 |
| Size | 884.7 MB | 87.0 MB |
| Events in quadrant A | 9,874,970 | 562,670 |
| Events in quadrant B | 10,498,920 | 539,556 |
| Events in quadrant C | 7,035,695 | 558,247 |
| Events in quadrant D | 6,356,993 | 584,015 |
| Mode M0 | |||
|---|---|---|---|
| Quadrant | BADHDUFLAG | Total packets | Discarded packets |
| A | 0 | 34489 | 0 |
| B | 0 | 36366 | 1 |
| C | 0 | 26476 | 0 |
| D | 0 | 24104 | 0 |
| Mode SS | |||
|---|---|---|---|
| Quadrant | BADHDUFLAG | Total packets | Discarded packets |
| A | 0 | 150 | 0 |
| B | 0 | 150 | 0 |
| C | 0 | 150 | 0 |
| D | 0 | 150 | 0 |
| Quadrant | Total seconds | Saturated seconds | Saturation percentage |
|---|---|---|---|
| A | 7445 | 1894 | 25.439893% |
| B | 7444 | 2433 | 32.684041% |
| C | 7445 | 1450 | 19.476158% |
| D | 7445 | 790 | 10.611148% |
Noise dominated data is calculated using 1-second bins in cleaned event files. If a bin has >2000 counts, and if more than 50% of those come from <1% of pixels, then it is considered to be noise-dominated and hence unusable.
| Quadrant | # 1 sec bins | Bins with >0 counts | Bins with >2000 counts | High rate bins dominated by noise | Noise dominated (total time) | Noise dominated (detector-on time) | Marked lightcurve |
|---|---|---|---|---|---|---|---|
| A | 7445 | 7445 | 1586 | 1586 | 21.30% | 21.30% | 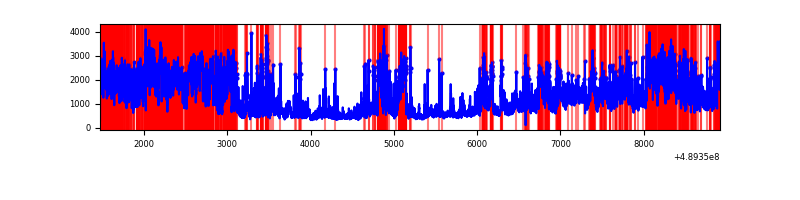 |
| B | 7444 | 7444 | 1745 | 1745 | 23.44% | 23.44% | 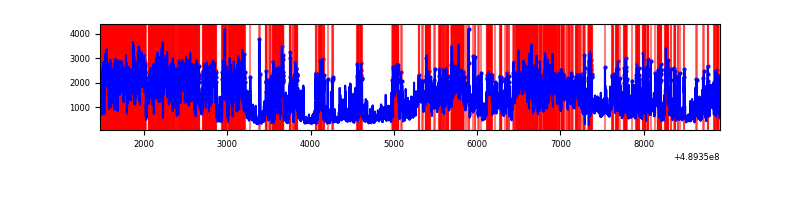 |
| C | 7445 | 7445 | 1067 | 1067 | 14.33% | 14.33% | 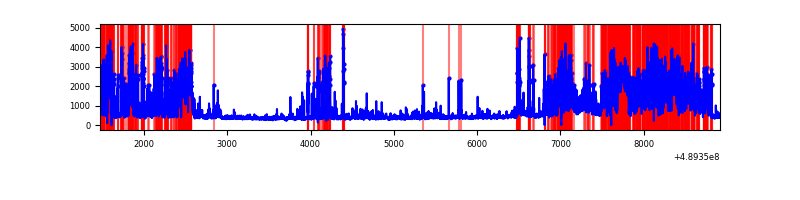 |
| D | 7445 | 7445 | 597 | 597 | 8.02% | 8.02% | 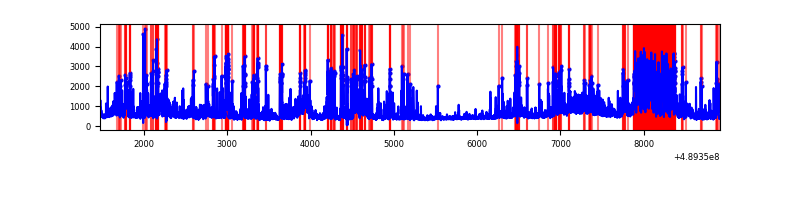 |
Top three noisy pixels from each quadrant. If the there are fewer than three noisy pixels in the level2.evt file, extra rows are filled as -1
| Pixel properties | Quadrant properties | ||||||
|---|---|---|---|---|---|---|---|
| Quadrant | DetID | PixID | Counts | Sigma | Mean | Median | Sigma |
| A | 9 | 191 | 3870021 | 21236.23 | 724 | 707 | 182.2 |
| A | 3 | 62 | 943709 | 5175.54 | 724 | 707 | 182.2 |
| A | 3 | 14 | 708448 | 3884.35 | 724 | 707 | 182.2 |
| B | 8 | 3 | 5320768 | 36157.85 | 697 | 672 | 147.1 |
| B | 10 | 254 | 1227017 | 8334.81 | 697 | 672 | 147.1 |
| B | 6 | 203 | 447163 | 3034.56 | 697 | 672 | 147.1 |
| C | 15 | 224 | 2835619 | 14506.01 | 699 | 690 | 195.4 |
| C | 4 | 5 | 435878 | 2226.81 | 699 | 690 | 195.4 |
| C | 2 | 12 | 353479 | 1805.18 | 699 | 690 | 195.4 |
| D | 12 | 17 | 1045162 | 5007.01 | 732 | 699 | 208.6 |
| D | 3 | 224 | 778429 | 3728.33 | 732 | 699 | 208.6 |
| D | 8 | 176 | 499419 | 2390.79 | 732 | 699 | 208.6 |
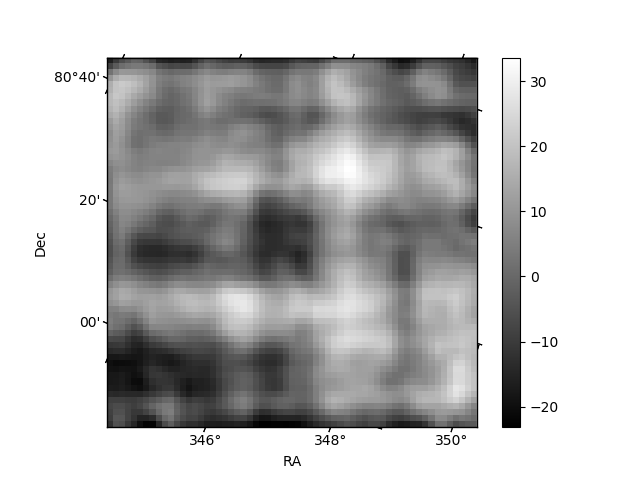
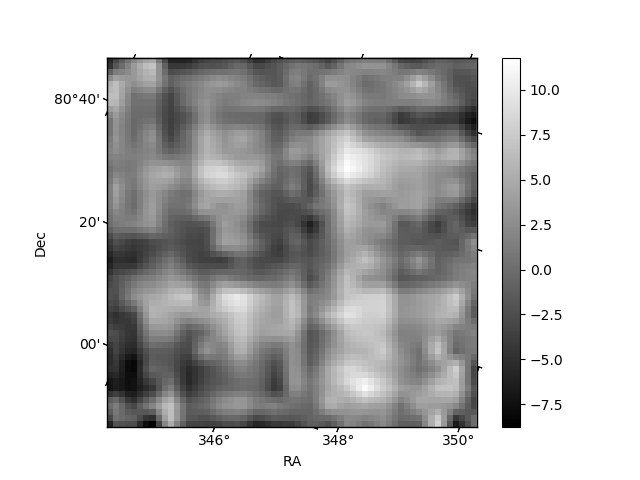
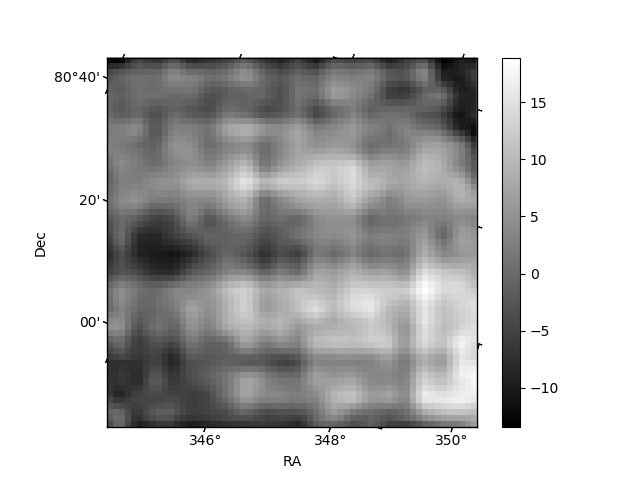
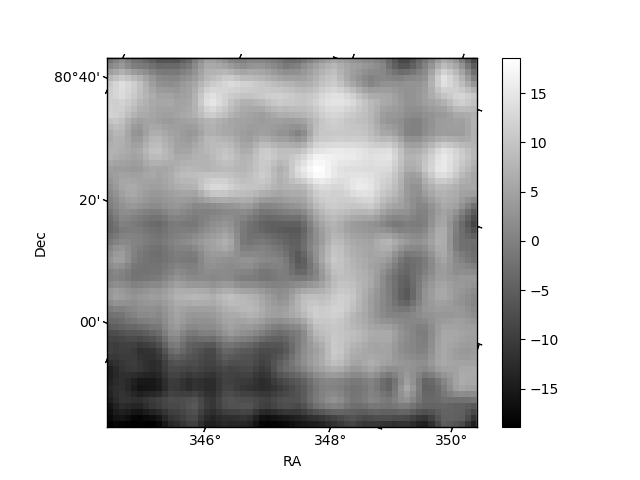
Histogram calculated using DETX and DETY for each event in the final _common_clean file
| Quadrant A | 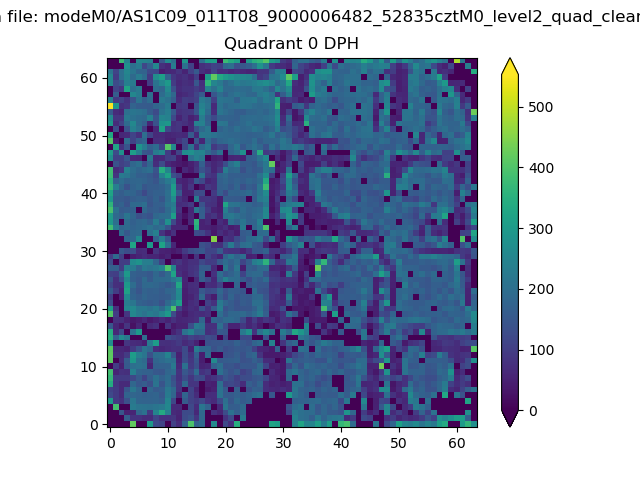 |
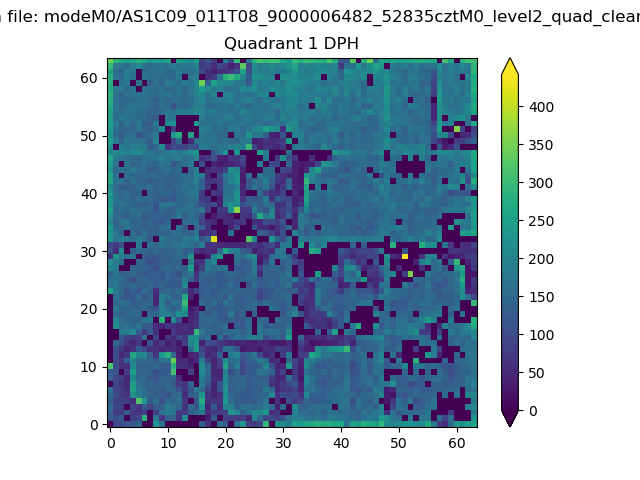 |
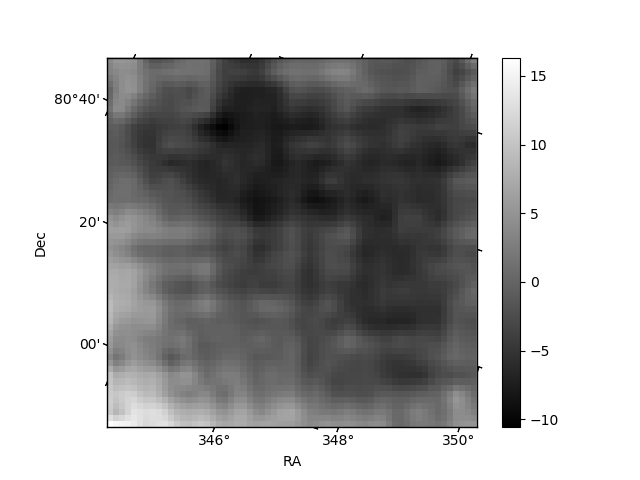
Quadrant B |
|---|---|---|---|
| Quadrant D | 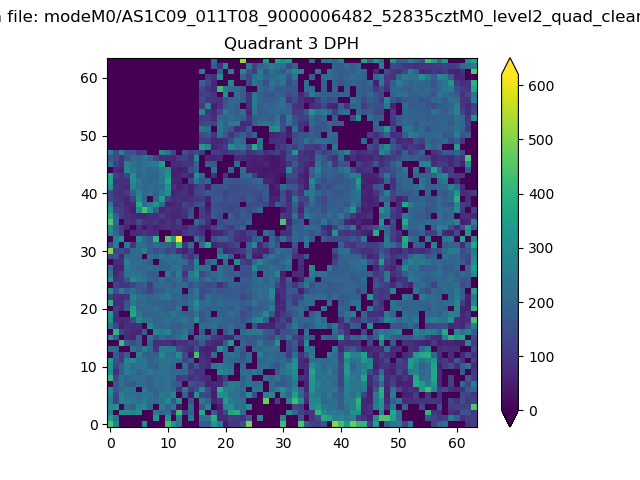 |
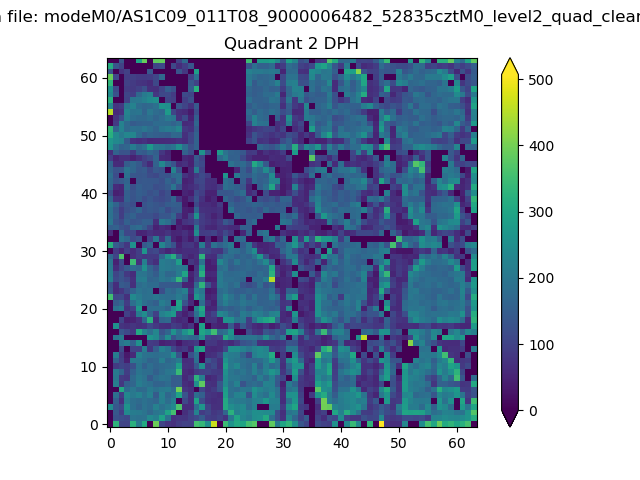 |
Quadrant C |
| Plot type | Count rate plots | Images |
|---|---|---|
| Comparison with Poisson distribution Blue bars denote a histogram of data divided into 1 sec bins. Red curve is a Poisson curve with rate = median count rate of data. |
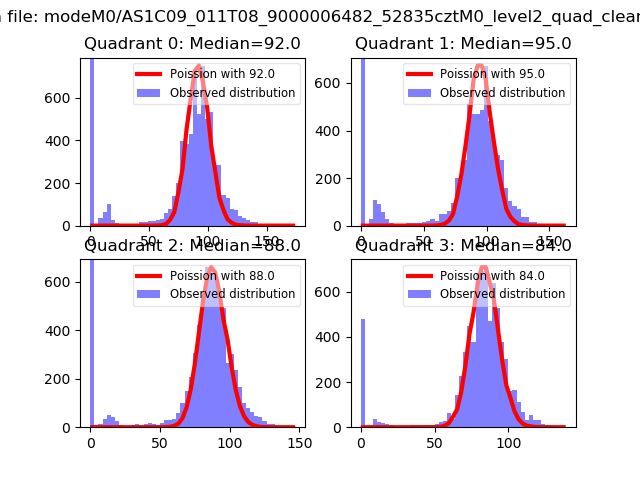 |
 |
| Quadrant-wise count rates Data is divided into 100 sec bins |
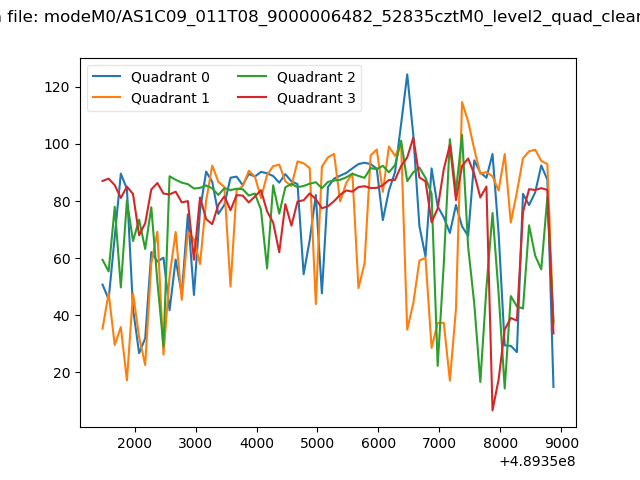 |
|
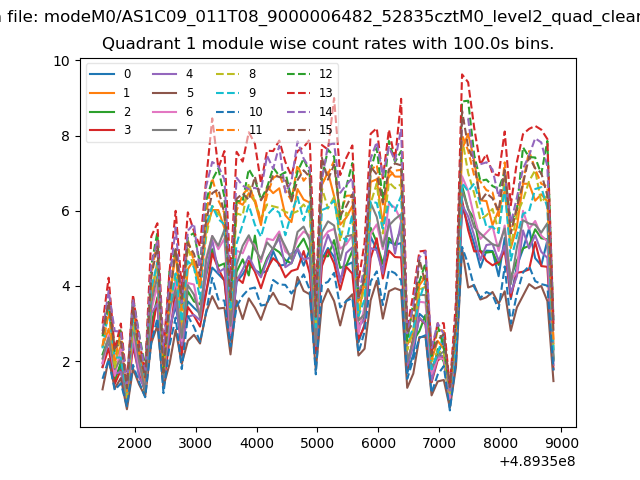
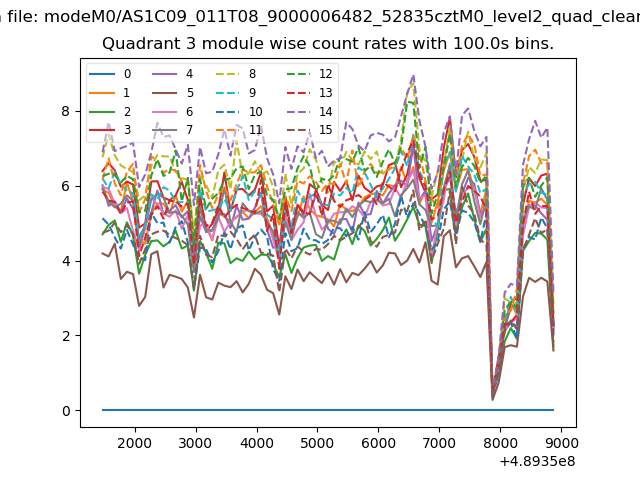
| Module-wise count rates for Quadrant A Data is divided into 100 sec bins |
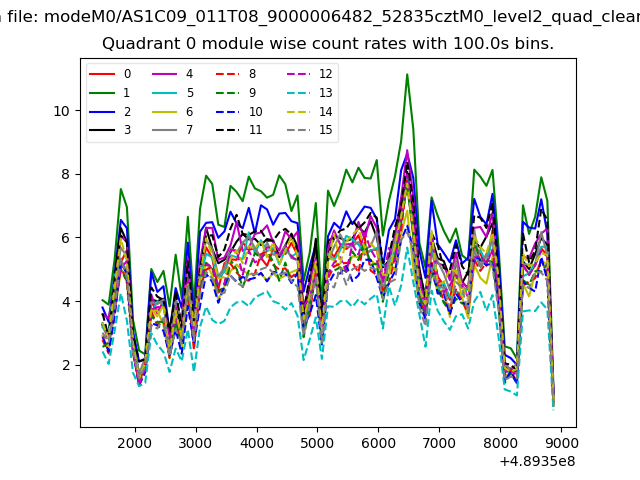 |
 |
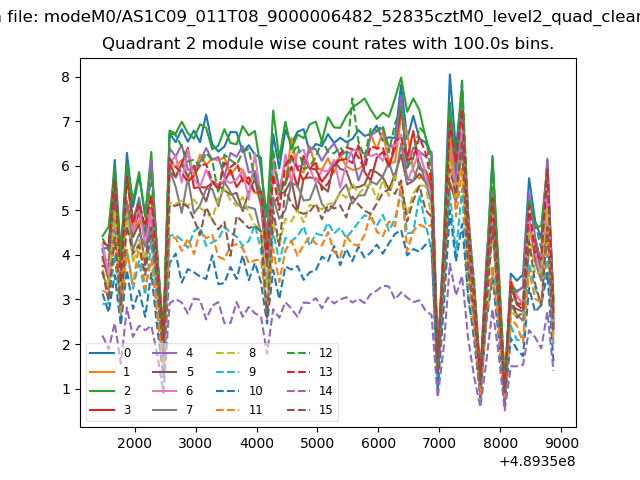
| Module-wise count rates for Quadrant B Data is divided into 100 sec bins |
 |
 |
| Module-wise count rates for Quadrant C Data is divided into 100 sec bins |
 |
 |
| Module-wise count rates for Quadrant D Data is divided into 100 sec bins |
 |
 |
| Parameter | Plot |
|---|---|
| CZT HV Monitor | 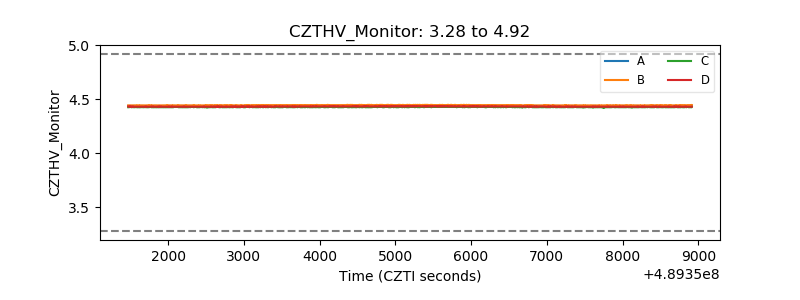 |
| D_VDD | 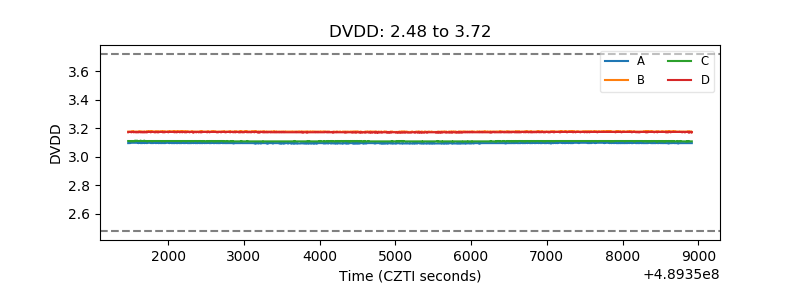 |
| Temperature 1 | 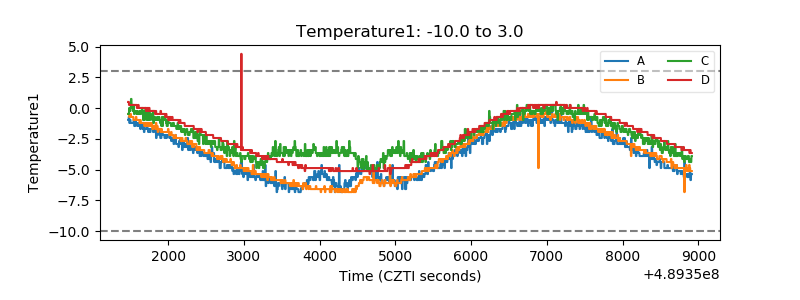 |
| Veto HV Monitor | 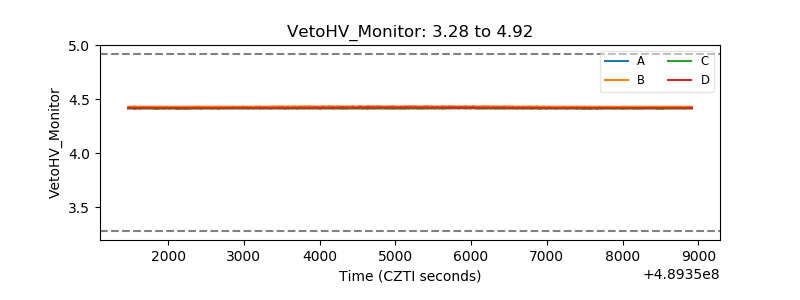 |
| Veto LLD | 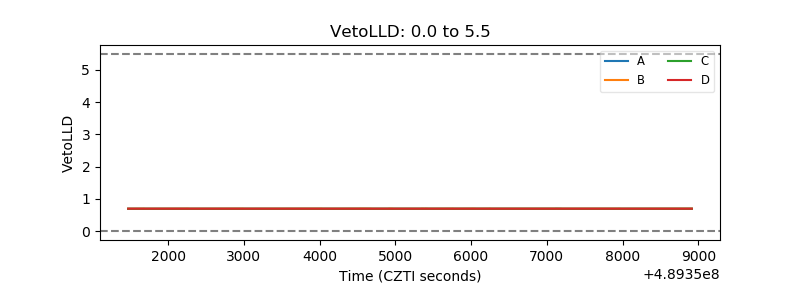 |
| Alpha Counter | 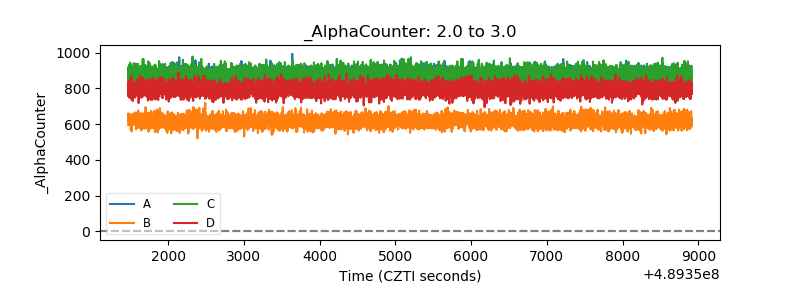 |
| _CPM_Rate | 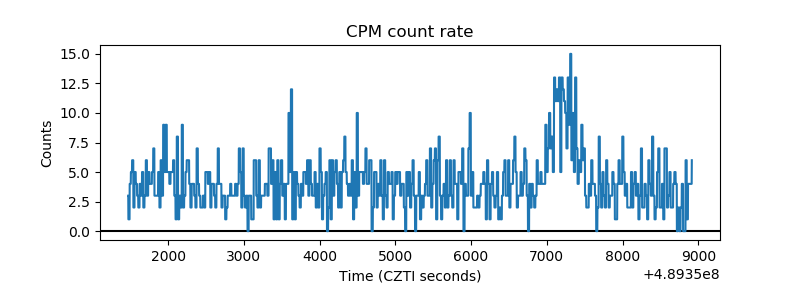 |
| CZT Counter | 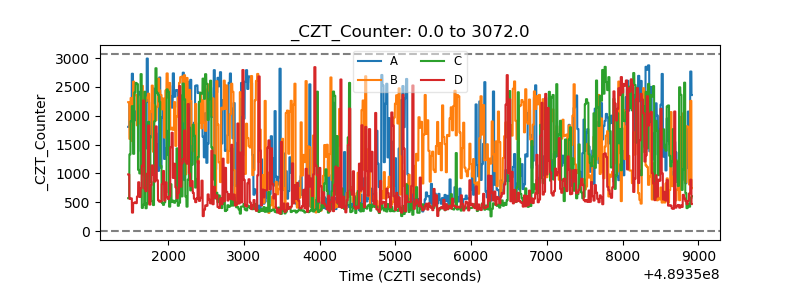 |
| +2.5 Volts monitor | 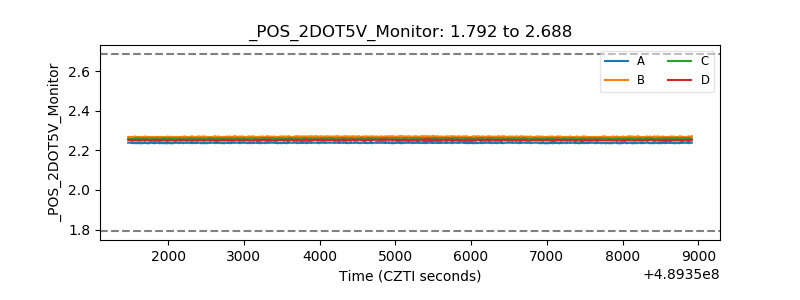 |
| +5 Volts monitor |  |
| _ROLL_ROT | 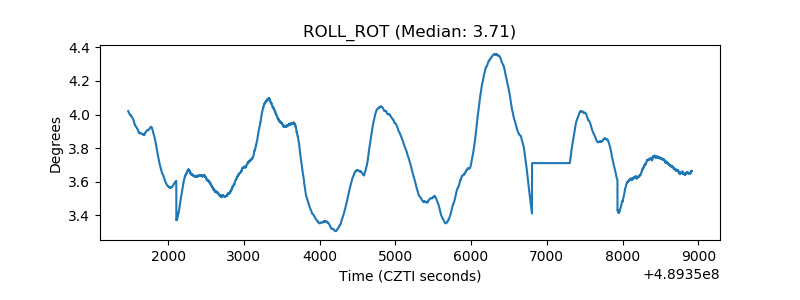 |
| _Roll_DEC | 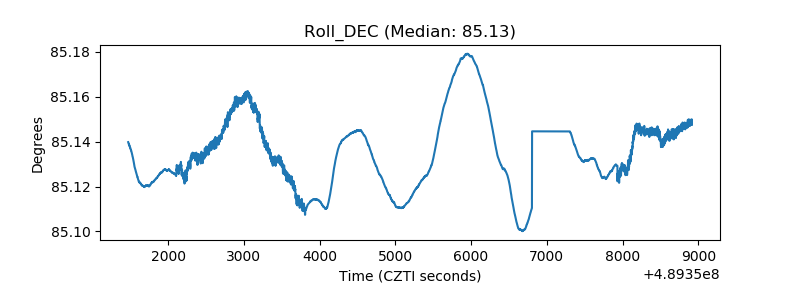 |
| _Roll_RA | 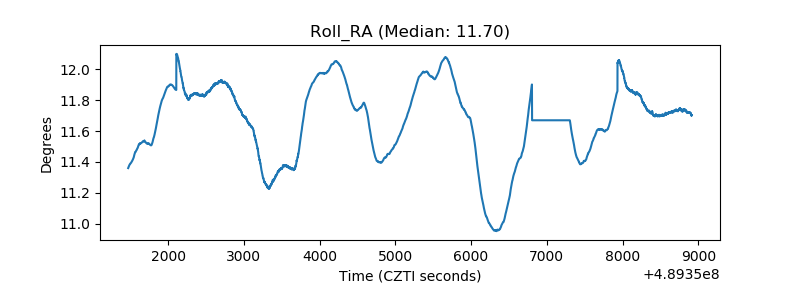 |
| Veto Counter | 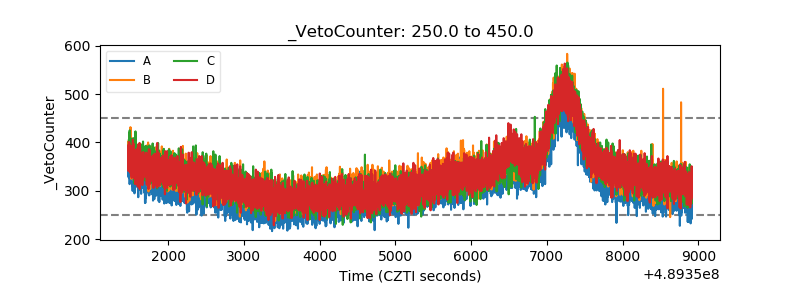 |