| Param | Original file | Final file |
|---|---|---|
| Filename | modeM0/AS1C09_011T08_9000006482_52840cztM0_level2.fits | modeM0/AS1C09_011T08_9000006482_52840cztM0_level2_quad_clean.evt |
| Size (bytes) | 1,975,605,120 | 233,758,080 |
| Size | 1.8 GB | 222.9 MB |
| Events in quadrant A | 18,478,502 | 1,522,481 |
| Events in quadrant B | 22,014,438 | 1,423,898 |
| Events in quadrant C | 10,211,661 | 1,582,894 |
| Events in quadrant D | 20,996,641 | 1,267,290 |
| Mode M0 | |||
|---|---|---|---|
| Quadrant | BADHDUFLAG | Total packets | Discarded packets |
| A | 0 | 67861 | 3 |
| B | 0 | 78355 | 8 |
| C | 0 | 44461 | 3 |
| D | 0 | 75417 | 3 |
| Mode M9 | |||
|---|---|---|---|
| Quadrant | BADHDUFLAG | Total packets | Discarded packets |
| A | 0 | 13 | 0 |
| B | 0 | 13 | 0 |
| C | 0 | 13 | 0 |
| D | 0 | 13 | 0 |
| Mode SS | |||
|---|---|---|---|
| Quadrant | BADHDUFLAG | Total packets | Discarded packets |
| A | 0 | 378 | 0 |
| B | 0 | 378 | 0 |
| C | 0 | 378 | 0 |
| D | 0 | 378 | 0 |
| Quadrant | Total seconds | Saturated seconds | Saturation percentage |
|---|---|---|---|
| A | 18556 | 2266 | 12.211684% |
| B | 18556 | 4133 | 22.273119% |
| C | 18556 | 467 | 2.516706% |
| D | 18556 | 3432 | 18.495365% |
Noise dominated data is calculated using 1-second bins in cleaned event files. If a bin has >2000 counts, and if more than 50% of those come from <1% of pixels, then it is considered to be noise-dominated and hence unusable.
| Quadrant | # 1 sec bins | Bins with >0 counts | Bins with >2000 counts | High rate bins dominated by noise | Noise dominated (total time) | Noise dominated (detector-on time) | Marked lightcurve |
|---|---|---|---|---|---|---|---|
| A | 19951 | 18559 | 2055 | 2055 | 10.30% | 11.07% | 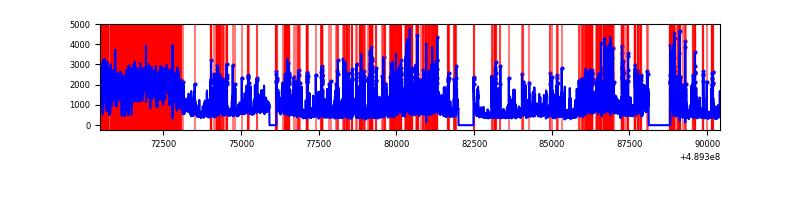 |
| B | 19951 | 18559 | 2928 | 2928 | 14.68% | 15.78% | 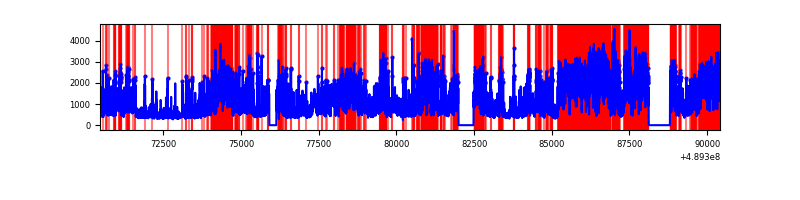 |
| C | 19951 | 18559 | 333 | 333 | 1.67% | 1.79% | 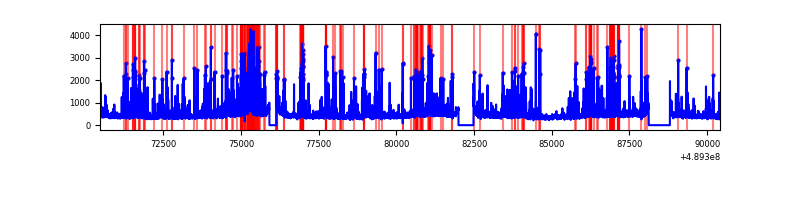 |
| D | 19951 | 18559 | 3113 | 3113 | 15.60% | 16.77% | 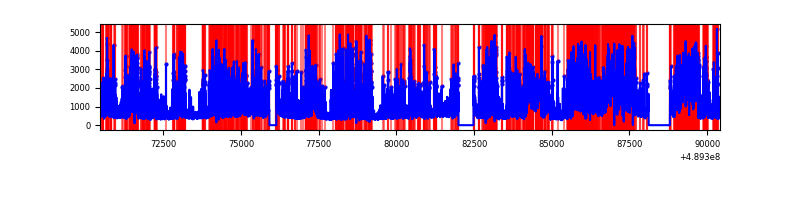 |
Top three noisy pixels from each quadrant. If the there are fewer than three noisy pixels in the level2.evt file, extra rows are filled as -1
| Pixel properties | Quadrant properties | ||||||
|---|---|---|---|---|---|---|---|
| Quadrant | DetID | PixID | Counts | Sigma | Mean | Median | Sigma |
| A | 9 | 191 | 5631391 | 12047.26 | 1864 | 1819 | 467.3 |
| A | 3 | 62 | 1890551 | 4041.88 | 1864 | 1819 | 467.3 |
| A | 4 | 238 | 1096429 | 2342.46 | 1864 | 1819 | 467.3 |
| B | 8 | 3 | 11578448 | 31028.08 | 1760 | 1703 | 373.1 |
| B | 10 | 254 | 1425169 | 3815.18 | 1760 | 1703 | 373.1 |
| B | 1 | 239 | 554001 | 1480.27 | 1760 | 1703 | 373.1 |
| C | 15 | 224 | 1066254 | 2084.23 | 1855 | 1835 | 510.7 |
| C | 12 | 249 | 805120 | 1572.91 | 1855 | 1835 | 510.7 |
| C | 4 | 5 | 263937 | 513.22 | 1855 | 1835 | 510.7 |
| D | 8 | 176 | 6920215 | 14154.91 | 1708 | 1631 | 488.8 |
| D | 12 | 17 | 2217946 | 4534.42 | 1708 | 1631 | 488.8 |
| D | 3 | 224 | 977788 | 1997.14 | 1708 | 1631 | 488.8 |
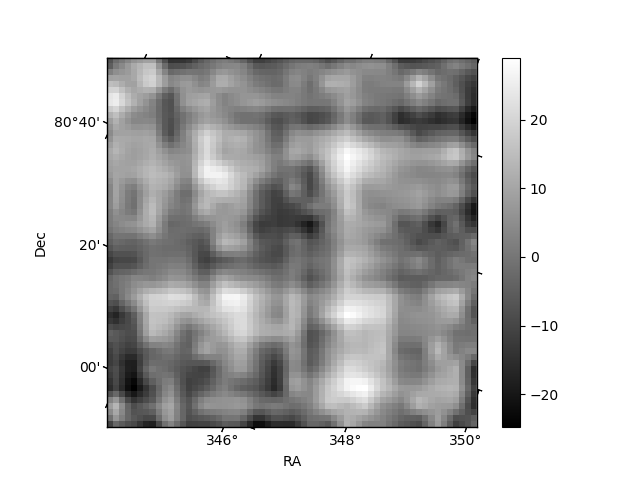
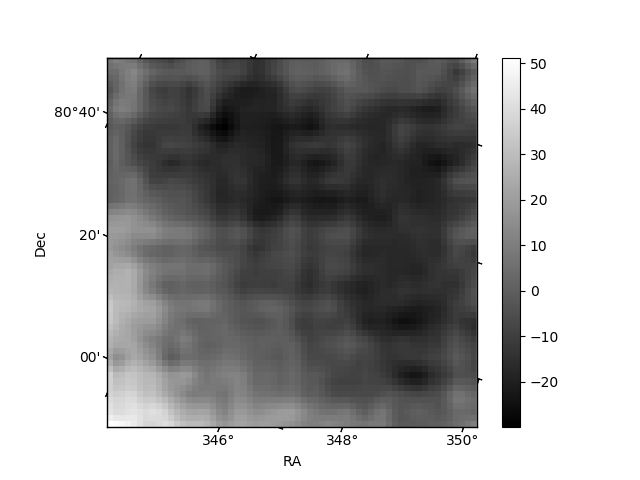
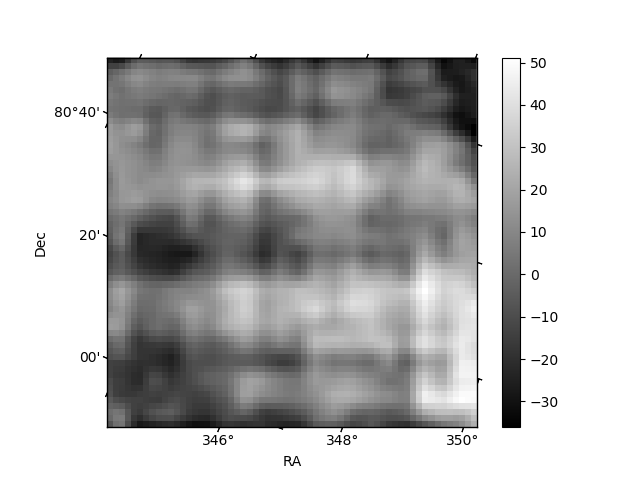
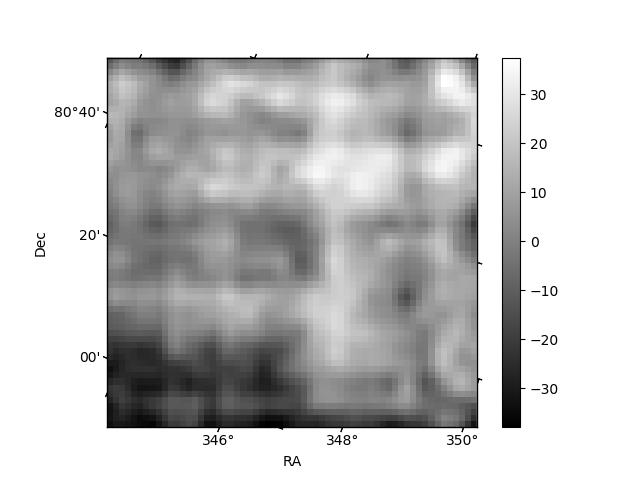
Histogram calculated using DETX and DETY for each event in the final _common_clean file
| Quadrant A | 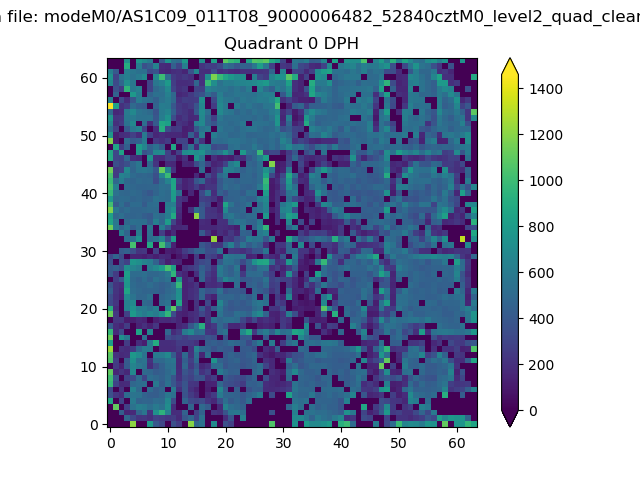 |
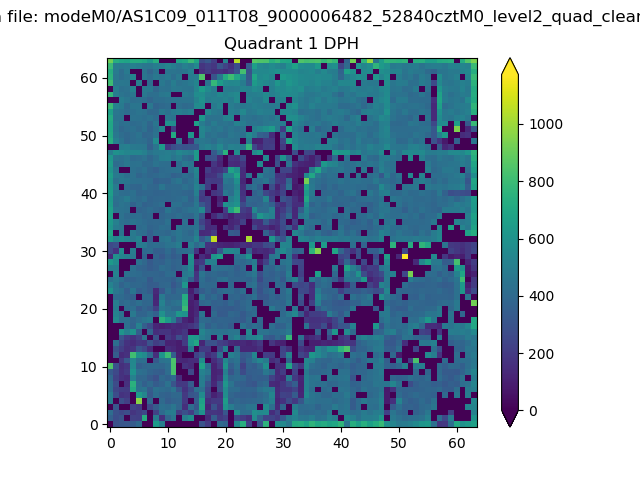 |
Quadrant B |
|---|---|---|---|
| Quadrant D | 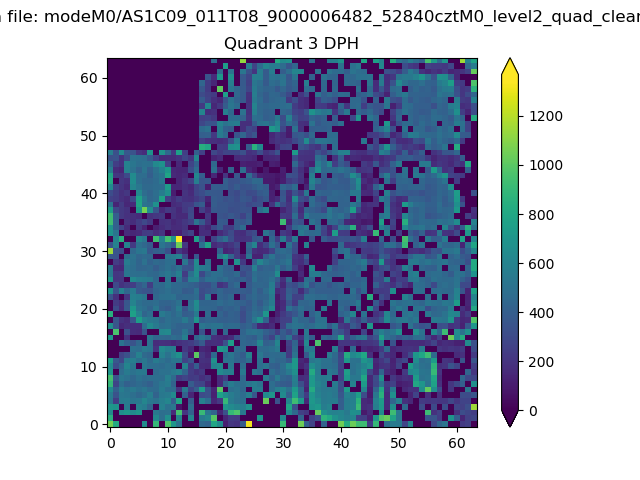 |
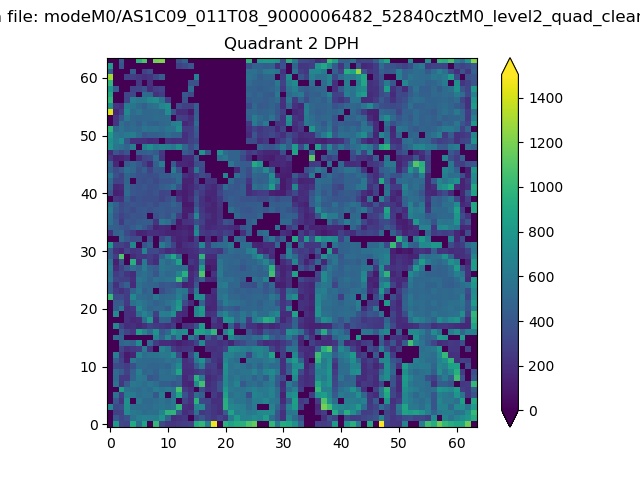 |
Quadrant C |
| Plot type | Count rate plots | Images |
|---|---|---|
| Comparison with Poisson distribution Blue bars denote a histogram of data divided into 1 sec bins. Red curve is a Poisson curve with rate = median count rate of data. |
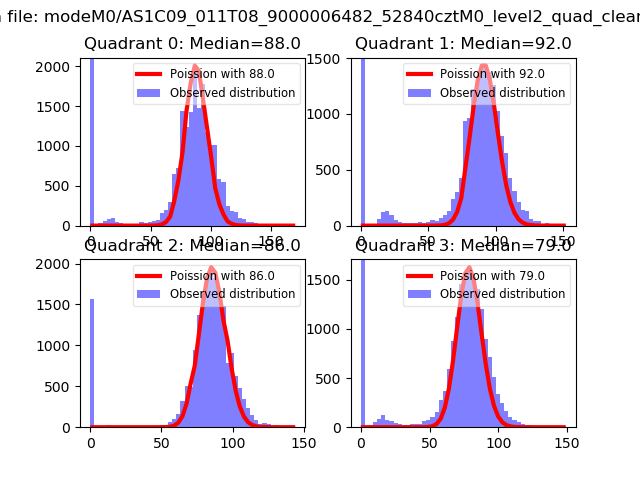 |
 |
| Quadrant-wise count rates Data is divided into 100 sec bins |
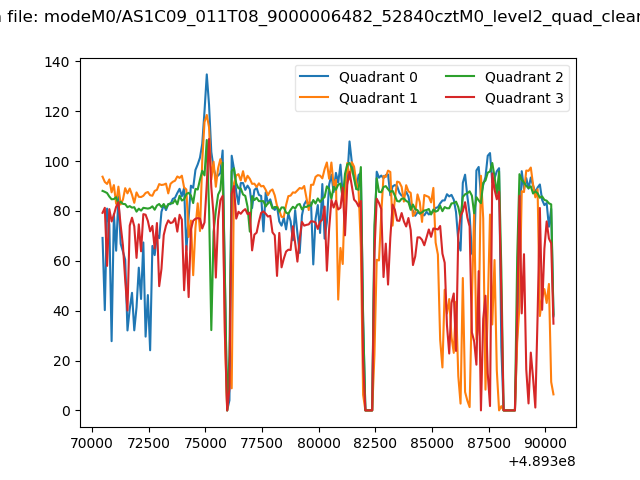 |
|
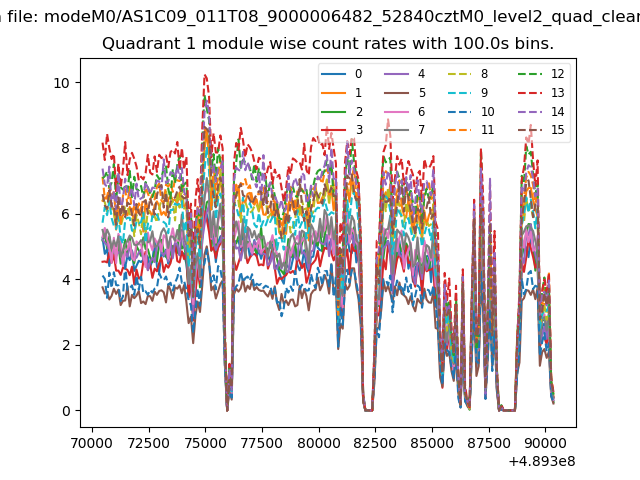
| Module-wise count rates for Quadrant A Data is divided into 100 sec bins |
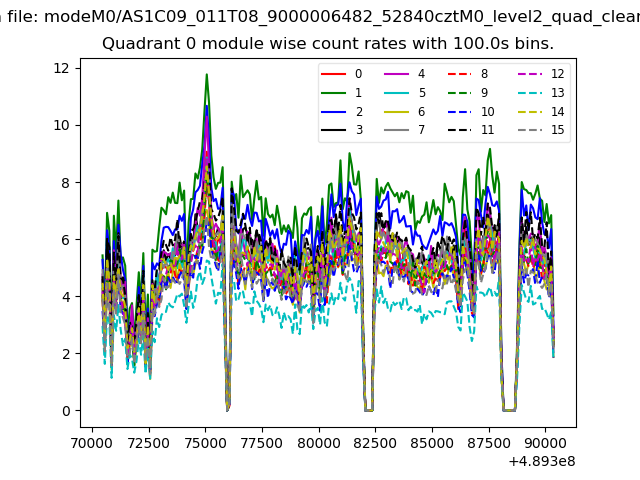 |
 |
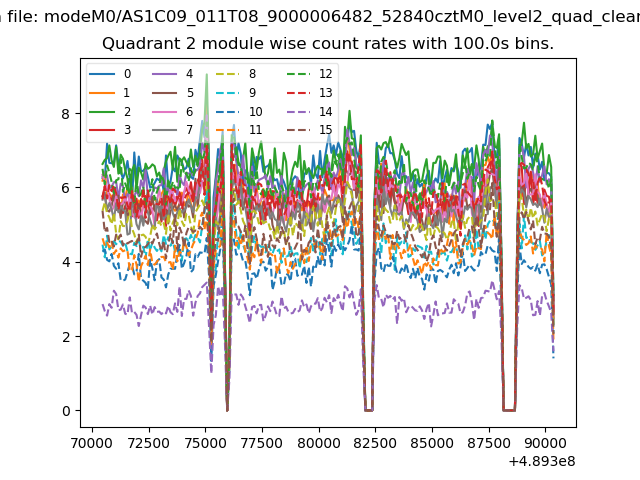
| Module-wise count rates for Quadrant B Data is divided into 100 sec bins |
 |
 |
| Module-wise count rates for Quadrant C Data is divided into 100 sec bins |
 |
 |
| Module-wise count rates for Quadrant D Data is divided into 100 sec bins |
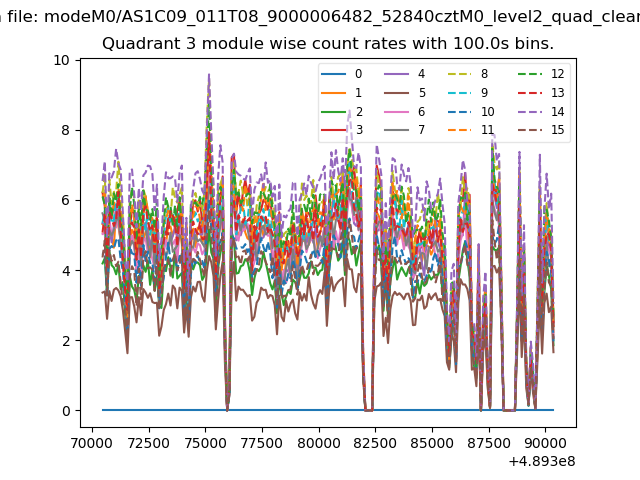 |
 |
| Parameter | Plot |
|---|---|
| CZT HV Monitor | 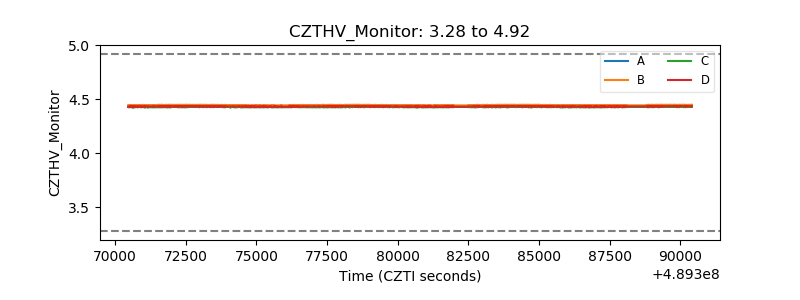 |
| D_VDD | 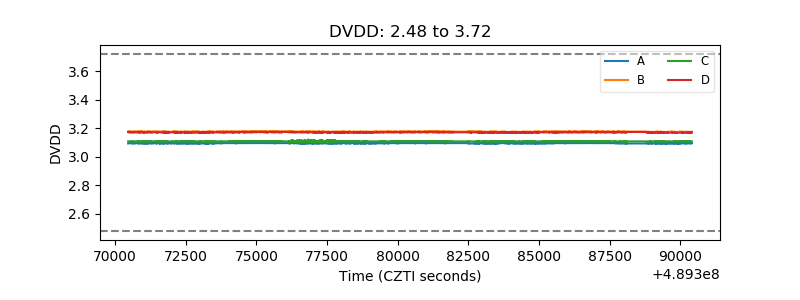 |
| Temperature 1 | 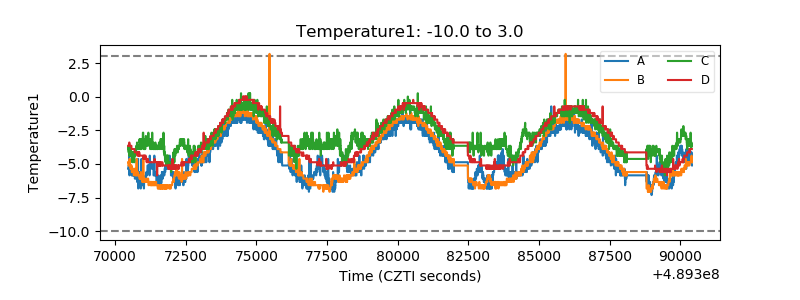 |
| Veto HV Monitor | 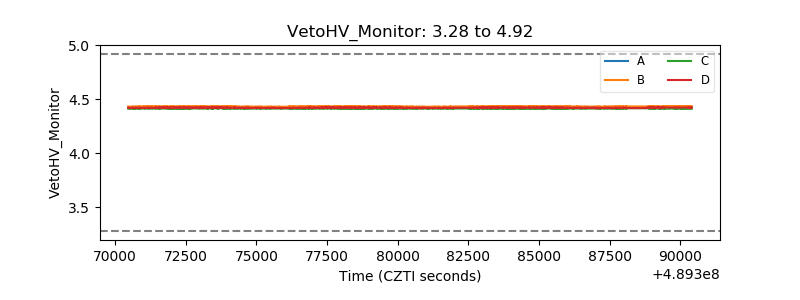 |
| Veto LLD | 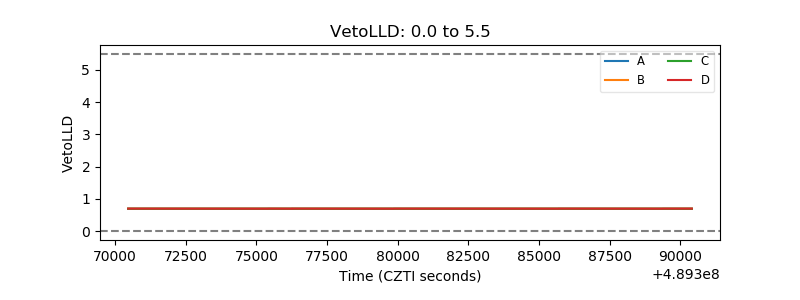 |
| Alpha Counter |  |
| _CPM_Rate | 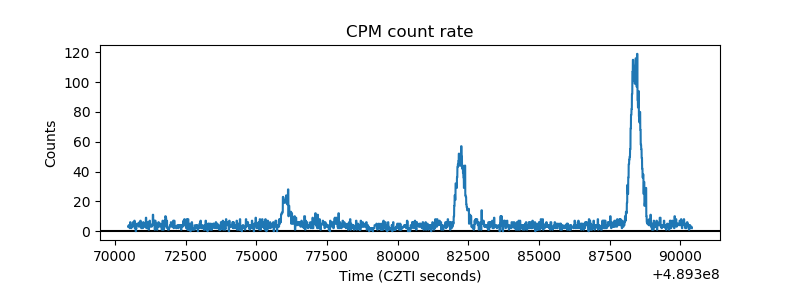 |
| CZT Counter | 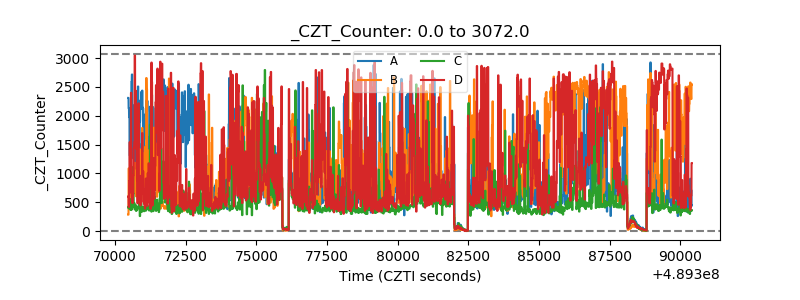 |
| +2.5 Volts monitor | 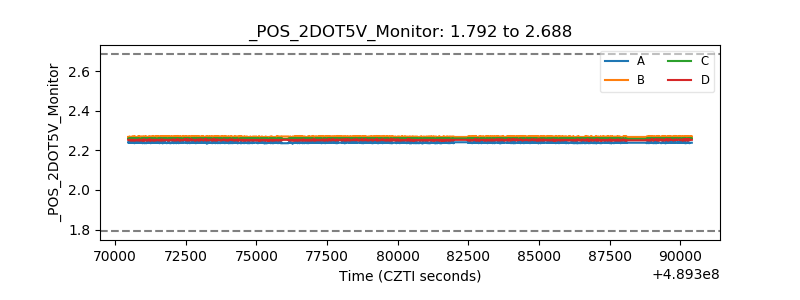 |
| +5 Volts monitor | 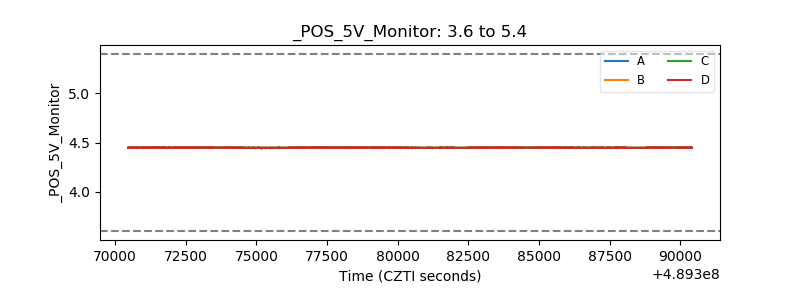 |
| _ROLL_ROT |  |
| _Roll_DEC | 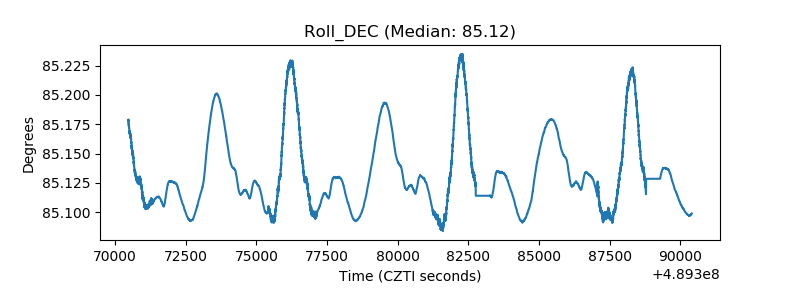 |
| _Roll_RA | 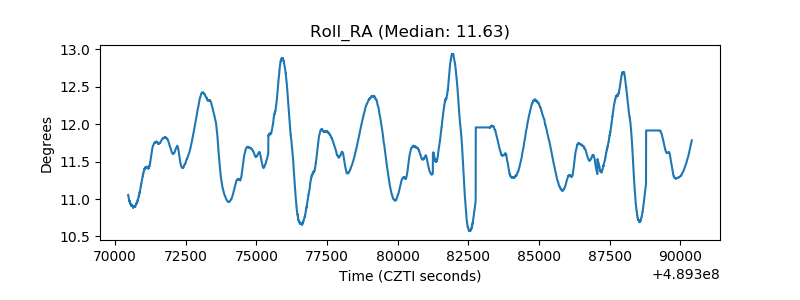 |
| Veto Counter | 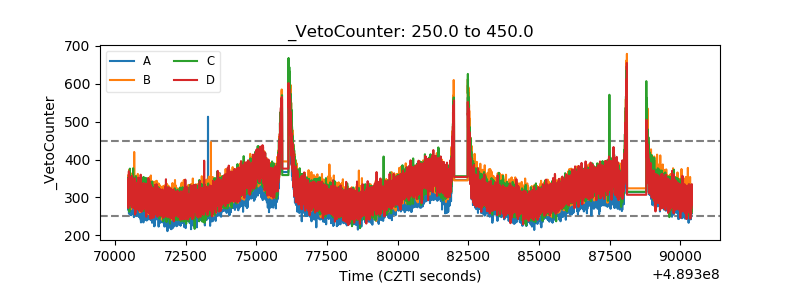 |