| Param | Original file | Final file |
|---|---|---|
| Filename | modeM0/AS1C09_011T08_9000006482_52843cztM0_level2.fits | modeM0/AS1C09_011T08_9000006482_52843cztM0_level2_quad_clean.evt |
| Size (bytes) | 608,022,720 | 83,381,760 |
| Size | 579.9 MB | 79.5 MB |
| Events in quadrant A | 6,305,348 | 549,522 |
| Events in quadrant B | 5,529,477 | 582,635 |
| Events in quadrant C | 4,834,048 | 488,829 |
| Events in quadrant D | 5,378,390 | 488,502 |
| Mode M0 | |||
|---|---|---|---|
| Quadrant | BADHDUFLAG | Total packets | Discarded packets |
| A | 0 | 22942 | 1 |
| B | 0 | 20455 | 1 |
| C | 0 | 18873 | 1 |
| D | 0 | 20114 | 2 |
| Mode M9 | |||
|---|---|---|---|
| Quadrant | BADHDUFLAG | Total packets | Discarded packets |
| A | 0 | 10 | 0 |
| B | 0 | 10 | 0 |
| C | 0 | 10 | 0 |
| D | 0 | 10 | 0 |
| Mode SS | |||
|---|---|---|---|
| Quadrant | BADHDUFLAG | Total packets | Discarded packets |
| A | 0 | 120 | 0 |
| B | 0 | 120 | 0 |
| C | 0 | 120 | 0 |
| D | 0 | 120 | 0 |
| Quadrant | Total seconds | Saturated seconds | Saturation percentage |
|---|---|---|---|
| A | 5941 | 556 | 9.358694% |
| B | 5942 | 515 | 8.667115% |
| C | 5942 | 825 | 13.884214% |
| D | 5941 | 650 | 10.940919% |
Noise dominated data is calculated using 1-second bins in cleaned event files. If a bin has >2000 counts, and if more than 50% of those come from <1% of pixels, then it is considered to be noise-dominated and hence unusable.
| Quadrant | # 1 sec bins | Bins with >0 counts | Bins with >2000 counts | High rate bins dominated by noise | Noise dominated (total time) | Noise dominated (detector-on time) | Marked lightcurve |
|---|---|---|---|---|---|---|---|
| A | 6961 | 5942 | 459 | 459 | 6.59% | 7.72% | 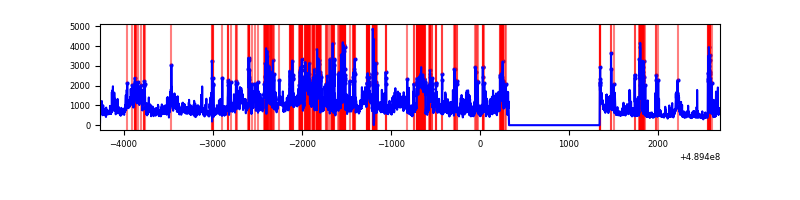 |
| B | 6962 | 5943 | 347 | 347 | 4.98% | 5.84% | 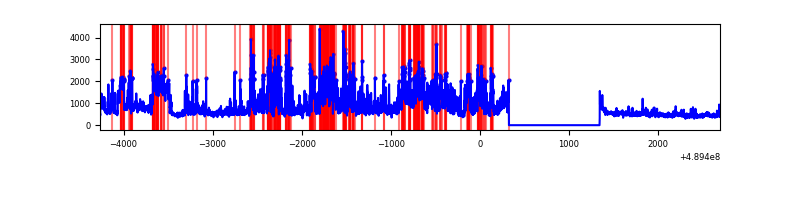 |
| C | 6962 | 5943 | 659 | 659 | 9.47% | 11.09% | 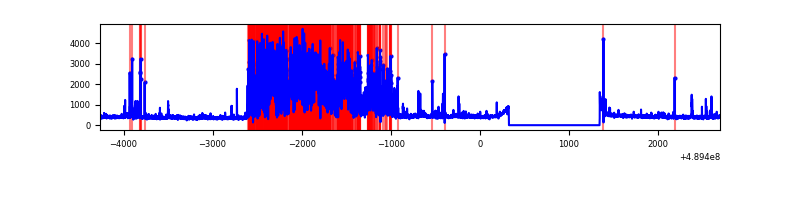 |
| D | 6961 | 5942 | 555 | 555 | 7.97% | 9.34% | 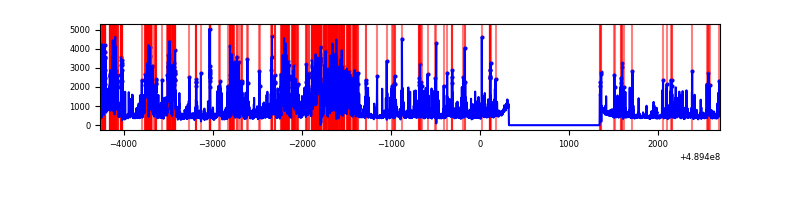 |
Top three noisy pixels from each quadrant. If the there are fewer than three noisy pixels in the level2.evt file, extra rows are filled as -1
| Pixel properties | Quadrant properties | ||||||
|---|---|---|---|---|---|---|---|
| Quadrant | DetID | PixID | Counts | Sigma | Mean | Median | Sigma |
| A | 9 | 191 | 1546166 | 10104.33 | 609 | 596 | 153.0 |
| A | 3 | 62 | 703661 | 4596.36 | 609 | 596 | 153.0 |
| A | 12 | 80 | 525919 | 3434.35 | 609 | 596 | 153.0 |
| B | 8 | 3 | 1658543 | 12940.1 | 603 | 583 | 128.1 |
| B | 5 | 172 | 831470 | 6484.93 | 603 | 583 | 128.1 |
| B | 10 | 254 | 117842 | 915.19 | 603 | 583 | 128.1 |
| C | 15 | 224 | 2193313 | 13927.23 | 567 | 562 | 157.4 |
| C | 15 | 147 | 117942 | 745.54 | 567 | 562 | 157.4 |
| C | 12 | 249 | 66955 | 421.69 | 567 | 562 | 157.4 |
| D | 8 | 176 | 2312096 | 13634.14 | 582 | 556 | 169.5 |
| D | 7 | 96 | 123386 | 724.49 | 582 | 556 | 169.5 |
| D | 11 | 176 | 101613 | 596.06 | 582 | 556 | 169.5 |
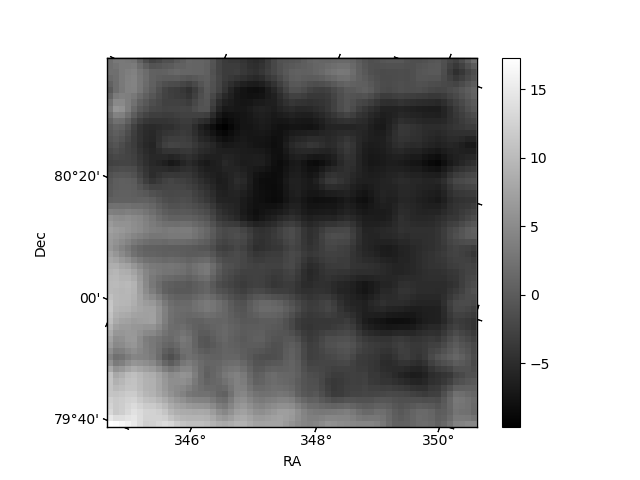
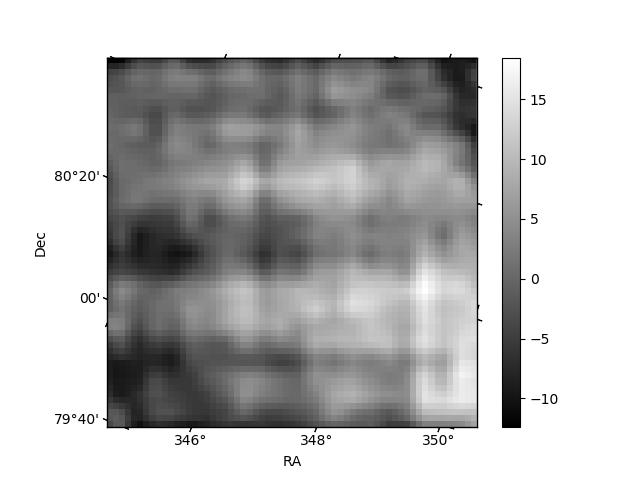
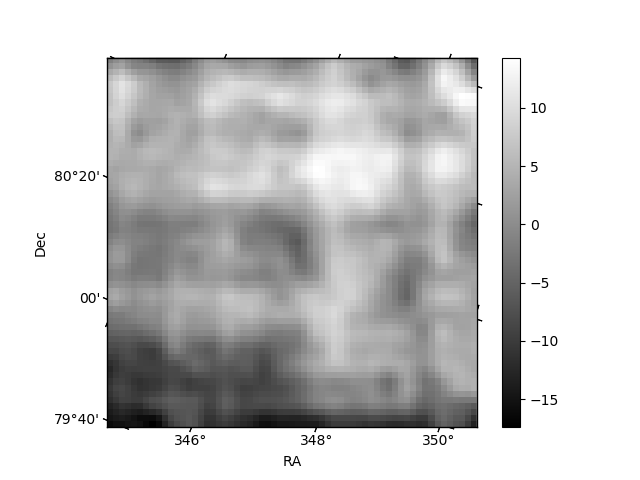
Histogram calculated using DETX and DETY for each event in the final _common_clean file
| Quadrant A | 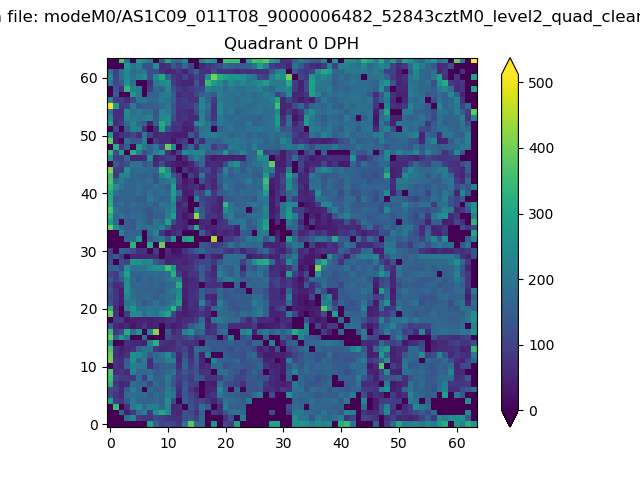 |
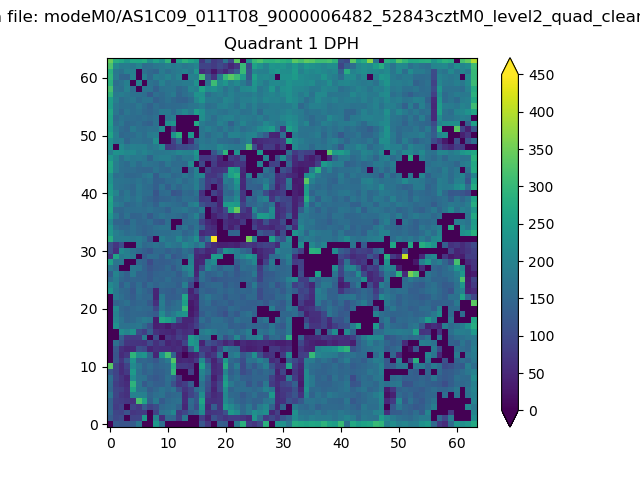 |
Quadrant B |
|---|---|---|---|
| Quadrant D | 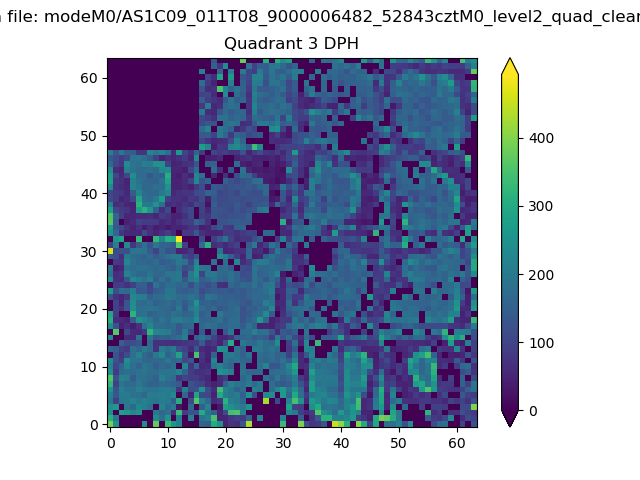 |
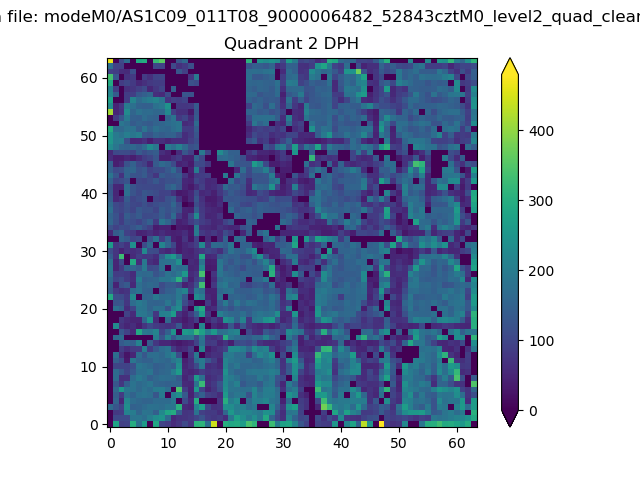 |
Quadrant C |
| Plot type | Count rate plots | Images |
|---|---|---|
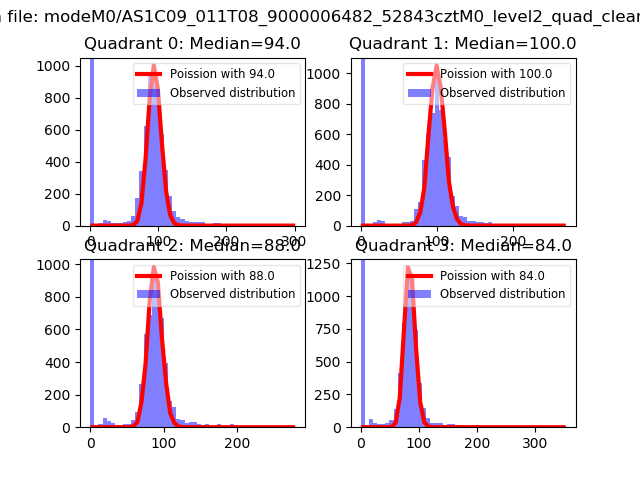
| Comparison with Poisson distribution Blue bars denote a histogram of data divided into 1 sec bins. Red curve is a Poisson curve with rate = median count rate of data. |
 |
 |
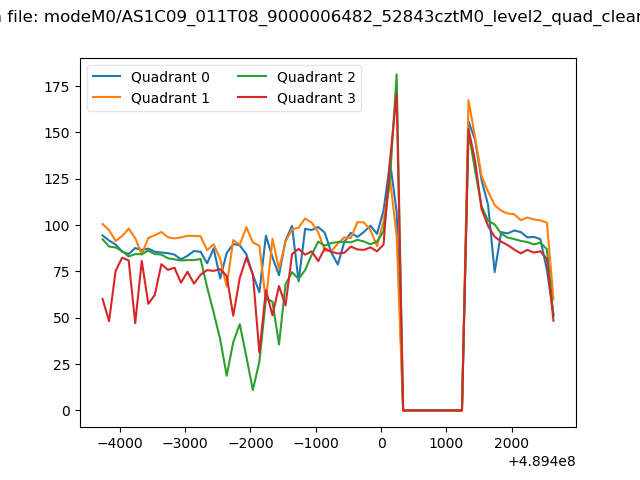
| Quadrant-wise count rates Data is divided into 100 sec bins |
 |
|
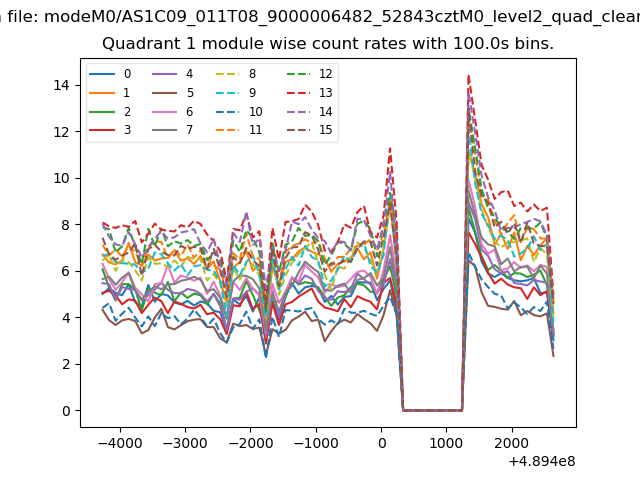
| Module-wise count rates for Quadrant A Data is divided into 100 sec bins |
 |
 |
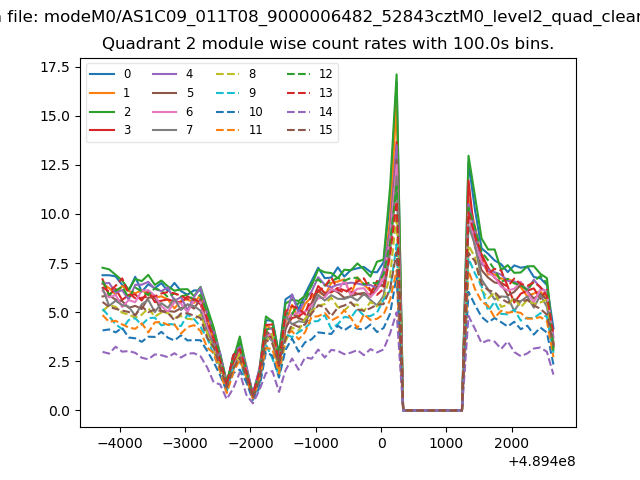
| Module-wise count rates for Quadrant B Data is divided into 100 sec bins |
 |
 |
| Module-wise count rates for Quadrant C Data is divided into 100 sec bins |
 |
 |
| Module-wise count rates for Quadrant D Data is divided into 100 sec bins |
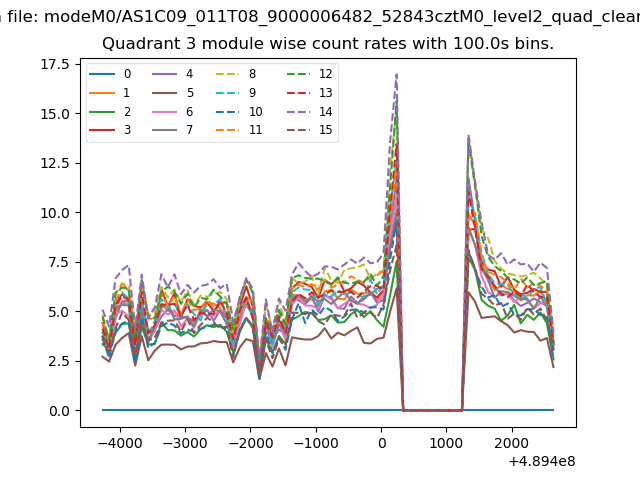 |
 |
| Parameter | Plot |
|---|---|
| CZT HV Monitor | 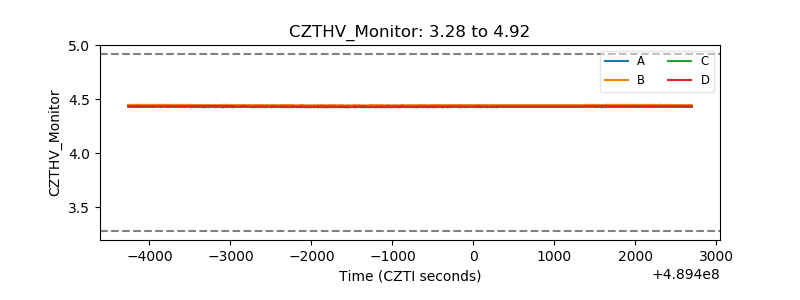 |
| D_VDD | 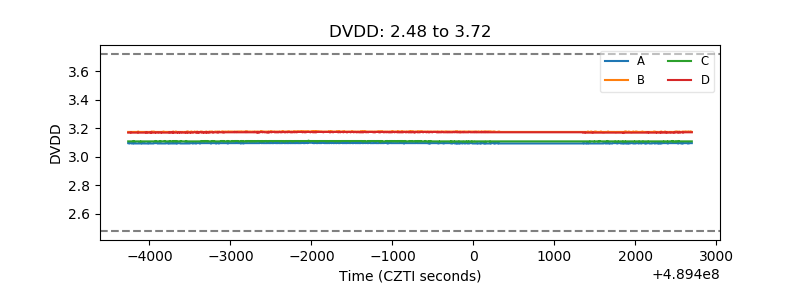 |
| Temperature 1 | 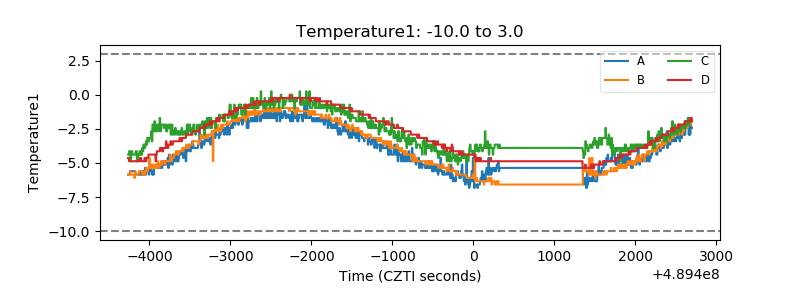 |
| Veto HV Monitor | 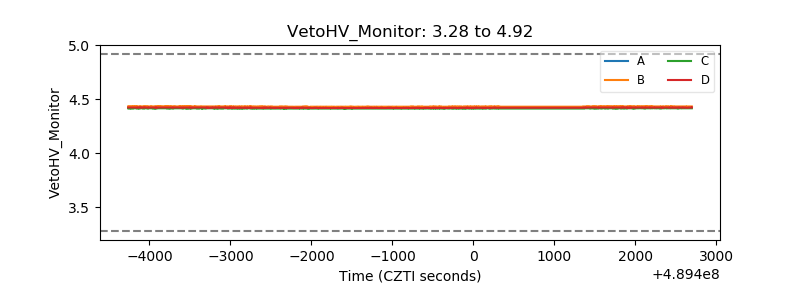 |
| Veto LLD | 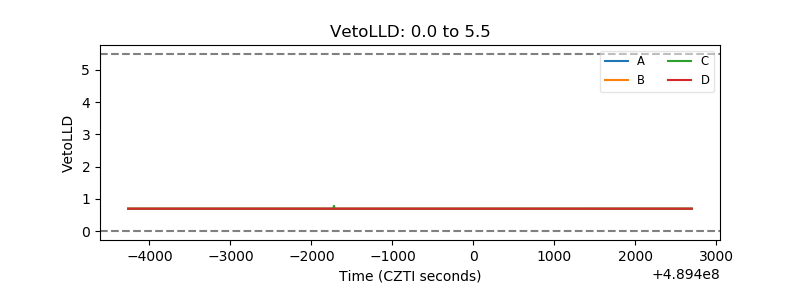 |
| Alpha Counter | 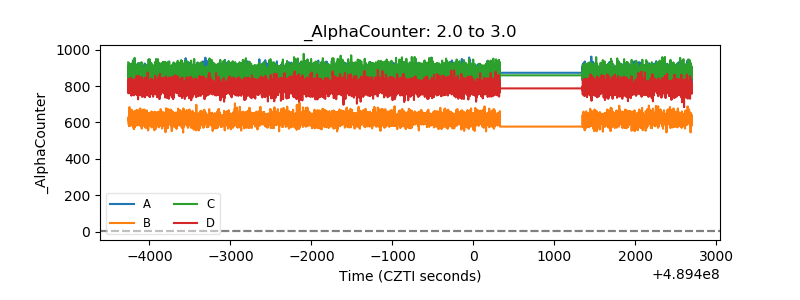 |
| _CPM_Rate | 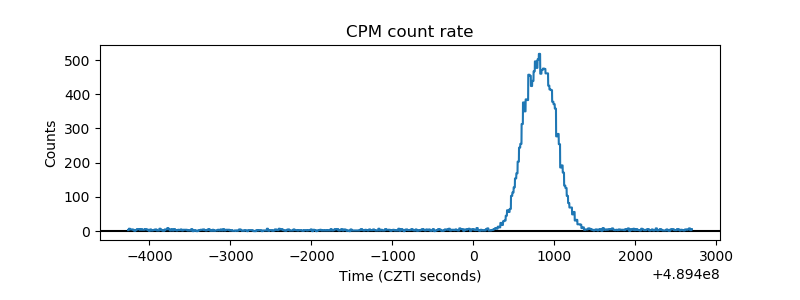 |
| CZT Counter | 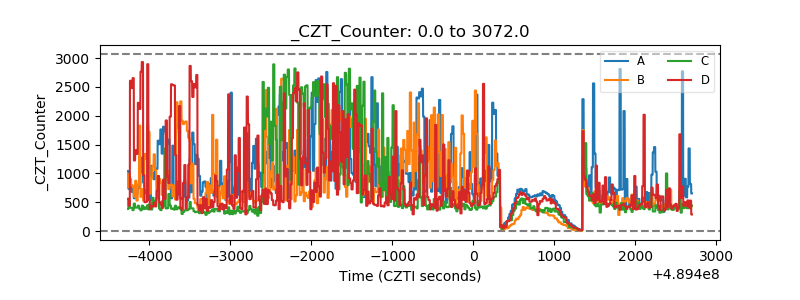 |
| +2.5 Volts monitor |  |
| +5 Volts monitor | 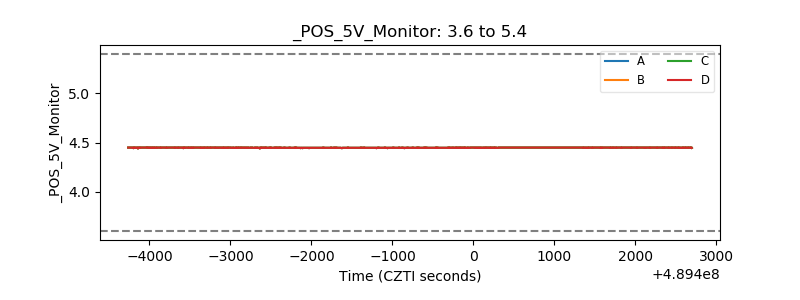 |
| _ROLL_ROT | 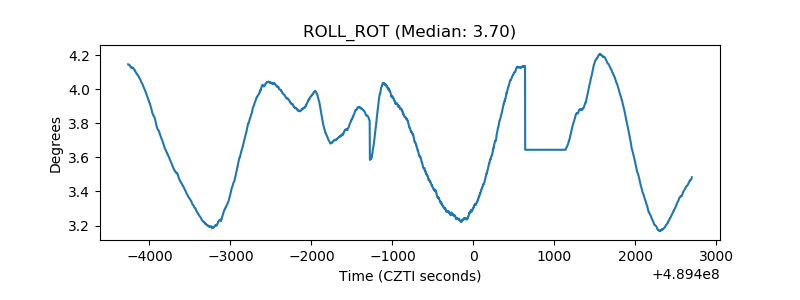 |
| _Roll_DEC | 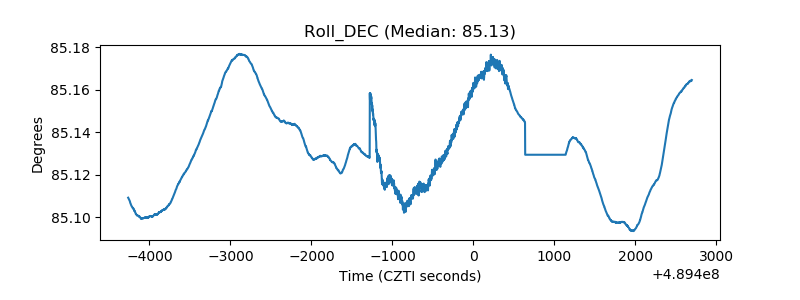 |
| _Roll_RA | 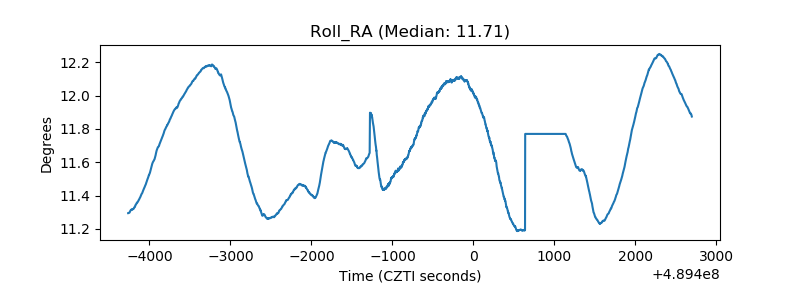 |
| Veto Counter | 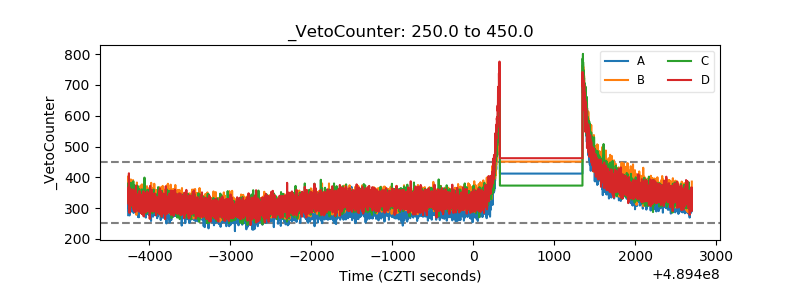 |