| Param | Original file | Final file |
|---|---|---|
| Filename | modeM0/AS1C09_011T08_9000006482_52846cztM0_level2.fits | modeM0/AS1C09_011T08_9000006482_52846cztM0_level2_quad_clean.evt |
| Size (bytes) | 863,925,120 | 77,685,120 |
| Size | 823.9 MB | 74.1 MB |
| Events in quadrant A | 5,815,967 | 588,972 |
| Events in quadrant B | 7,824,025 | 542,597 |
| Events in quadrant C | 5,640,519 | 524,422 |
| Events in quadrant D | 12,217,870 | 260,787 |
| Mode M0 | |||
|---|---|---|---|
| Quadrant | BADHDUFLAG | Total packets | Discarded packets |
| A | 0 | 21523 | 1 |
| B | 0 | 27587 | 1 |
| C | 0 | 21213 | 1 |
| D | 0 | 40588 | 1 |
| Mode M9 | |||
|---|---|---|---|
| Quadrant | BADHDUFLAG | Total packets | Discarded packets |
| A | 0 | 12 | 0 |
| B | 0 | 12 | 0 |
| C | 0 | 12 | 0 |
| D | 0 | 12 | 0 |
| Mode SS | |||
|---|---|---|---|
| Quadrant | BADHDUFLAG | Total packets | Discarded packets |
| A | 0 | 126 | 0 |
| B | 0 | 126 | 0 |
| C | 0 | 126 | 0 |
| D | 0 | 126 | 0 |
| Quadrant | Total seconds | Saturated seconds | Saturation percentage |
|---|---|---|---|
| A | 6234 | 565 | 9.063202% |
| B | 6235 | 1375 | 22.052927% |
| C | 6235 | 884 | 14.178027% |
| D | 6235 | 3645 | 58.460305% |
Noise dominated data is calculated using 1-second bins in cleaned event files. If a bin has >2000 counts, and if more than 50% of those come from <1% of pixels, then it is considered to be noise-dominated and hence unusable.
| Quadrant | # 1 sec bins | Bins with >0 counts | Bins with >2000 counts | High rate bins dominated by noise | Noise dominated (total time) | Noise dominated (detector-on time) | Marked lightcurve |
|---|---|---|---|---|---|---|---|
| A | 7424 | 6235 | 436 | 436 | 5.87% | 6.99% | 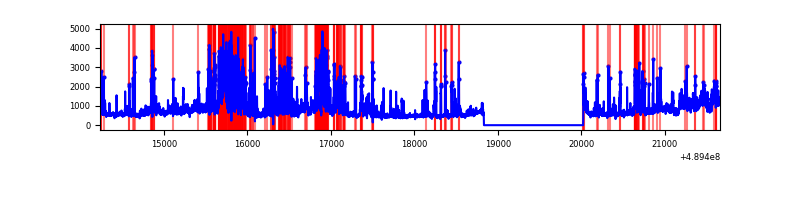 |
| B | 7425 | 6236 | 936 | 936 | 12.61% | 15.01% | 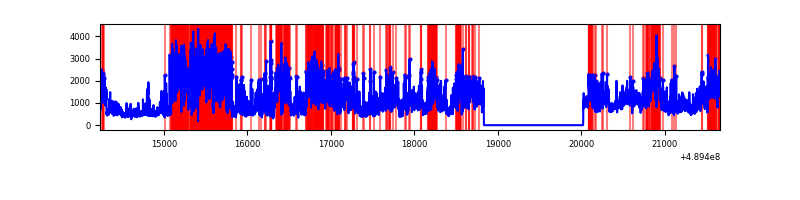 |
| C | 7425 | 6236 | 709 | 709 | 9.55% | 11.37% | 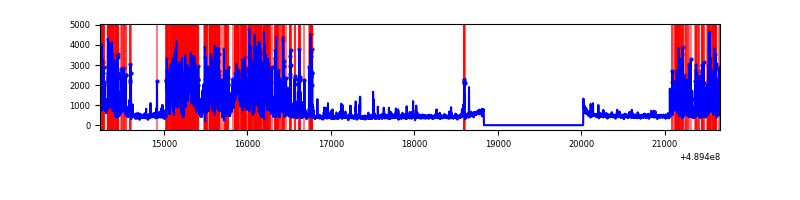 |
| D | 7425 | 6235 | 3107 | 3107 | 41.85% | 49.83% | 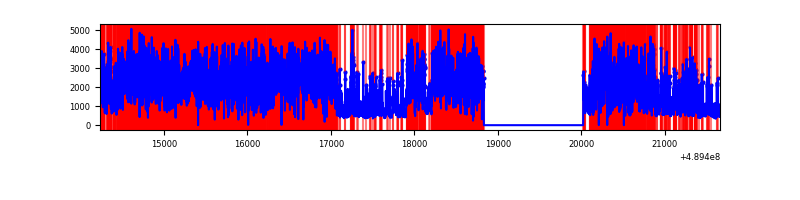 |
Top three noisy pixels from each quadrant. If the there are fewer than three noisy pixels in the level2.evt file, extra rows are filled as -1
| Pixel properties | Quadrant properties | ||||||
|---|---|---|---|---|---|---|---|
| Quadrant | DetID | PixID | Counts | Sigma | Mean | Median | Sigma |
| A | 3 | 62 | 1329019 | 8092.32 | 651 | 635 | 164.2 |
| A | 9 | 191 | 1021457 | 6218.7 | 651 | 635 | 164.2 |
| A | 4 | 238 | 246074 | 1495.18 | 651 | 635 | 164.2 |
| B | 8 | 3 | 4219234 | 33118.25 | 606 | 585 | 127.4 |
| B | 0 | 213 | 349171 | 2736.55 | 606 | 585 | 127.4 |
| B | 7 | 0 | 213231 | 1669.36 | 606 | 585 | 127.4 |
| C | 15 | 224 | 2524833 | 14721.43 | 619 | 614 | 171.5 |
| C | 4 | 5 | 365898 | 2130.36 | 619 | 614 | 171.5 |
| C | 12 | 249 | 68935 | 398.45 | 619 | 614 | 171.5 |
| D | 12 | 2 | 5673648 | 43326.41 | 451 | 430 | 130.9 |
| D | 8 | 176 | 3700932 | 28260.76 | 451 | 430 | 130.9 |
| D | 10 | 172 | 280357 | 2137.8 | 451 | 430 | 130.9 |
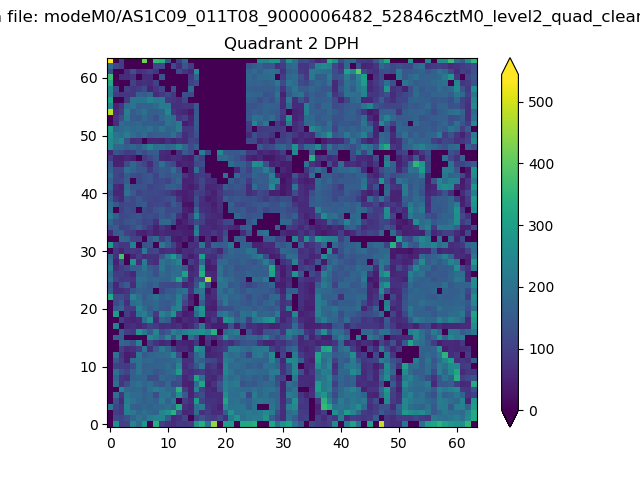
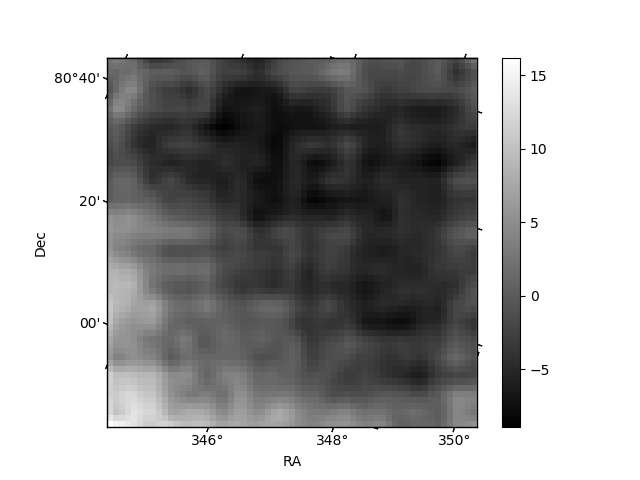
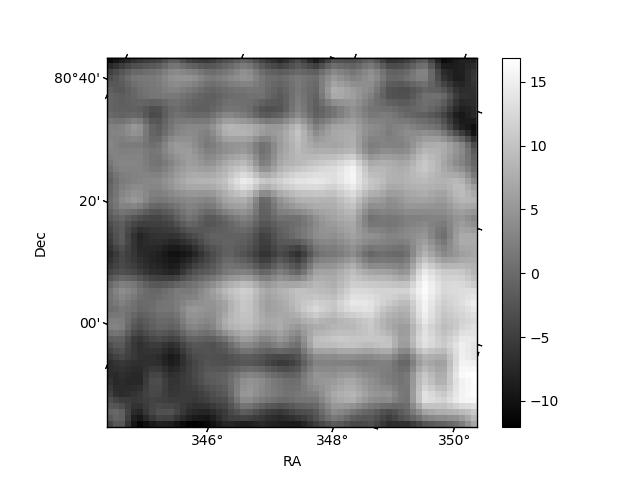
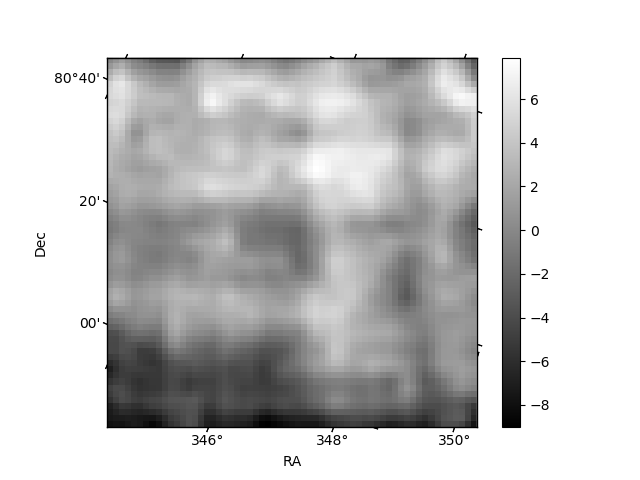
Histogram calculated using DETX and DETY for each event in the final _common_clean file
| Quadrant A | 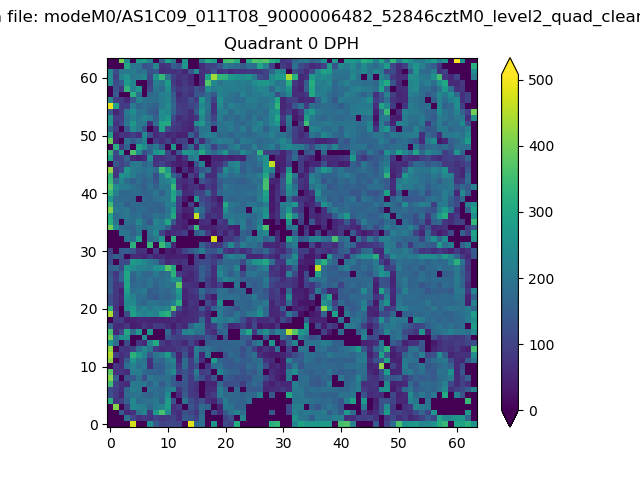 |
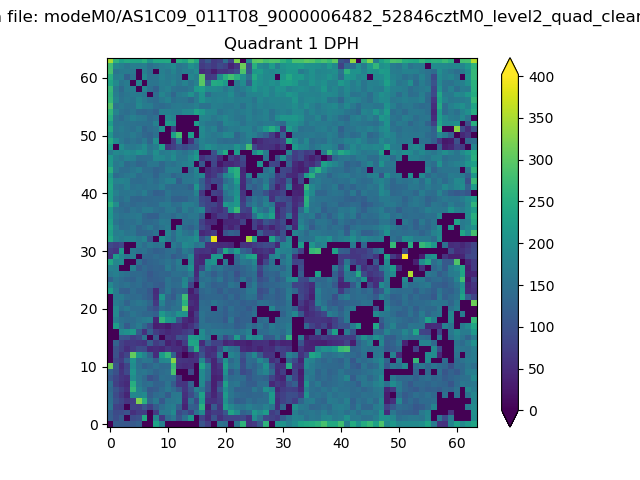 |
Quadrant B |
|---|---|---|---|
| Quadrant D | 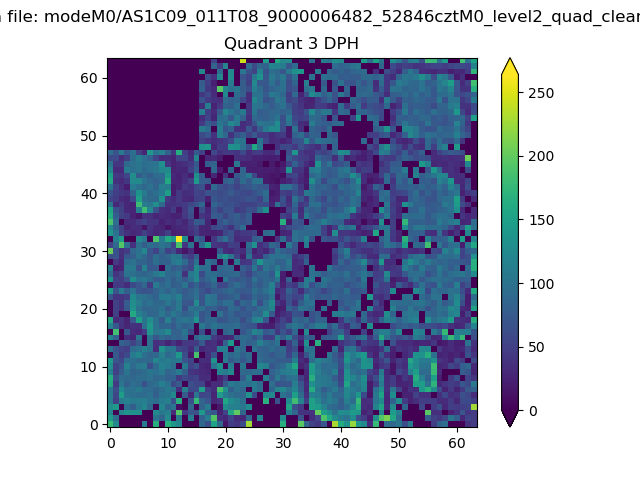 |
 |
Quadrant C |
| Plot type | Count rate plots | Images |
|---|---|---|
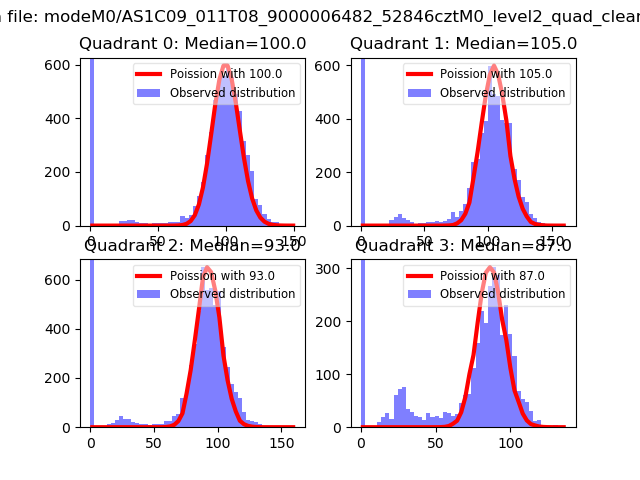
| Comparison with Poisson distribution Blue bars denote a histogram of data divided into 1 sec bins. Red curve is a Poisson curve with rate = median count rate of data. |
 |
 |
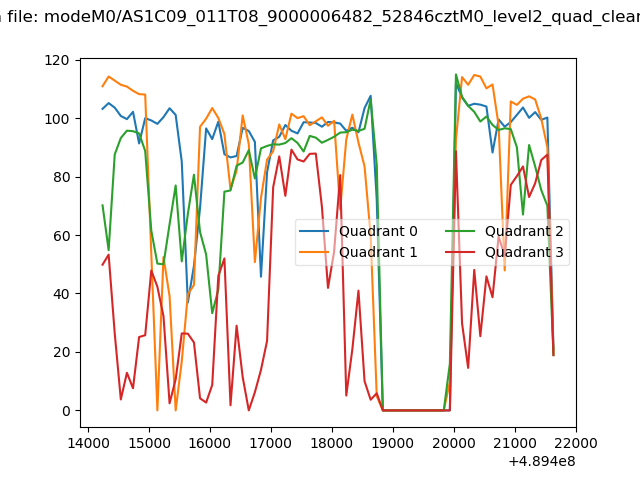
| Quadrant-wise count rates Data is divided into 100 sec bins |
 |
|
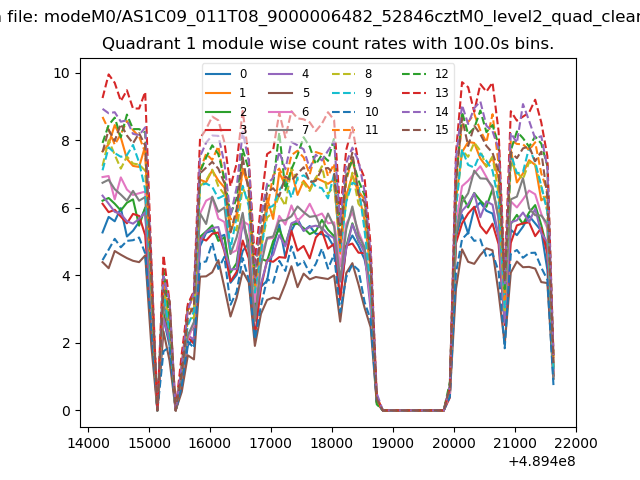
| Module-wise count rates for Quadrant A Data is divided into 100 sec bins |
 |
 |
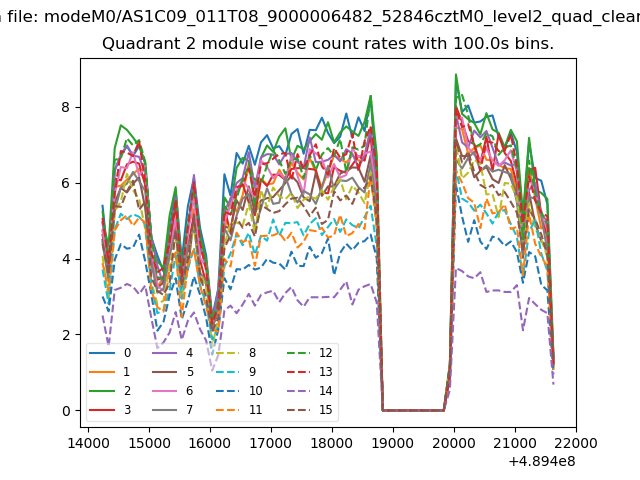
| Module-wise count rates for Quadrant B Data is divided into 100 sec bins |
 |
 |
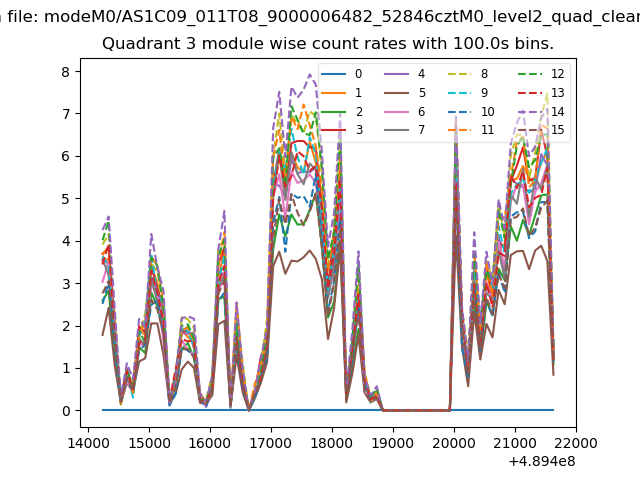
| Module-wise count rates for Quadrant C Data is divided into 100 sec bins |
 |
 |
| Module-wise count rates for Quadrant D Data is divided into 100 sec bins |
 |
 |
| Parameter | Plot |
|---|---|
| CZT HV Monitor | 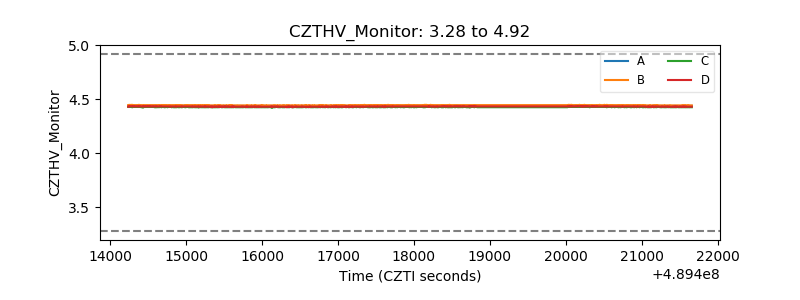 |
| D_VDD | 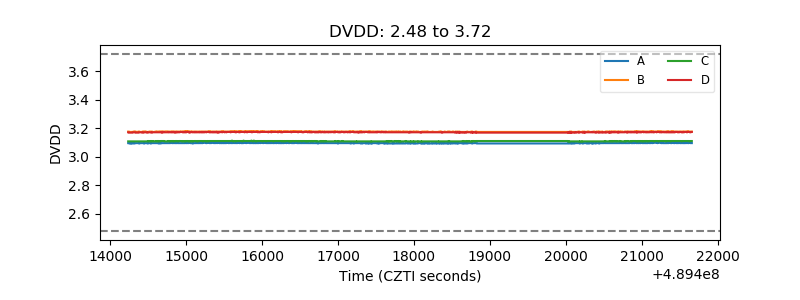 |
| Temperature 1 | 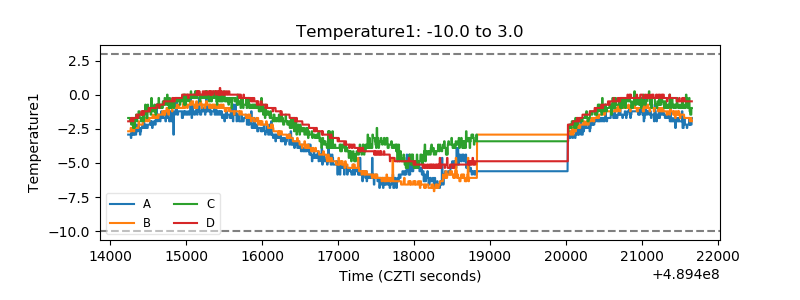 |
| Veto HV Monitor | 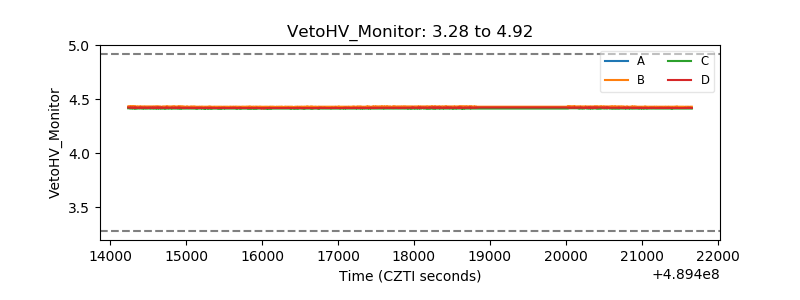 |
| Veto LLD | 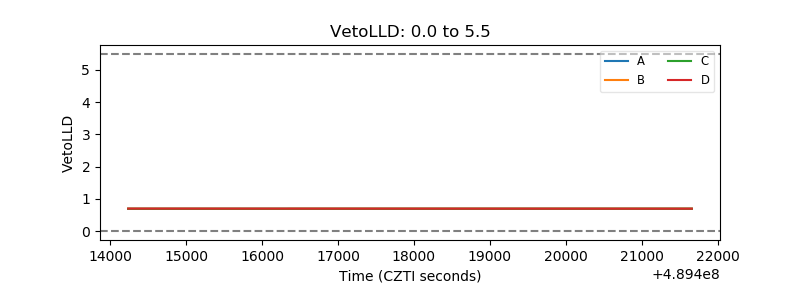 |
| Alpha Counter | 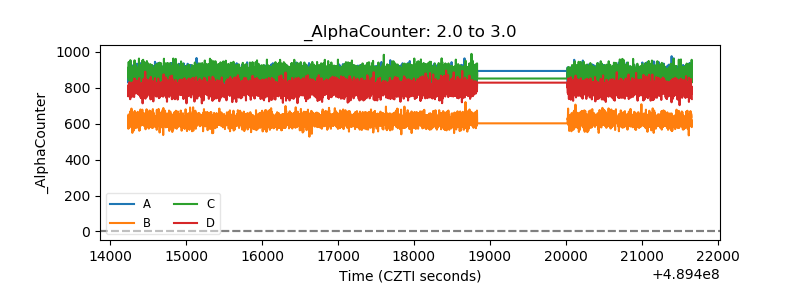 |
| _CPM_Rate | 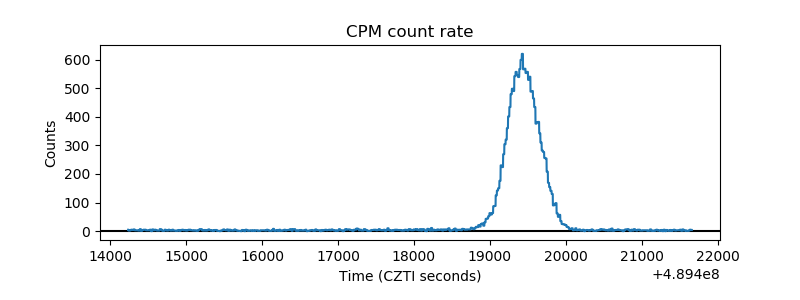 |
| CZT Counter | 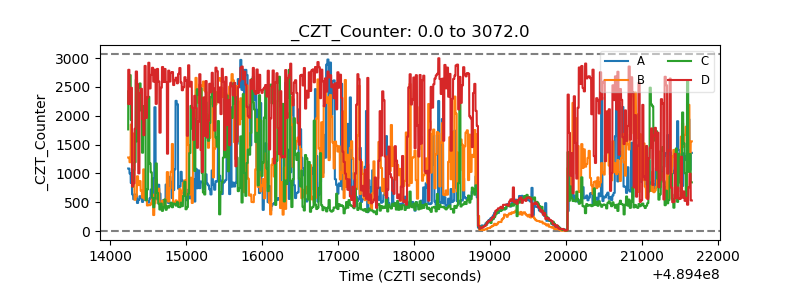 |
| +2.5 Volts monitor |  |
| +5 Volts monitor | 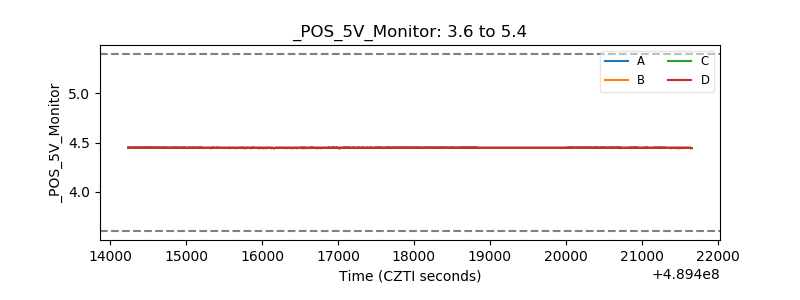 |
| _ROLL_ROT | 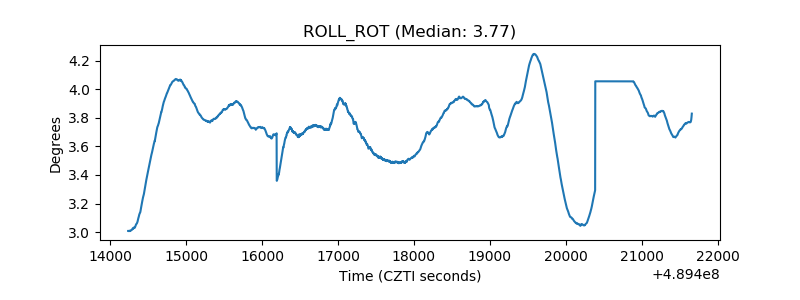 |
| _Roll_DEC | 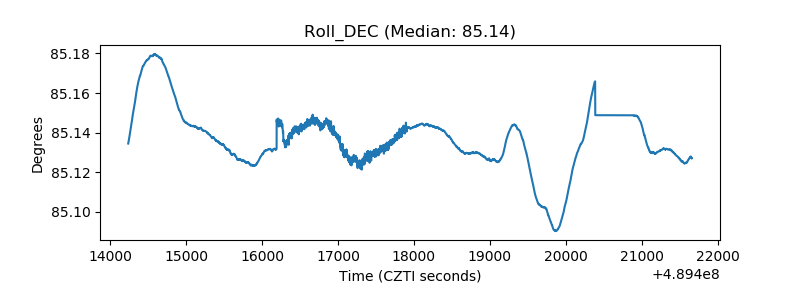 |
| _Roll_RA | 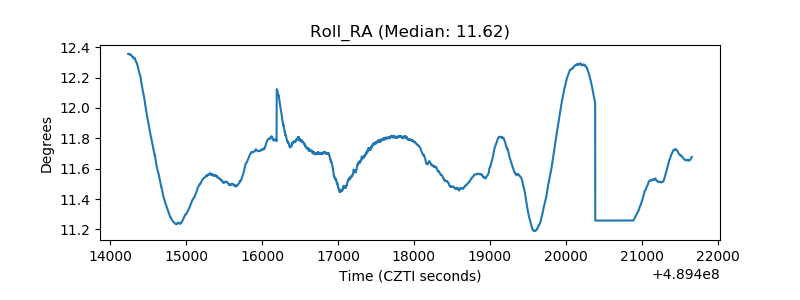 |
| Veto Counter | 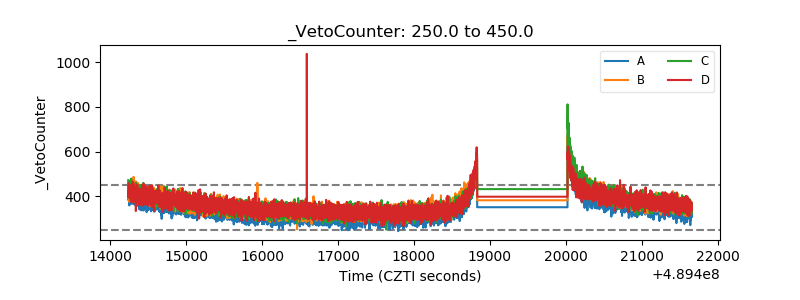 |