| Param | Original file | Final file |
|---|---|---|
| Filename | modeM0/AS1C09_011T08_9000006482_52850cztM0_level2.fits | modeM0/AS1C09_011T08_9000006482_52850cztM0_level2_quad_clean.evt |
| Size (bytes) | 1,041,765,120 | 81,037,440 |
| Size | 993.5 MB | 77.3 MB |
| Events in quadrant A | 6,221,858 | 657,540 |
| Events in quadrant B | 8,726,738 | 594,970 |
| Events in quadrant C | 6,346,110 | 540,215 |
| Events in quadrant D | 16,713,829 | 160,543 |
| Mode M0 | |||
|---|---|---|---|
| Quadrant | BADHDUFLAG | Total packets | Discarded packets |
| A | 0 | 23410 | 0 |
| B | 0 | 30963 | 0 |
| C | 0 | 24311 | 0 |
| D | 0 | 54509 | 0 |
| Mode SS | |||
|---|---|---|---|
| Quadrant | BADHDUFLAG | Total packets | Discarded packets |
| A | 0 | 144 | 0 |
| B | 0 | 144 | 0 |
| C | 0 | 144 | 0 |
| D | 0 | 144 | 0 |
| Quadrant | Total seconds | Saturated seconds | Saturation percentage |
|---|---|---|---|
| A | 7175 | 560 | 7.804878% |
| B | 7176 | 1510 | 21.042363% |
| C | 7176 | 1309 | 18.241360% |
| D | 7176 | 5665 | 78.943701% |
Noise dominated data is calculated using 1-second bins in cleaned event files. If a bin has >2000 counts, and if more than 50% of those come from <1% of pixels, then it is considered to be noise-dominated and hence unusable.
| Quadrant | # 1 sec bins | Bins with >0 counts | Bins with >2000 counts | High rate bins dominated by noise | Noise dominated (total time) | Noise dominated (detector-on time) | Marked lightcurve |
|---|---|---|---|---|---|---|---|
| A | 7175 | 7175 | 370 | 370 | 5.16% | 5.16% | 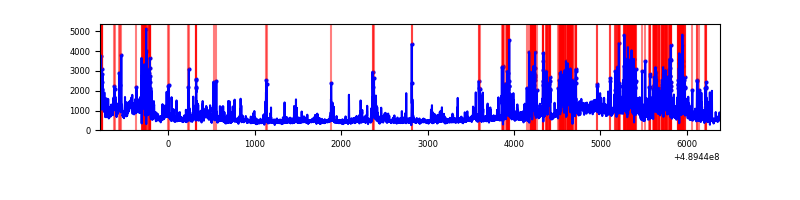 |
| B | 7176 | 7176 | 950 | 950 | 13.24% | 13.24% | 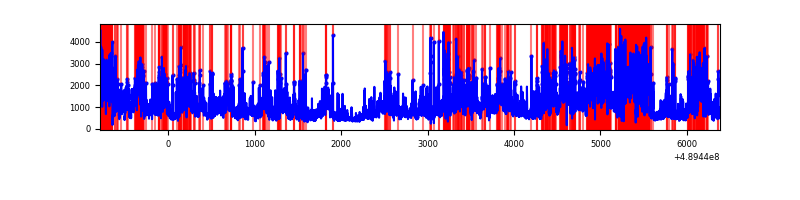 |
| C | 7176 | 7176 | 935 | 935 | 13.03% | 13.03% | 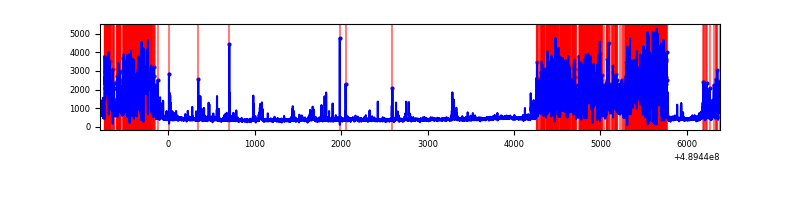 |
| D | 7175 | 7175 | 4876 | 4876 | 67.96% | 67.96% | 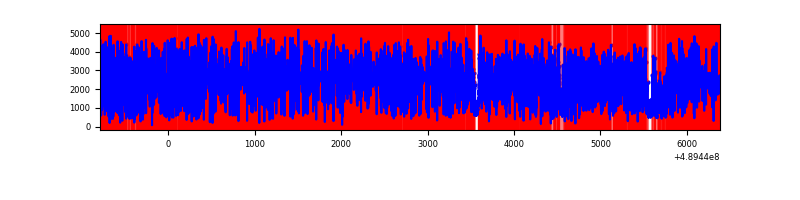 |
Top three noisy pixels from each quadrant. If the there are fewer than three noisy pixels in the level2.evt file, extra rows are filled as -1
| Pixel properties | Quadrant properties | ||||||
|---|---|---|---|---|---|---|---|
| Quadrant | DetID | PixID | Counts | Sigma | Mean | Median | Sigma |
| A | 9 | 191 | 1078206 | 5945.62 | 731 | 715 | 181.2 |
| A | 3 | 62 | 753709 | 4155.04 | 731 | 715 | 181.2 |
| A | 15 | 174 | 325996 | 1794.91 | 731 | 715 | 181.2 |
| B | 8 | 3 | 4268230 | 29286.51 | 687 | 663 | 145.7 |
| B | 10 | 254 | 654058 | 4483.97 | 687 | 663 | 145.7 |
| B | 1 | 223 | 313174 | 2144.63 | 687 | 663 | 145.7 |
| C | 15 | 224 | 3077057 | 16731.97 | 659 | 651 | 183.9 |
| C | 2 | 12 | 288940 | 1567.94 | 659 | 651 | 183.9 |
| C | 15 | 144 | 65870 | 354.71 | 659 | 651 | 183.9 |
| D | 12 | 2 | 13220952 | 117435.14 | 383 | 366 | 112.6 |
| D | 8 | 176 | 874409 | 7763.9 | 383 | 366 | 112.6 |
| D | 11 | 176 | 305528 | 2710.68 | 383 | 366 | 112.6 |
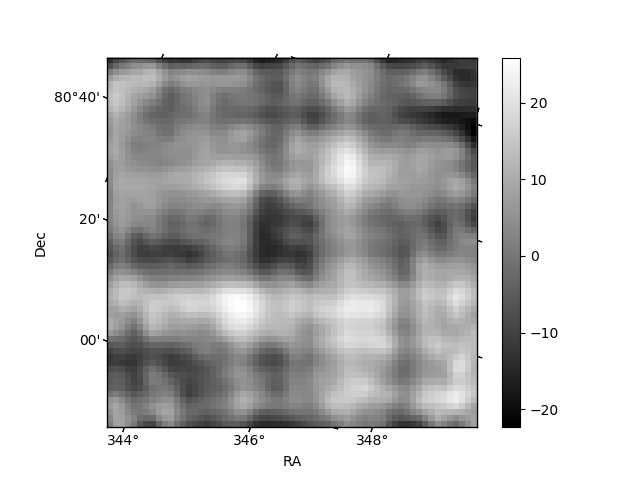
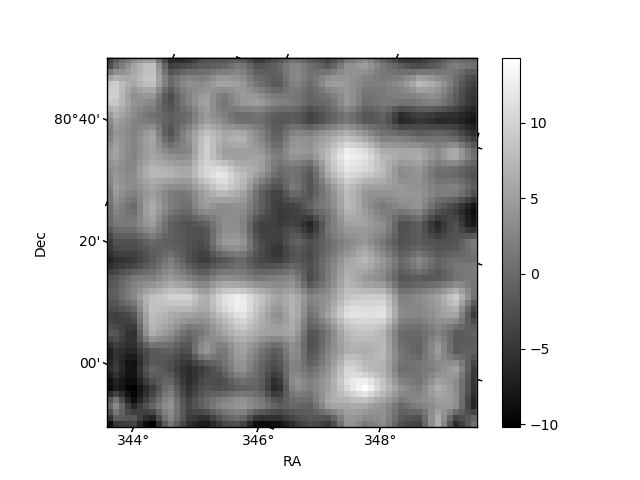
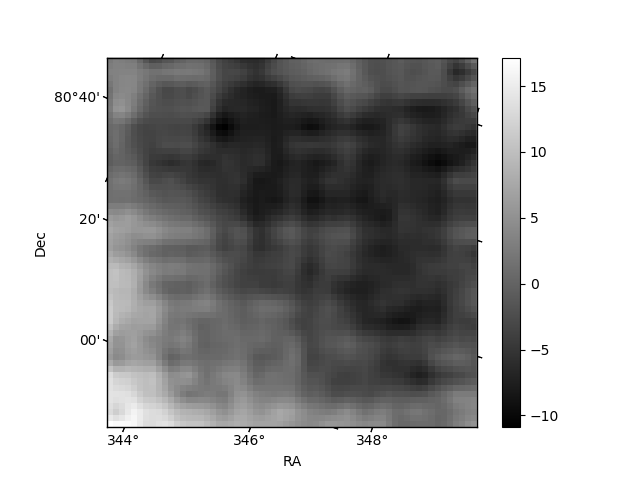
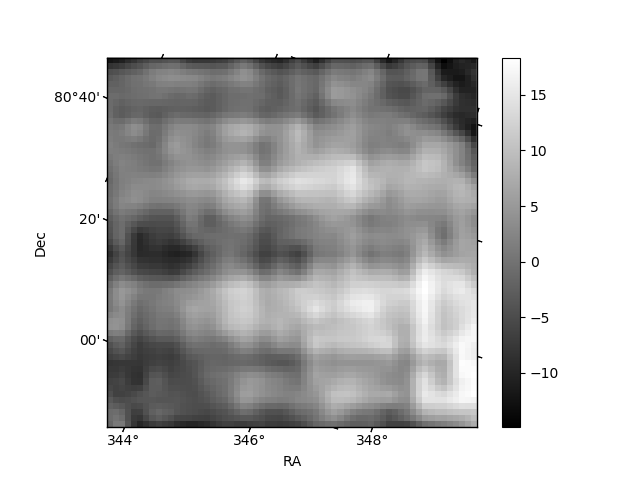
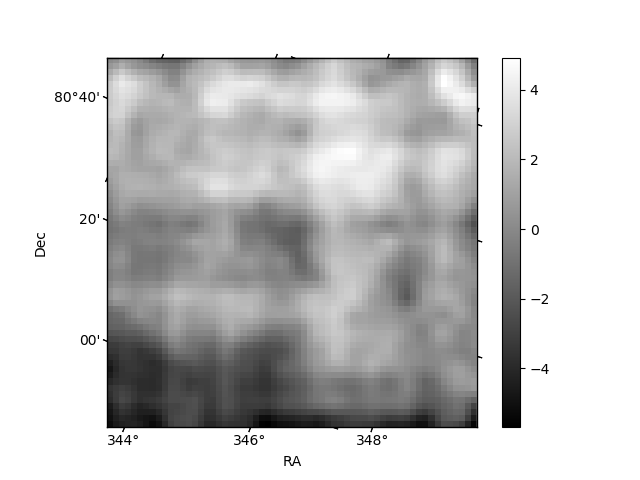
Histogram calculated using DETX and DETY for each event in the final _common_clean file
| Quadrant A | 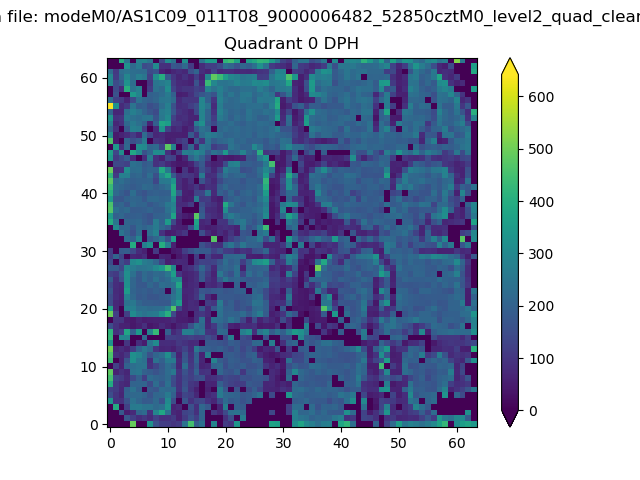 |
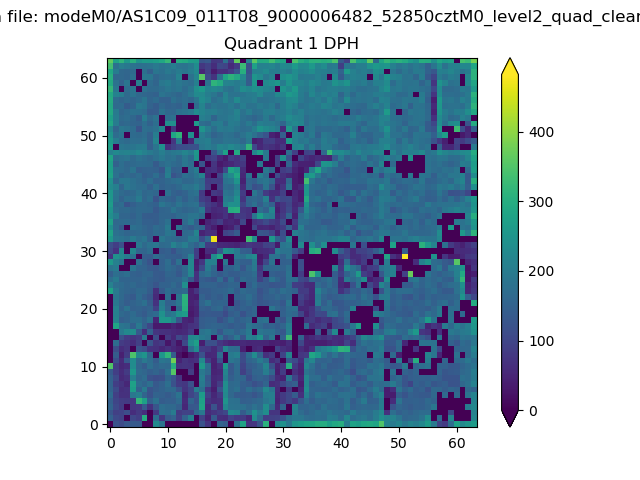 |
Quadrant B |
|---|---|---|---|
| Quadrant D | 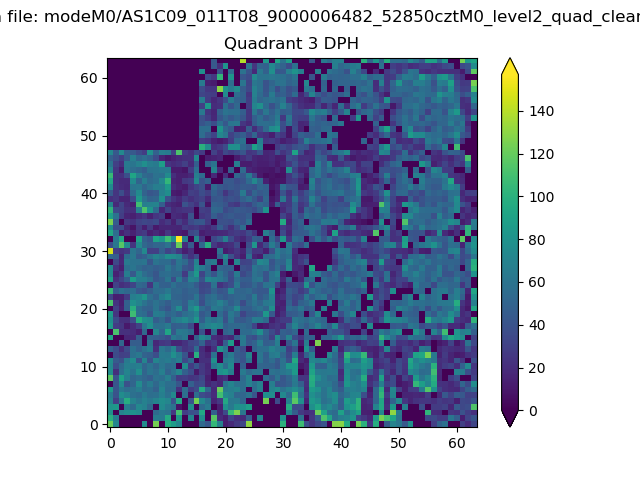 |
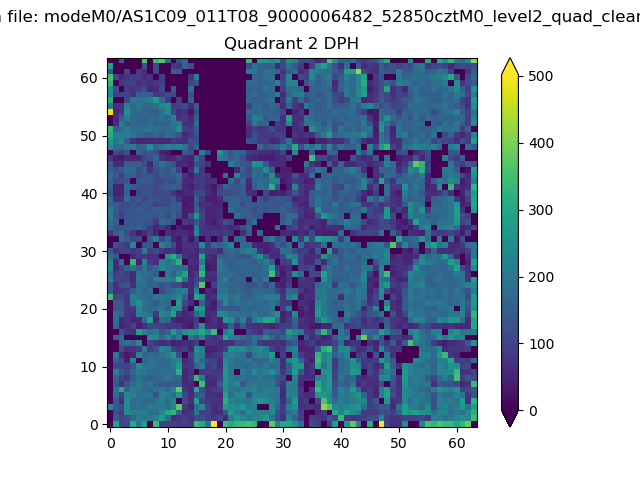 |
Quadrant C |
| Plot type | Count rate plots | Images |
|---|---|---|
| Comparison with Poisson distribution Blue bars denote a histogram of data divided into 1 sec bins. Red curve is a Poisson curve with rate = median count rate of data. |
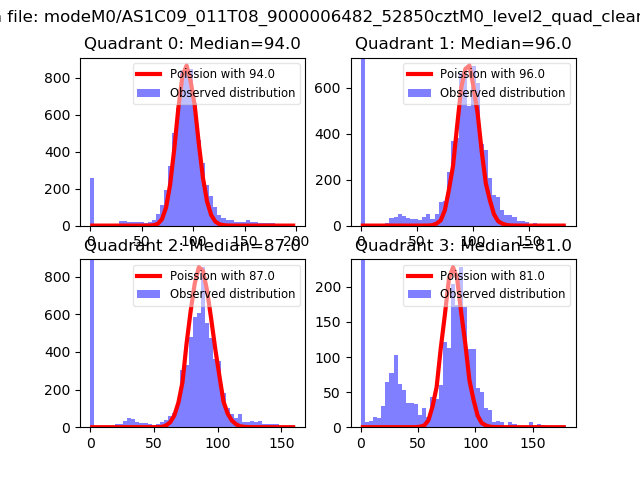 |
 |
| Quadrant-wise count rates Data is divided into 100 sec bins |
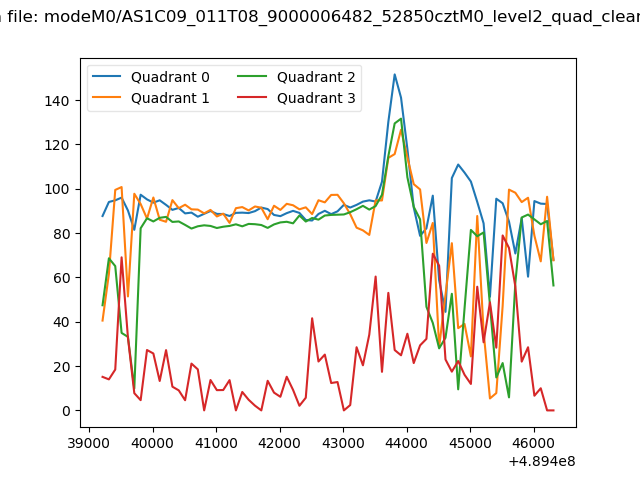 |
|
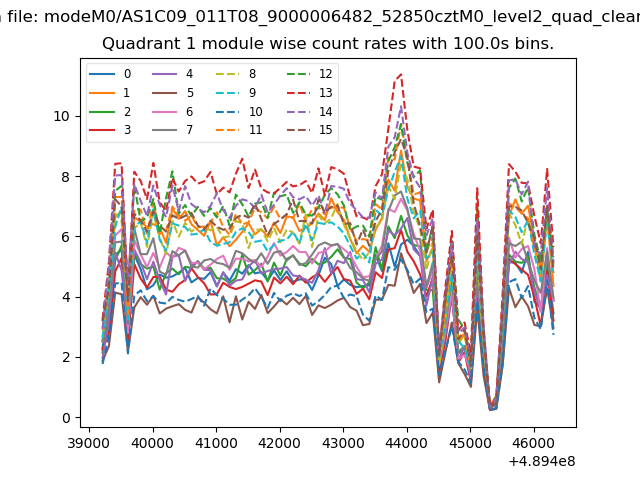
| Module-wise count rates for Quadrant A Data is divided into 100 sec bins |
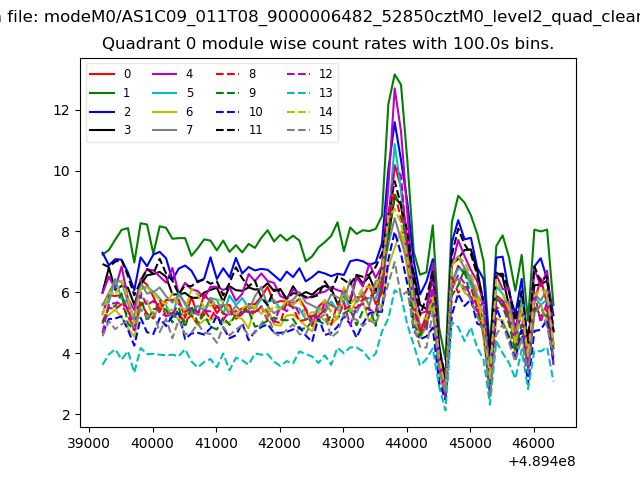 |
 |
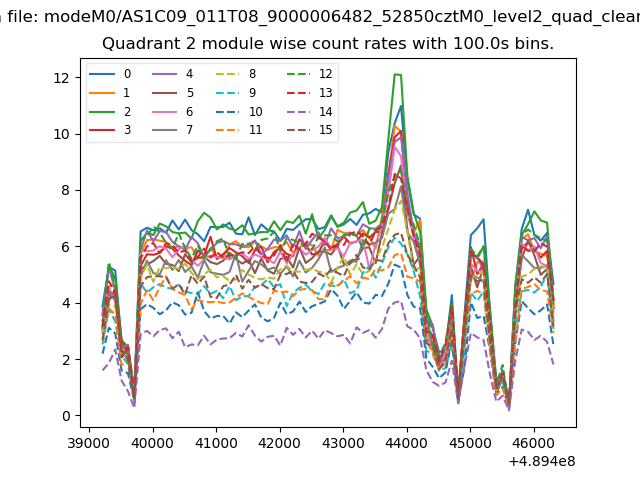
| Module-wise count rates for Quadrant B Data is divided into 100 sec bins |
 |
 |
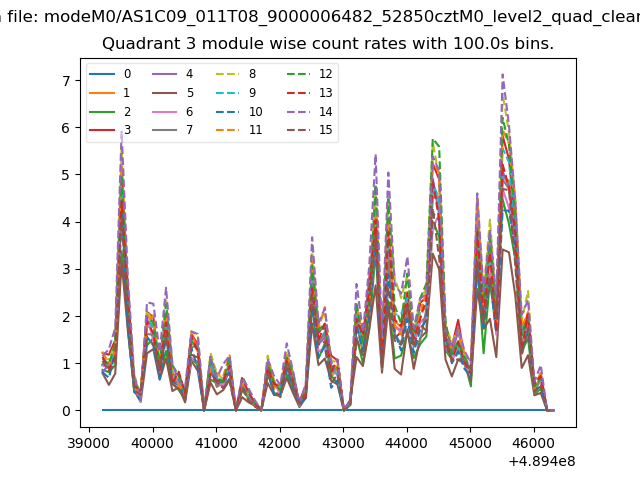
| Module-wise count rates for Quadrant C Data is divided into 100 sec bins |
 |
 |
| Module-wise count rates for Quadrant D Data is divided into 100 sec bins |
 |
 |
| Parameter | Plot |
|---|---|
| CZT HV Monitor | 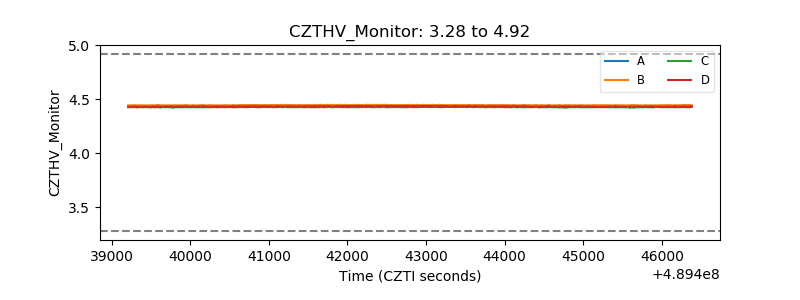 |
| D_VDD | 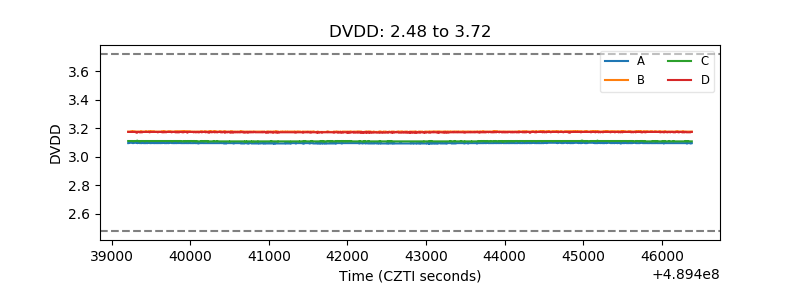 |
| Temperature 1 | 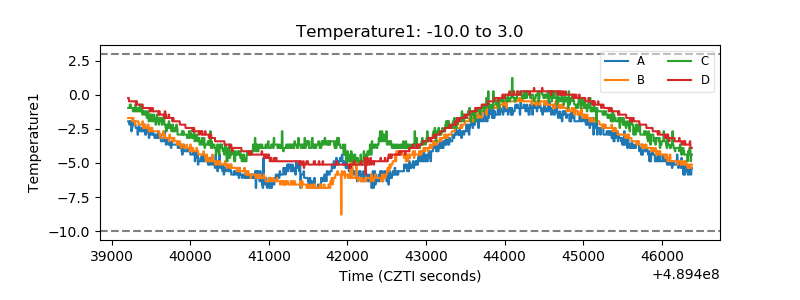 |
| Veto HV Monitor |  |
| Veto LLD | 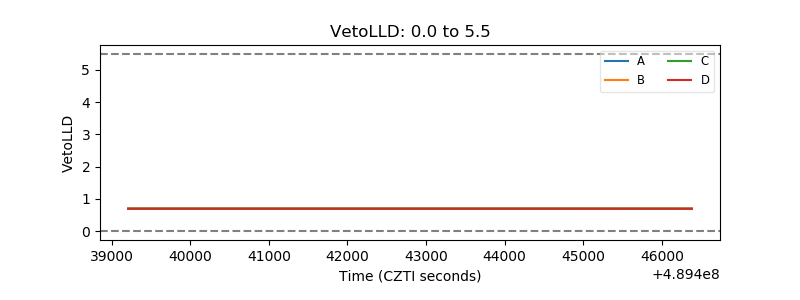 |
| Alpha Counter | 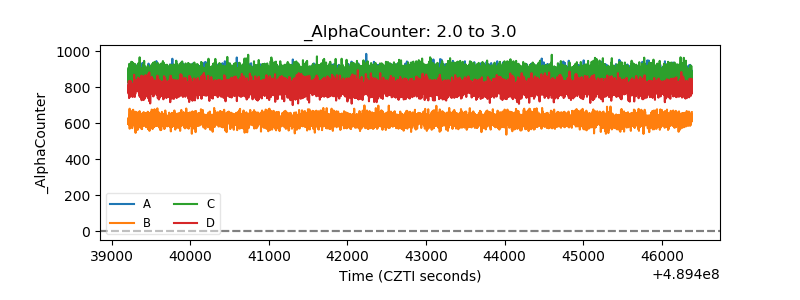 |
| _CPM_Rate | 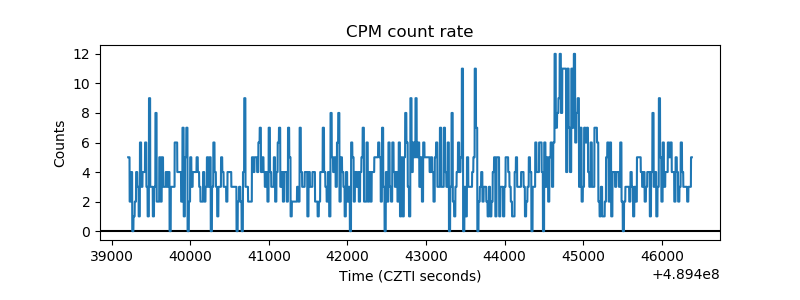 |
| CZT Counter | 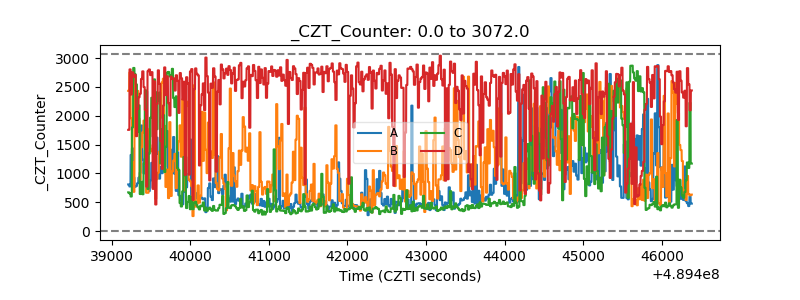 |
| +2.5 Volts monitor |  |
| +5 Volts monitor | 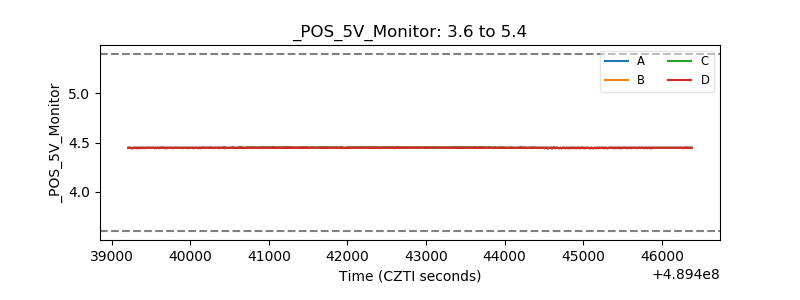 |
| _ROLL_ROT | 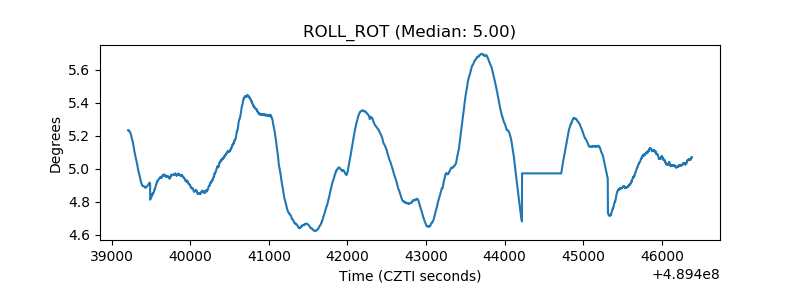 |
| _Roll_DEC | 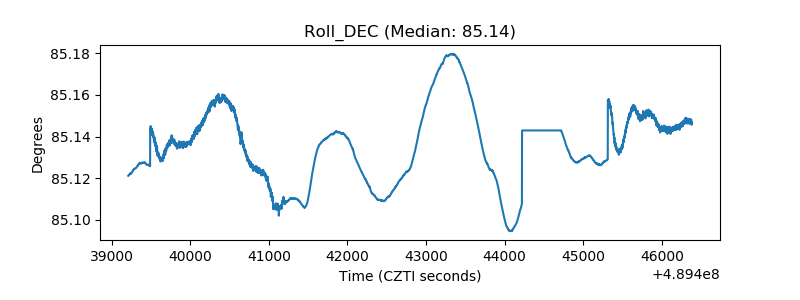 |
| _Roll_RA | 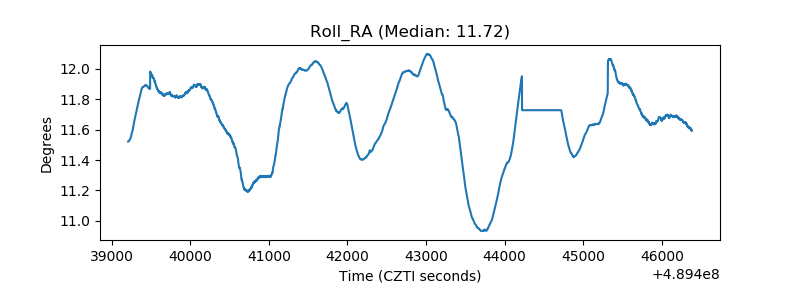 |
| Veto Counter | 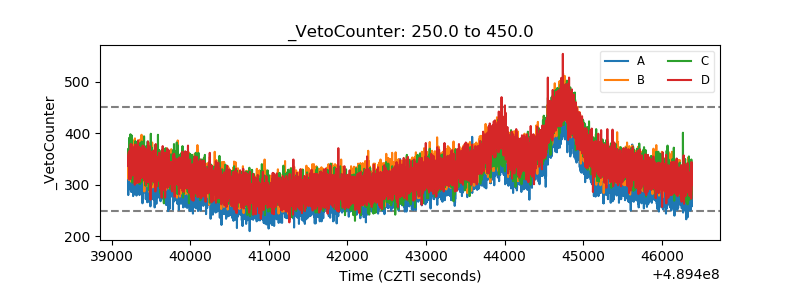 |