| Param | Original file | Final file |
|---|---|---|
| Filename | modeM0/AS1C09_011T08_9000006482_52854cztM0_level2.fits | modeM0/AS1C09_011T08_9000006482_52854cztM0_level2_quad_clean.evt |
| Size (bytes) | 2,547,023,040 | 217,324,800 |
| Size | 2.4 GB | 207.3 MB |
| Events in quadrant A | 22,283,657 | 1,445,536 |
| Events in quadrant B | 26,241,251 | 1,301,054 |
| Events in quadrant C | 13,922,624 | 1,529,733 |
| Events in quadrant D | 30,367,156 | 985,937 |
| Mode M0 | |||
|---|---|---|---|
| Quadrant | BADHDUFLAG | Total packets | Discarded packets |
| A | 0 | 79593 | 4 |
| B | 0 | 91217 | 4 |
| C | 0 | 55436 | 4 |
| D | 0 | 103341 | 4 |
| Mode M9 | |||
|---|---|---|---|
| Quadrant | BADHDUFLAG | Total packets | Discarded packets |
| A | 0 | 11 | 0 |
| B | 0 | 11 | 0 |
| C | 0 | 11 | 0 |
| D | 0 | 11 | 0 |
| Mode SS | |||
|---|---|---|---|
| Quadrant | BADHDUFLAG | Total packets | Discarded packets |
| A | 0 | 388 | 0 |
| B | 0 | 388 | 0 |
| C | 0 | 388 | 0 |
| D | 0 | 388 | 0 |
| Quadrant | Total seconds | Saturated seconds | Saturation percentage |
|---|---|---|---|
| A | 19096 | 3706 | 19.407206% |
| B | 19097 | 5965 | 31.235273% |
| C | 19097 | 1683 | 8.812903% |
| D | 19097 | 7541 | 39.487878% |
Noise dominated data is calculated using 1-second bins in cleaned event files. If a bin has >2000 counts, and if more than 50% of those come from <1% of pixels, then it is considered to be noise-dominated and hence unusable.
| Quadrant | # 1 sec bins | Bins with >0 counts | Bins with >2000 counts | High rate bins dominated by noise | Noise dominated (total time) | Noise dominated (detector-on time) | Marked lightcurve |
|---|---|---|---|---|---|---|---|
| A | 20121 | 19100 | 2783 | 2783 | 13.83% | 14.57% | 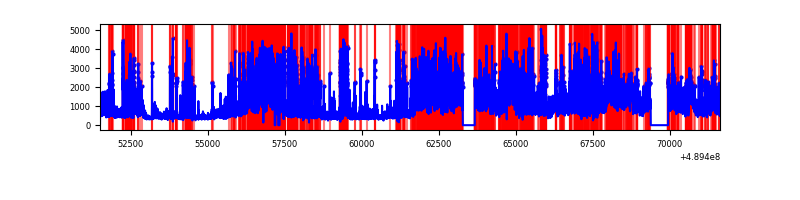 |
| B | 20122 | 19101 | 4458 | 4458 | 22.15% | 23.34% | 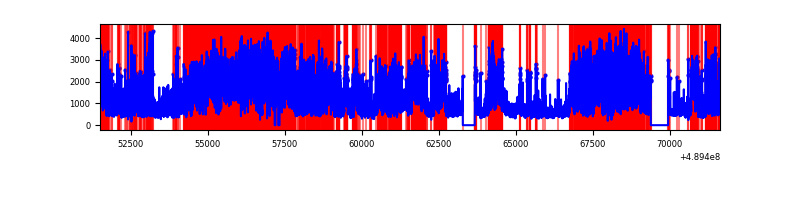 |
| C | 20122 | 19101 | 1179 | 1179 | 5.86% | 6.17% | 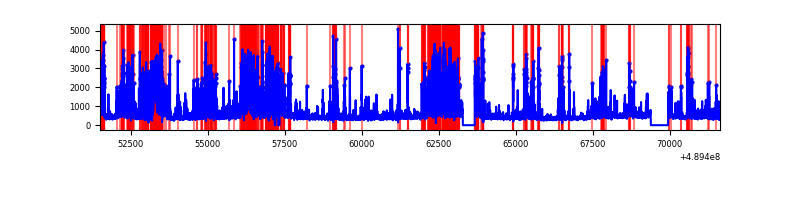 |
| D | 20122 | 19101 | 6670 | 6670 | 33.15% | 34.92% | 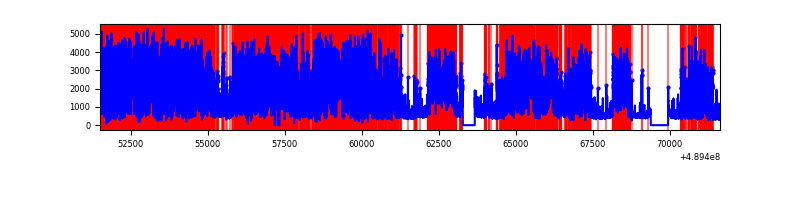 |
Top three noisy pixels from each quadrant. If the there are fewer than three noisy pixels in the level2.evt file, extra rows are filled as -1
| Pixel properties | Quadrant properties | ||||||
|---|---|---|---|---|---|---|---|
| Quadrant | DetID | PixID | Counts | Sigma | Mean | Median | Sigma |
| A | 9 | 191 | 6270763 | 13747.03 | 1827 | 1786 | 456.0 |
| A | 3 | 62 | 4624325 | 10136.61 | 1827 | 1786 | 456.0 |
| A | 0 | 8 | 879510 | 1924.73 | 1827 | 1786 | 456.0 |
| B | 8 | 3 | 17411707 | 47147.08 | 1737 | 1672 | 369.3 |
| B | 1 | 255 | 335533 | 904.11 | 1737 | 1672 | 369.3 |
| B | 4 | 81 | 266758 | 717.86 | 1737 | 1672 | 369.3 |
| C | 15 | 224 | 2554327 | 4960.68 | 1854 | 1835 | 514.5 |
| C | 2 | 12 | 1282561 | 2489.05 | 1854 | 1835 | 514.5 |
| C | 15 | 144 | 416988 | 806.84 | 1854 | 1835 | 514.5 |
| D | 12 | 2 | 17589189 | 39904.53 | 1540 | 1470 | 440.7 |
| D | 8 | 176 | 3616988 | 8203.2 | 1540 | 1470 | 440.7 |
| D | 8 | 48 | 614329 | 1390.51 | 1540 | 1470 | 440.7 |
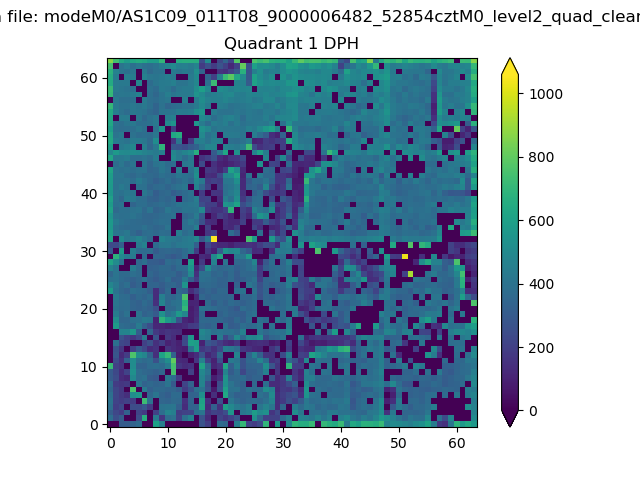
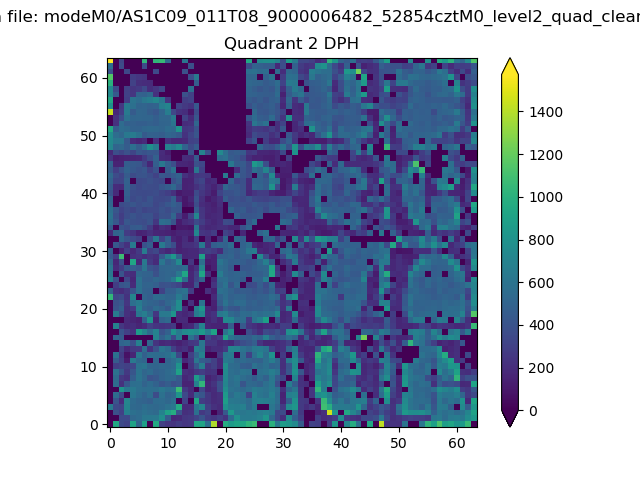
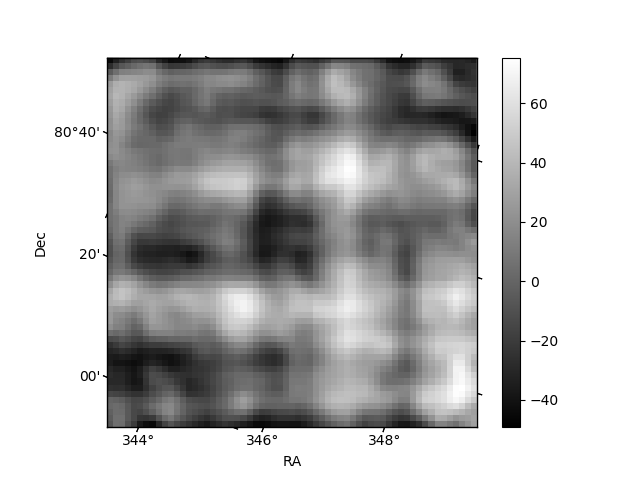
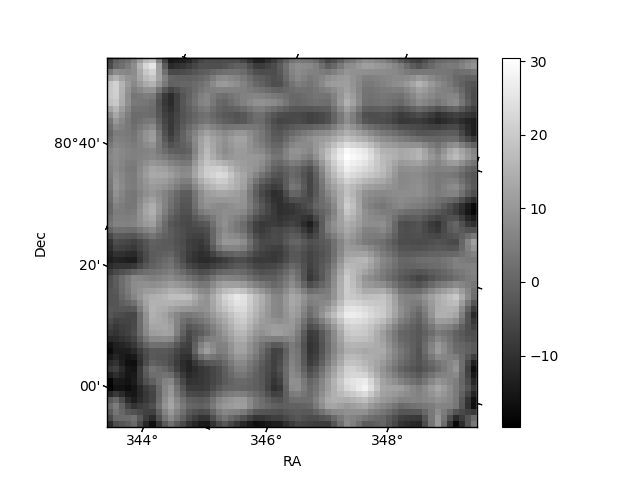
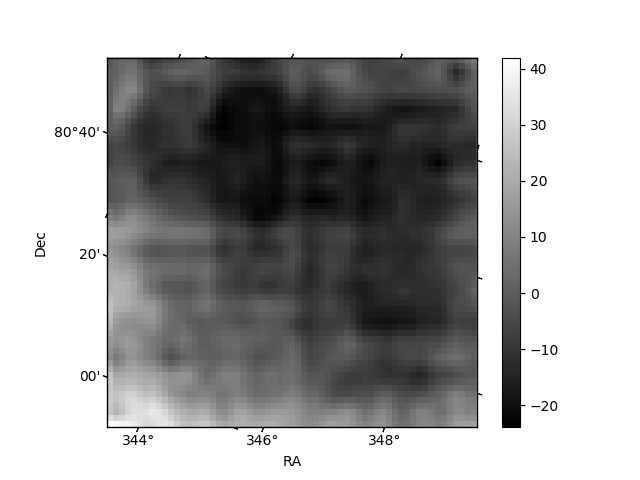
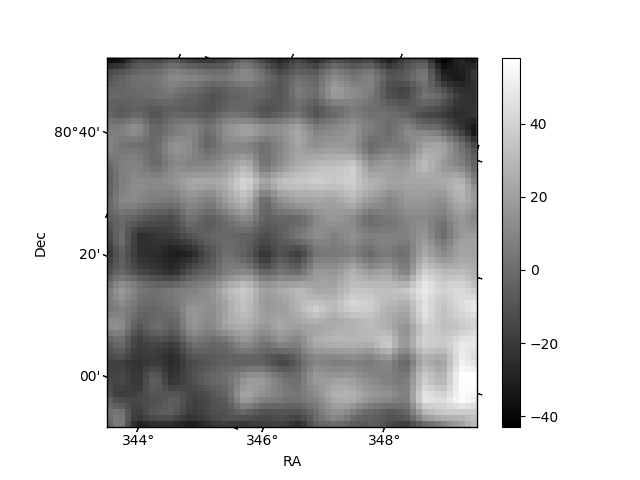
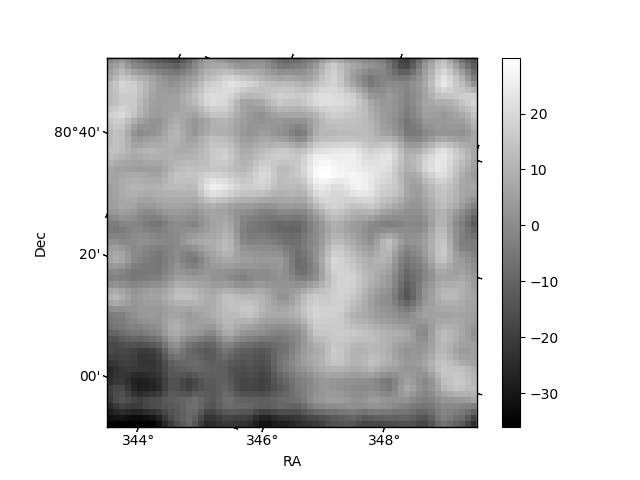
Histogram calculated using DETX and DETY for each event in the final _common_clean file
| Quadrant A |  |
 |
Quadrant B |
|---|---|---|---|
| Quadrant D | 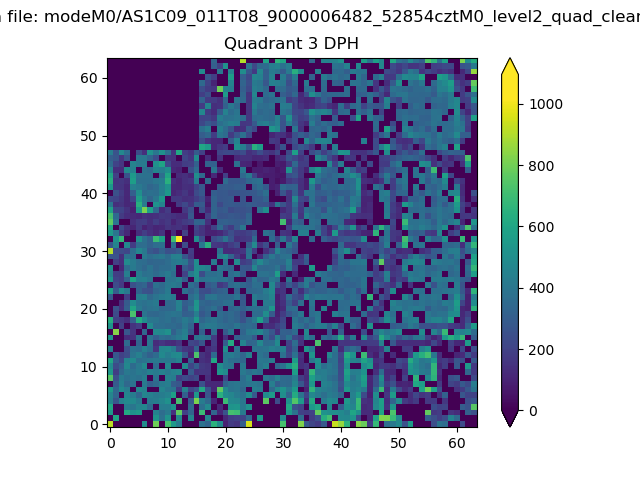 |
 |
Quadrant C |
| Plot type | Count rate plots | Images |
|---|---|---|
| Comparison with Poisson distribution Blue bars denote a histogram of data divided into 1 sec bins. Red curve is a Poisson curve with rate = median count rate of data. |
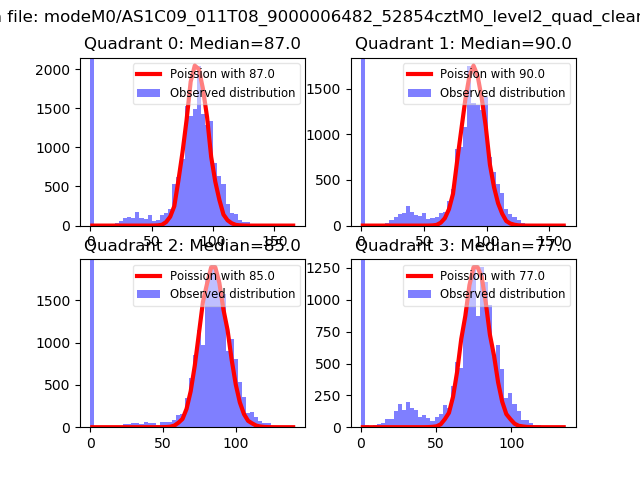 |
 |
| Quadrant-wise count rates Data is divided into 100 sec bins |
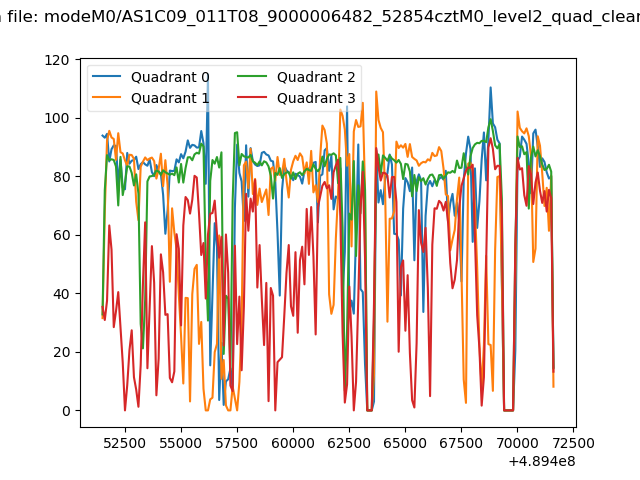 |
|
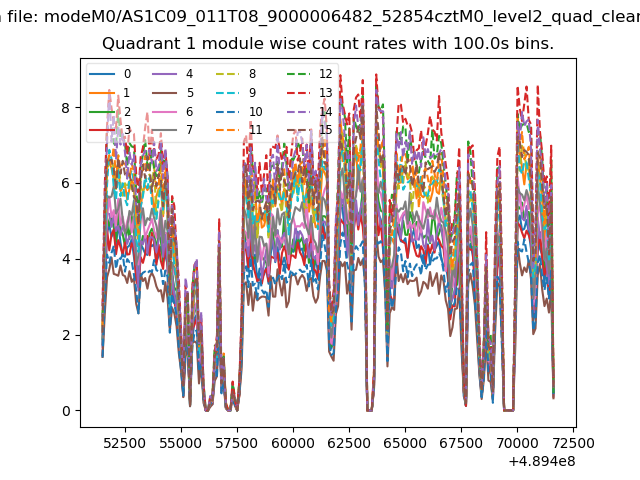
| Module-wise count rates for Quadrant A Data is divided into 100 sec bins |
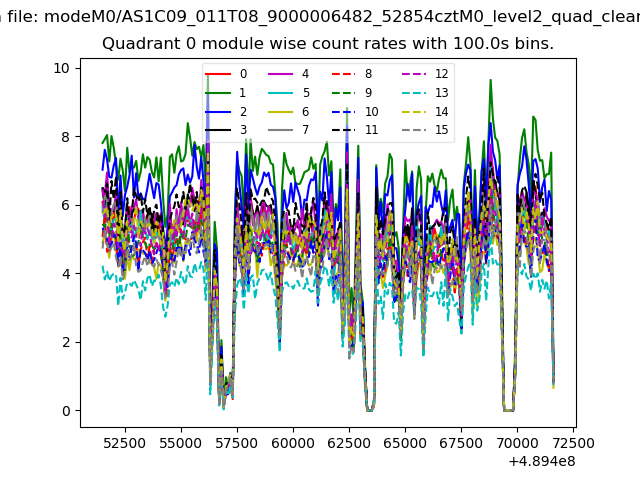 |
 |
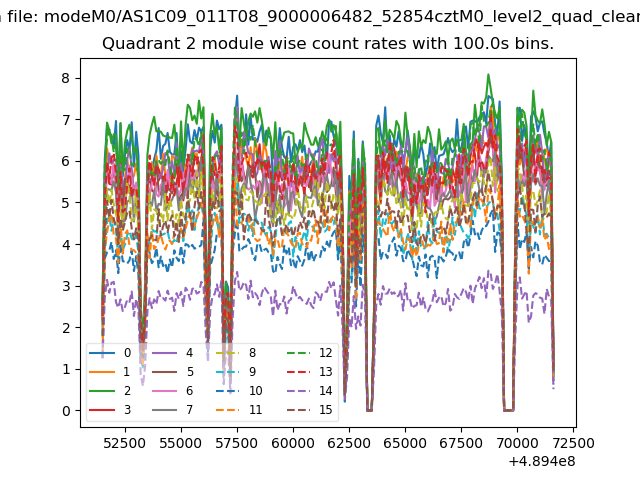
| Module-wise count rates for Quadrant B Data is divided into 100 sec bins |
 |
 |
| Module-wise count rates for Quadrant C Data is divided into 100 sec bins |
 |
 |
| Module-wise count rates for Quadrant D Data is divided into 100 sec bins |
 |
 |
| Parameter | Plot |
|---|---|
| CZT HV Monitor | 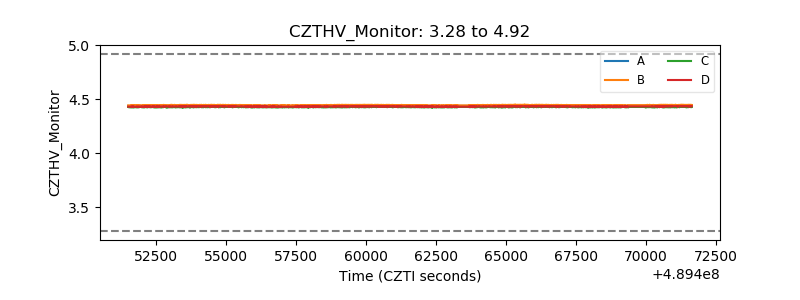 |
| D_VDD | 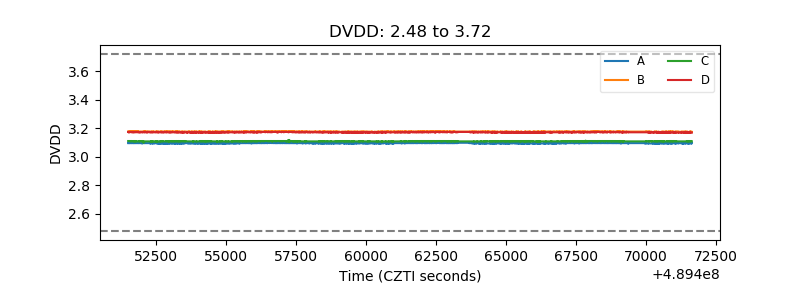 |
| Temperature 1 | 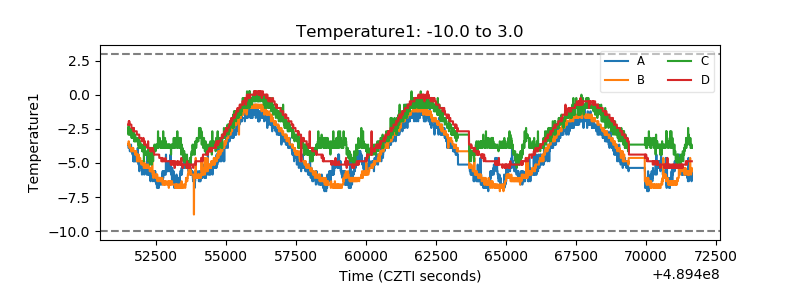 |
| Veto HV Monitor | 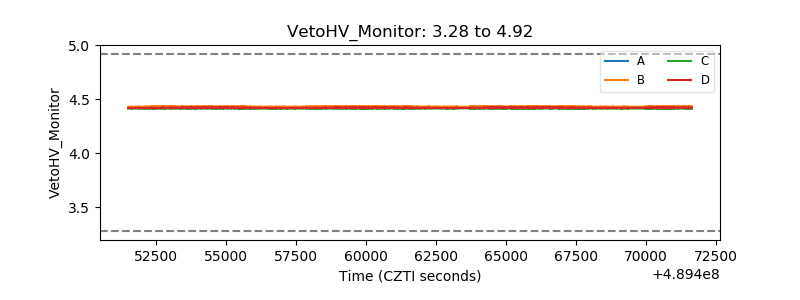 |
| Veto LLD | 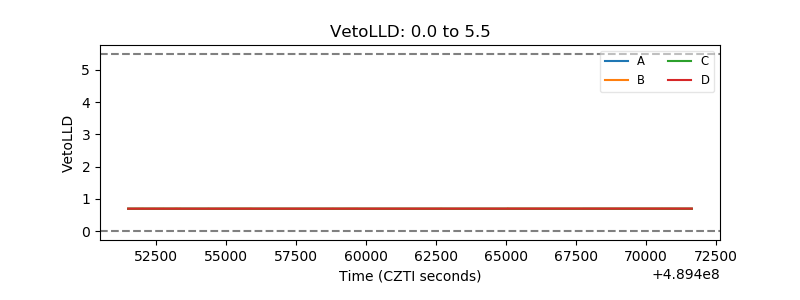 |
| Alpha Counter | 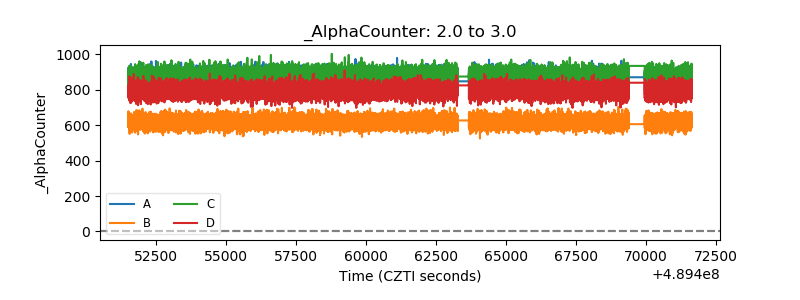 |
| _CPM_Rate | 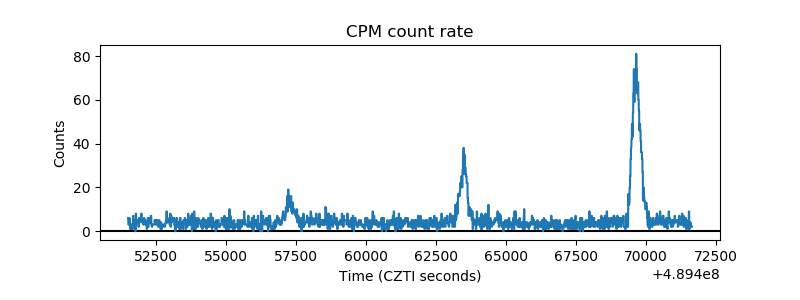 |
| CZT Counter | 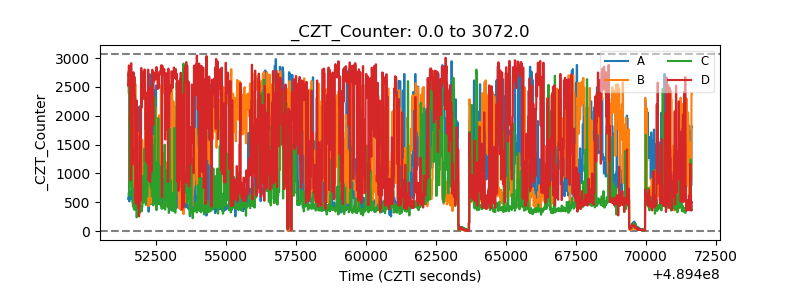 |
| +2.5 Volts monitor | 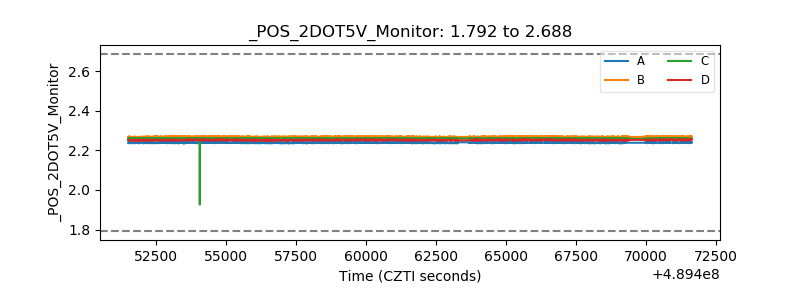 |
| +5 Volts monitor |  |
| _ROLL_ROT | 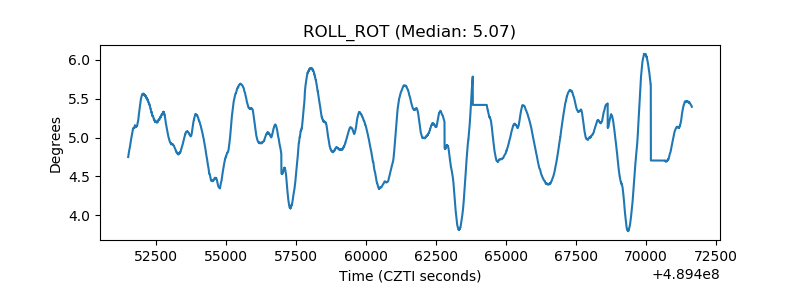 |
| _Roll_DEC | 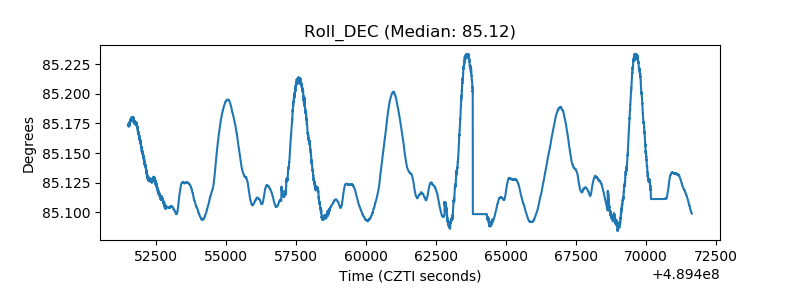 |
| _Roll_RA | 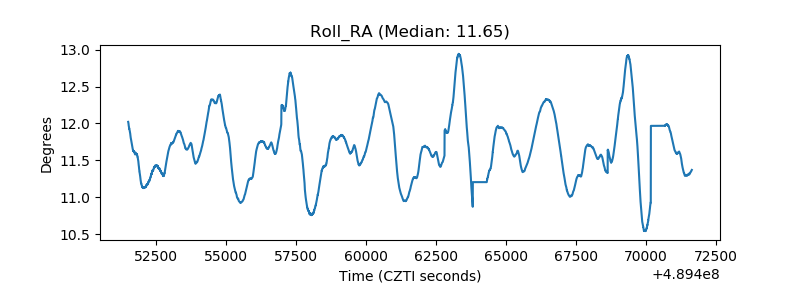 |
| Veto Counter | 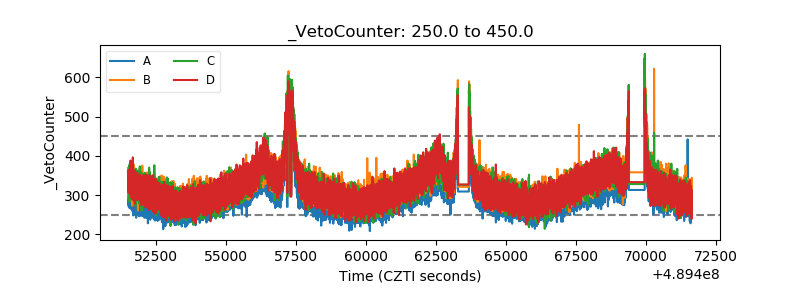 |