| Param | Original file | Final file |
|---|---|---|
| Filename | modeM0/AS1C09_011T08_9000006482_52855cztM0_level2.fits | modeM0/AS1C09_011T08_9000006482_52855cztM0_level2_quad_clean.evt |
| Size (bytes) | 705,055,680 | 85,844,160 |
| Size | 672.4 MB | 81.9 MB |
| Events in quadrant A | 5,630,554 | 599,147 |
| Events in quadrant B | 8,480,768 | 511,125 |
| Events in quadrant C | 3,692,368 | 566,784 |
| Events in quadrant D | 7,804,283 | 478,640 |
| Mode M0 | |||
|---|---|---|---|
| Quadrant | BADHDUFLAG | Total packets | Discarded packets |
| A | 0 | 21203 | 1 |
| B | 0 | 29629 | 1 |
| C | 0 | 15472 | 1 |
| D | 0 | 27644 | 1 |
| Mode M9 | |||
|---|---|---|---|
| Quadrant | BADHDUFLAG | Total packets | Discarded packets |
| A | 0 | 8 | 0 |
| B | 0 | 8 | 0 |
| C | 0 | 8 | 0 |
| D | 0 | 8 | 0 |
| Mode SS | |||
|---|---|---|---|
| Quadrant | BADHDUFLAG | Total packets | Discarded packets |
| A | 0 | 128 | 0 |
| B | 0 | 128 | 0 |
| C | 0 | 128 | 0 |
| D | 0 | 128 | 0 |
| Quadrant | Total seconds | Saturated seconds | Saturation percentage |
|---|---|---|---|
| A | 6353 | 268 | 4.218479% |
| B | 6354 | 1661 | 26.141014% |
| C | 6353 | 187 | 2.943491% |
| D | 6353 | 1158 | 18.227609% |
Noise dominated data is calculated using 1-second bins in cleaned event files. If a bin has >2000 counts, and if more than 50% of those come from <1% of pixels, then it is considered to be noise-dominated and hence unusable.
| Quadrant | # 1 sec bins | Bins with >0 counts | Bins with >2000 counts | High rate bins dominated by noise | Noise dominated (total time) | Noise dominated (detector-on time) | Marked lightcurve |
|---|---|---|---|---|---|---|---|
| A | 7123 | 6354 | 197 | 197 | 2.77% | 3.10% | 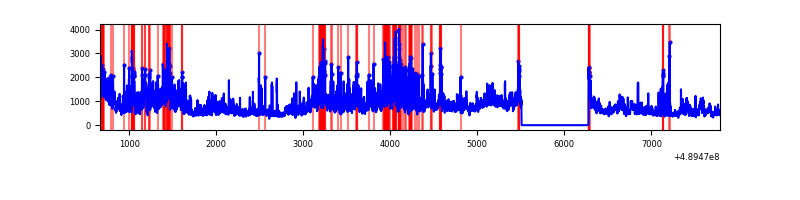 |
| B | 7124 | 6355 | 1175 | 1175 | 16.49% | 18.49% | 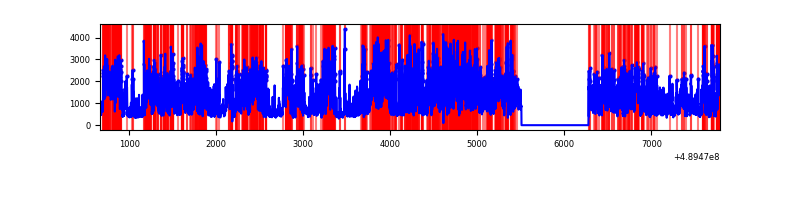 |
| C | 7123 | 6354 | 161 | 161 | 2.26% | 2.53% | 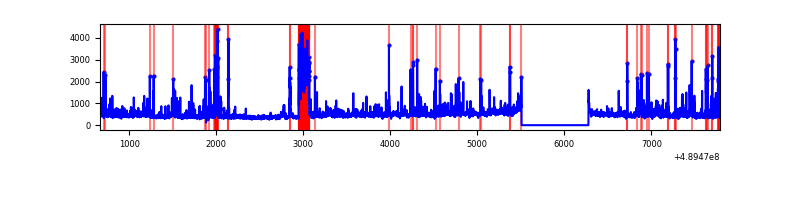 |
| D | 7123 | 6354 | 1076 | 1076 | 15.11% | 16.93% | 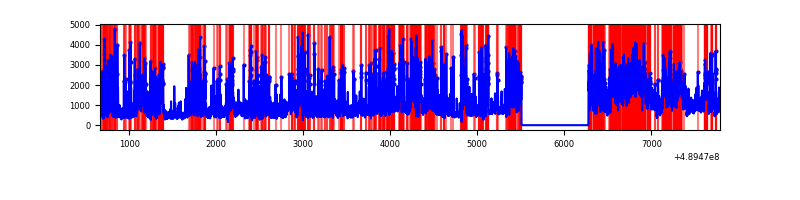 |
Top three noisy pixels from each quadrant. If the there are fewer than three noisy pixels in the level2.evt file, extra rows are filled as -1
| Pixel properties | Quadrant properties | ||||||
|---|---|---|---|---|---|---|---|
| Quadrant | DetID | PixID | Counts | Sigma | Mean | Median | Sigma |
| A | 9 | 191 | 1553450 | 9408.45 | 656 | 639 | 165.0 |
| A | 3 | 14 | 692607 | 4192.62 | 656 | 639 | 165.0 |
| A | 3 | 62 | 463231 | 2802.84 | 656 | 639 | 165.0 |
| B | 8 | 3 | 5568097 | 42754.04 | 608 | 588 | 130.2 |
| B | 1 | 255 | 135409 | 1035.32 | 608 | 588 | 130.2 |
| B | 0 | 171 | 78655 | 599.49 | 608 | 588 | 130.2 |
| C | 13 | 3 | 479637 | 2707.87 | 633 | 628 | 176.9 |
| C | 15 | 224 | 190652 | 1074.21 | 633 | 628 | 176.9 |
| C | 10 | 171 | 71038 | 398.03 | 633 | 628 | 176.9 |
| D | 8 | 176 | 2467051 | 14370.08 | 598 | 571 | 171.6 |
| D | 12 | 2 | 1929994 | 11241.1 | 598 | 571 | 171.6 |
| D | 3 | 224 | 523156 | 3044.66 | 598 | 571 | 171.6 |
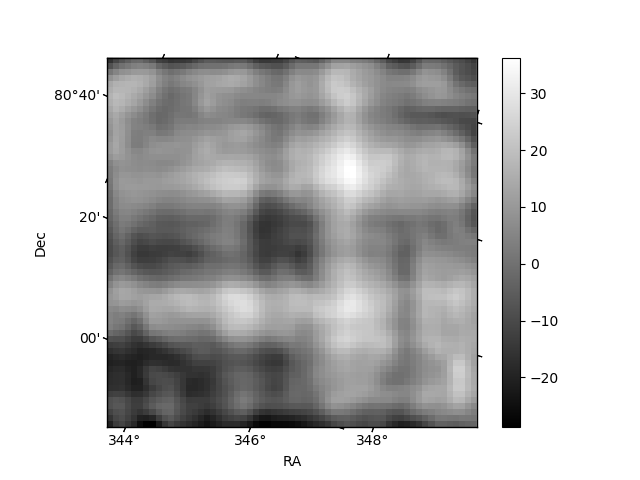
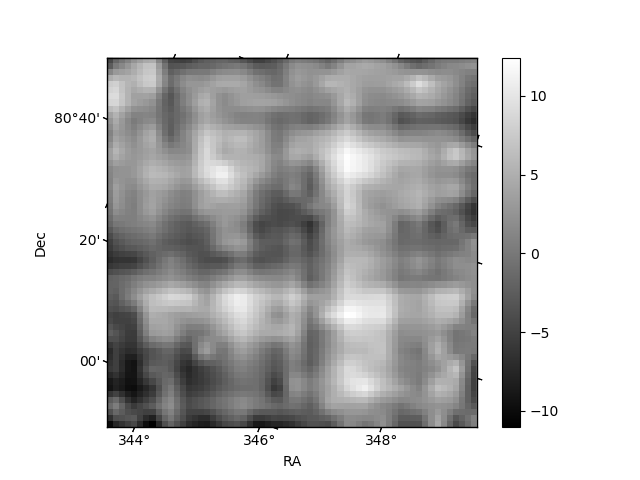
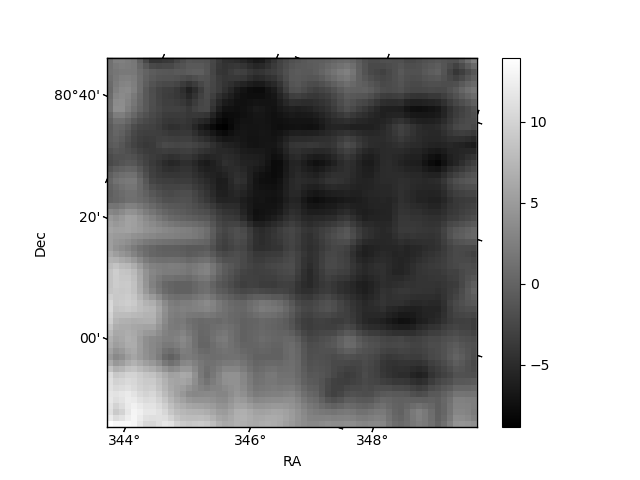
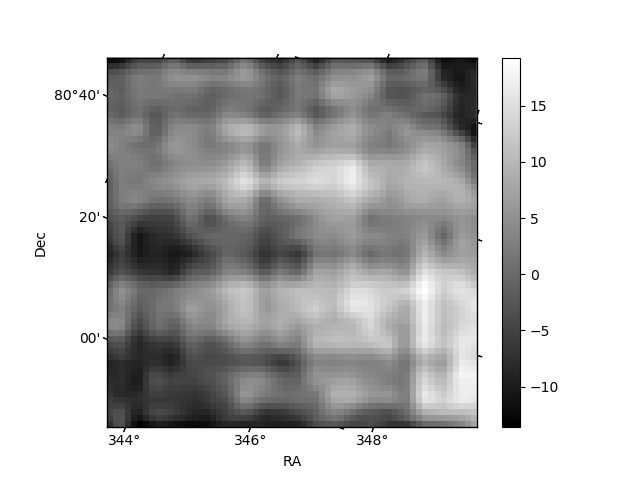
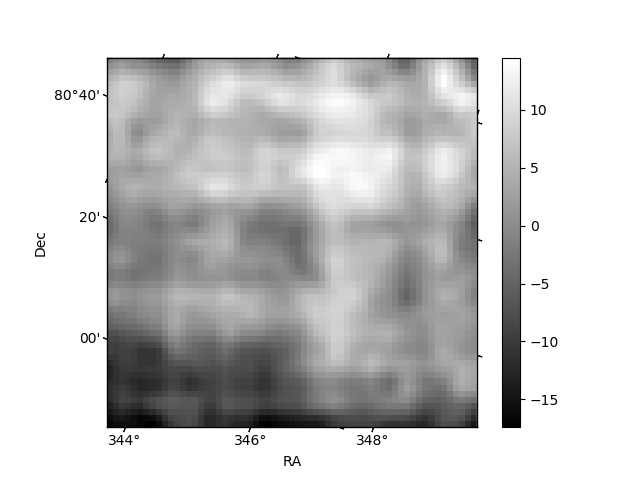
Histogram calculated using DETX and DETY for each event in the final _common_clean file
| Quadrant A | 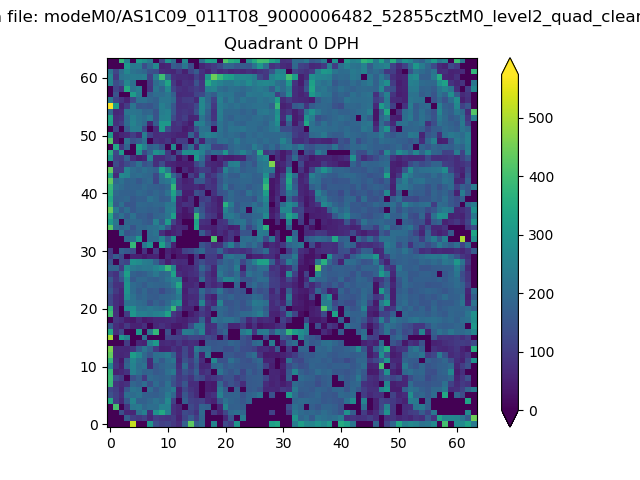 |
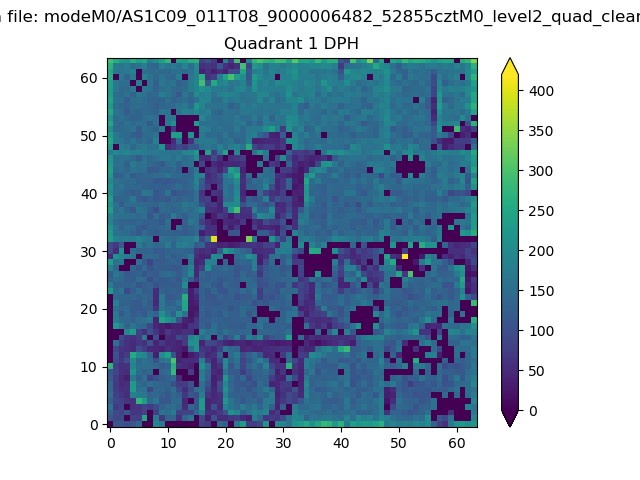 |
Quadrant B |
|---|---|---|---|
| Quadrant D | 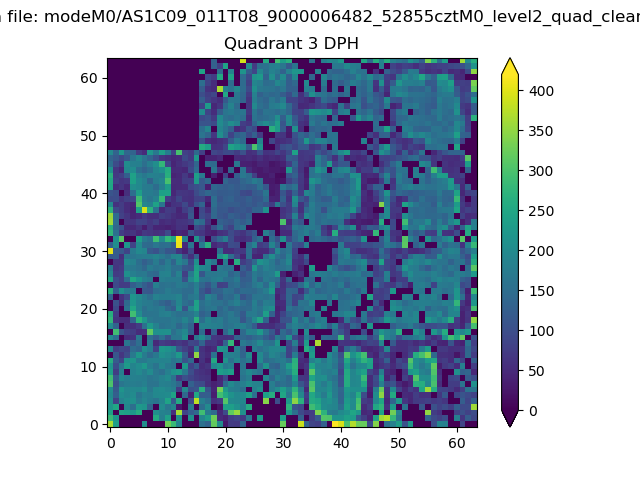 |
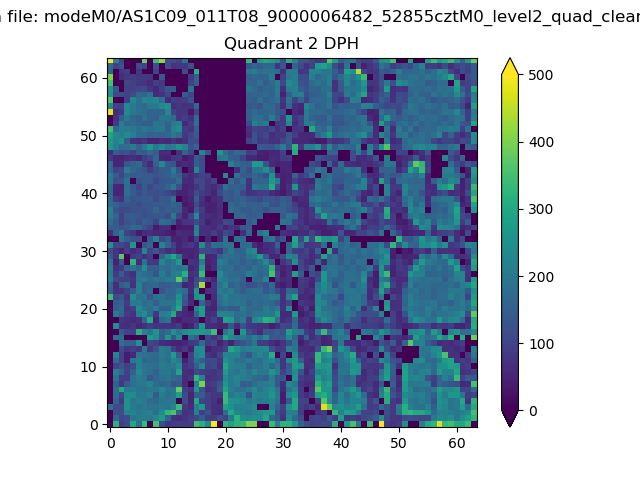 |
Quadrant C |
| Plot type | Count rate plots | Images |
|---|---|---|
| Comparison with Poisson distribution Blue bars denote a histogram of data divided into 1 sec bins. Red curve is a Poisson curve with rate = median count rate of data. |
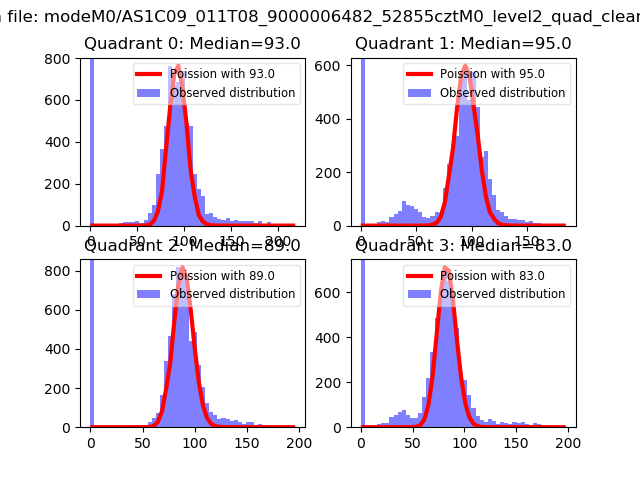 |
 |
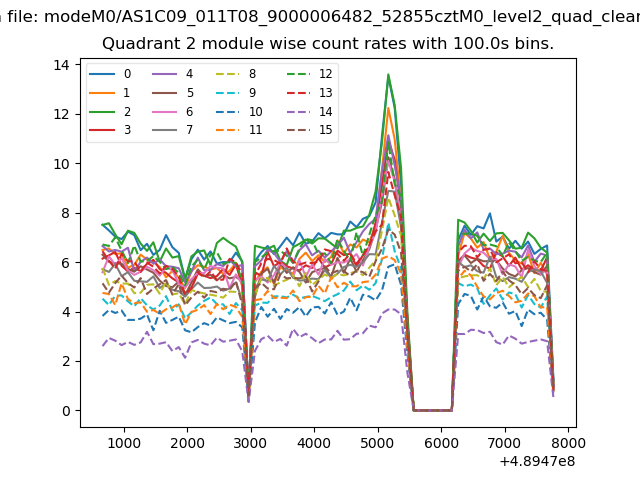
| Quadrant-wise count rates Data is divided into 100 sec bins |
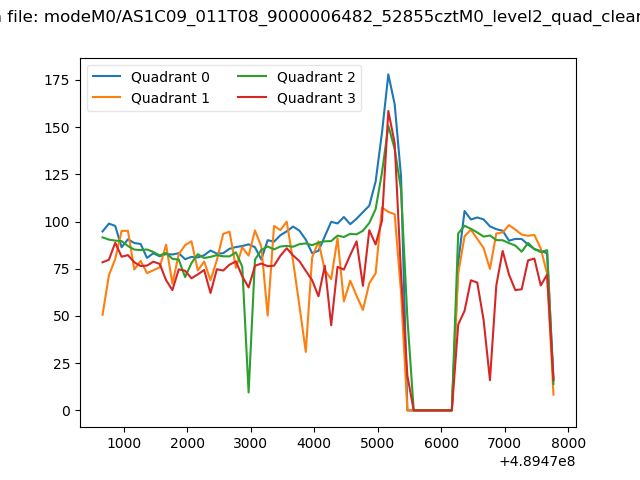 |
|
| Module-wise count rates for Quadrant A Data is divided into 100 sec bins |
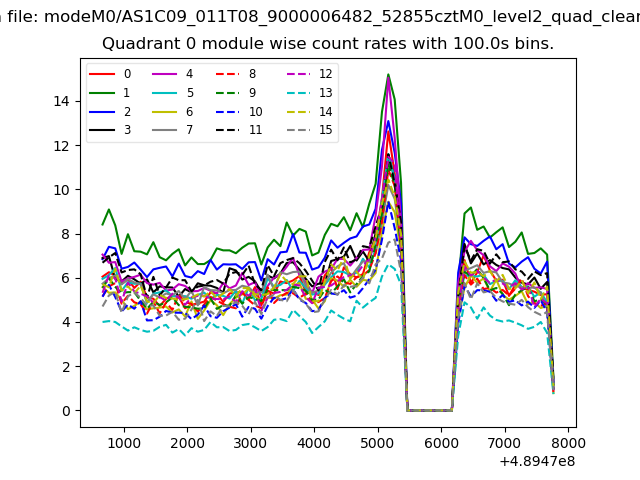 |
 |
| Module-wise count rates for Quadrant B Data is divided into 100 sec bins |
 |
 |
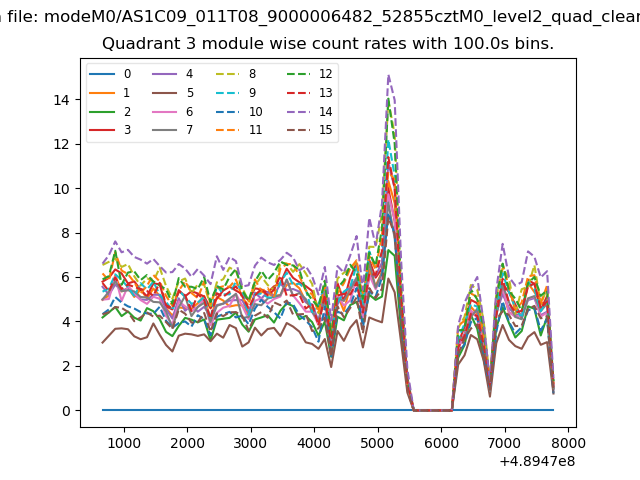
| Module-wise count rates for Quadrant C Data is divided into 100 sec bins |
 |
 |
| Module-wise count rates for Quadrant D Data is divided into 100 sec bins |
 |
 |
| Parameter | Plot |
|---|---|
| CZT HV Monitor | 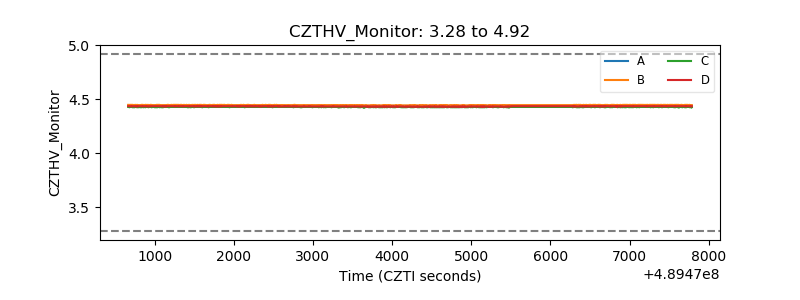 |
| D_VDD | 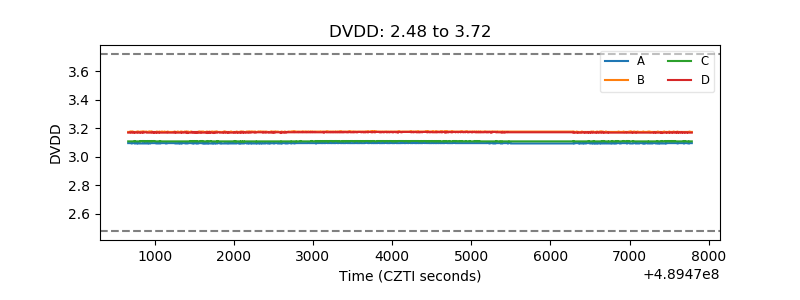 |
| Temperature 1 | 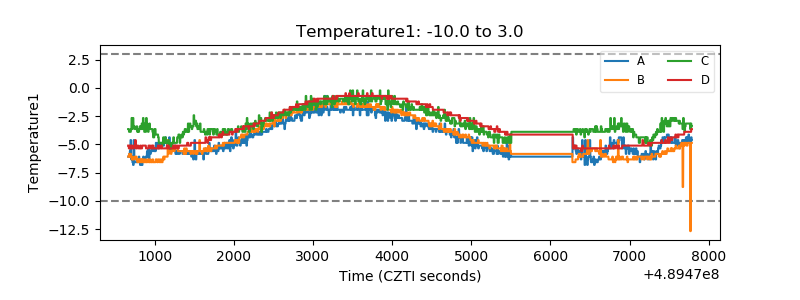 |
| Veto HV Monitor |  |
| Veto LLD | 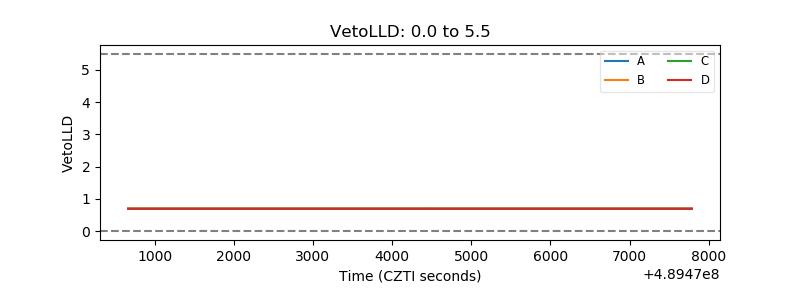 |
| Alpha Counter | 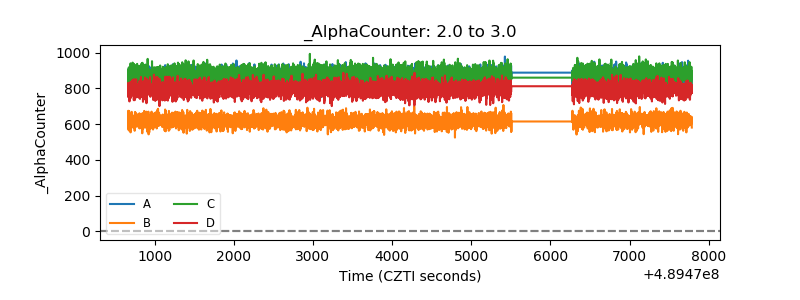 |
| _CPM_Rate | 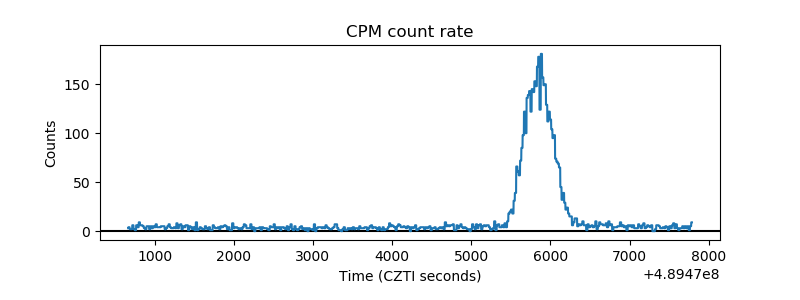 |
| CZT Counter | 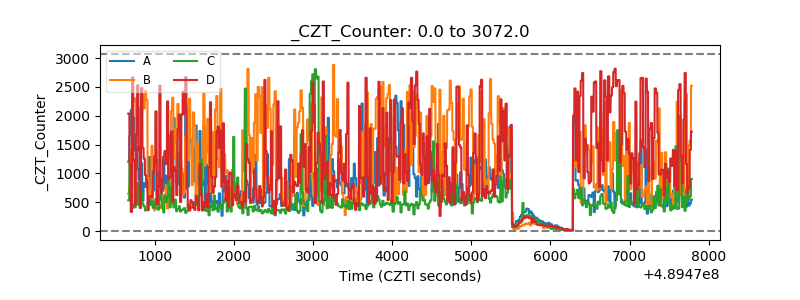 |
| +2.5 Volts monitor |  |
| +5 Volts monitor |  |
| _ROLL_ROT | 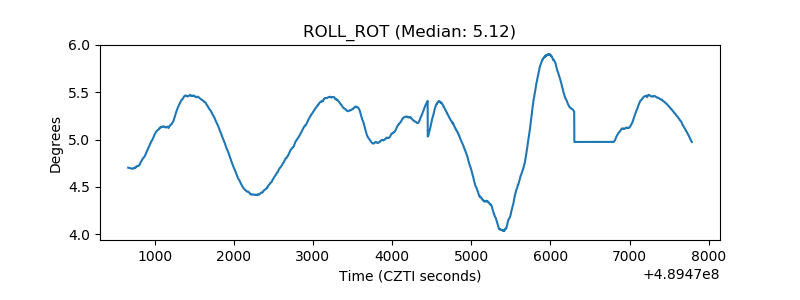 |
| _Roll_DEC | 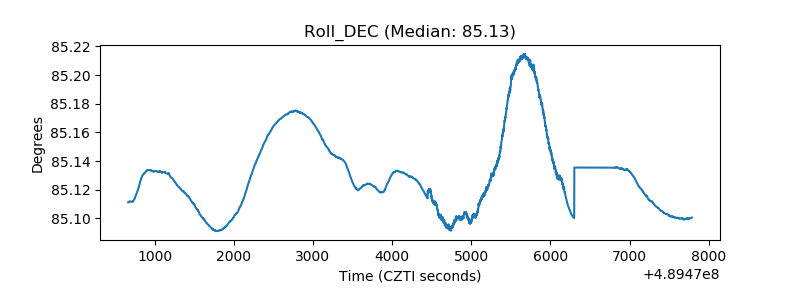 |
| _Roll_RA | 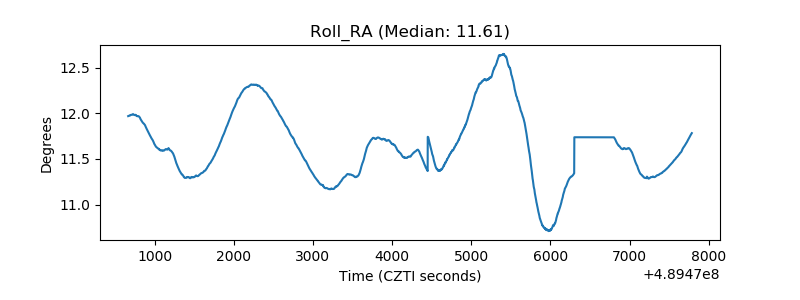 |
| Veto Counter | 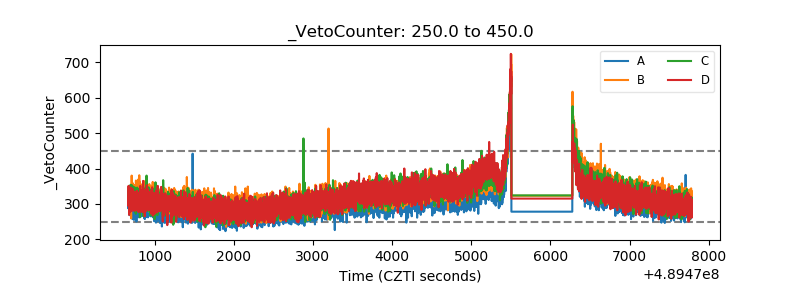 |