| Param | Original file | Final file |
|---|---|---|
| Filename | modeM0/AS1C09_011T08_9000006482_52858cztM0_level2.fits | modeM0/AS1C09_011T08_9000006482_52858cztM0_level2_quad_clean.evt |
| Size (bytes) | 836,438,400 | 81,648,000 |
| Size | 797.7 MB | 77.9 MB |
| Events in quadrant A | 7,704,374 | 550,312 |
| Events in quadrant B | 9,473,588 | 477,253 |
| Events in quadrant C | 4,757,255 | 555,432 |
| Events in quadrant D | 8,533,978 | 442,927 |
| Mode M0 | |||
|---|---|---|---|
| Quadrant | BADHDUFLAG | Total packets | Discarded packets |
| A | 0 | 27422 | 1 |
| B | 0 | 32604 | 1 |
| C | 0 | 18843 | 1 |
| D | 0 | 29783 | 1 |
| Mode M9 | |||
|---|---|---|---|
| Quadrant | BADHDUFLAG | Total packets | Discarded packets |
| A | 0 | 10 | 0 |
| B | 0 | 10 | 0 |
| C | 0 | 10 | 0 |
| D | 0 | 10 | 0 |
| Mode SS | |||
|---|---|---|---|
| Quadrant | BADHDUFLAG | Total packets | Discarded packets |
| A | 0 | 130 | 0 |
| B | 0 | 130 | 0 |
| C | 0 | 130 | 0 |
| D | 0 | 130 | 0 |
| Quadrant | Total seconds | Saturated seconds | Saturation percentage |
|---|---|---|---|
| A | 6388 | 1120 | 17.532874% |
| B | 6389 | 2169 | 33.948975% |
| C | 6389 | 561 | 8.780717% |
| D | 6389 | 1634 | 25.575207% |
Noise dominated data is calculated using 1-second bins in cleaned event files. If a bin has >2000 counts, and if more than 50% of those come from <1% of pixels, then it is considered to be noise-dominated and hence unusable.
| Quadrant | # 1 sec bins | Bins with >0 counts | Bins with >2000 counts | High rate bins dominated by noise | Noise dominated (total time) | Noise dominated (detector-on time) | Marked lightcurve |
|---|---|---|---|---|---|---|---|
| A | 7438 | 6389 | 911 | 911 | 12.25% | 14.26% | 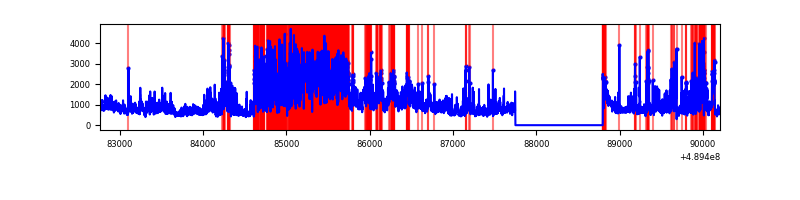 |
| B | 7439 | 6389 | 1617 | 1617 | 21.74% | 25.31% | 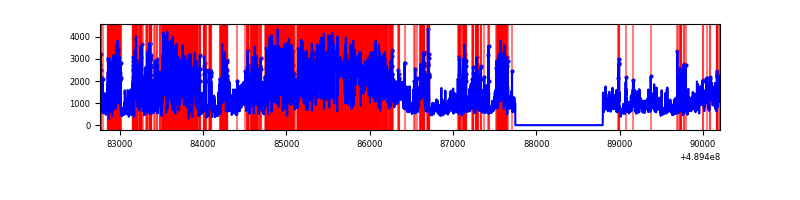 |
| C | 7439 | 6390 | 439 | 439 | 5.90% | 6.87% | 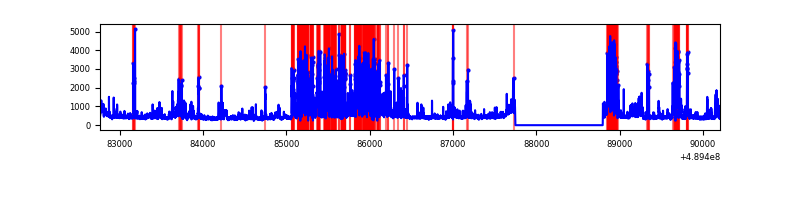 |
| D | 7439 | 6389 | 1497 | 1497 | 20.12% | 23.43% | 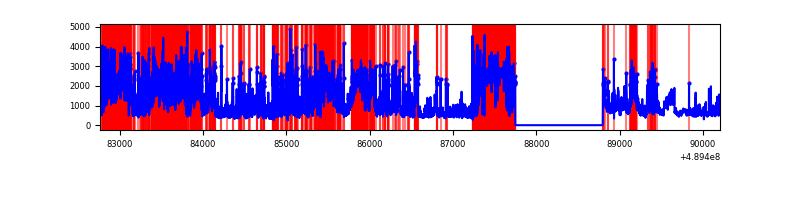 |
Top three noisy pixels from each quadrant. If the there are fewer than three noisy pixels in the level2.evt file, extra rows are filled as -1
| Pixel properties | Quadrant properties | ||||||
|---|---|---|---|---|---|---|---|
| Quadrant | DetID | PixID | Counts | Sigma | Mean | Median | Sigma |
| A | 9 | 191 | 2590613 | 15879.6 | 643 | 628 | 163.1 |
| A | 3 | 62 | 982799 | 6021.84 | 643 | 628 | 163.1 |
| A | 3 | 14 | 936822 | 5739.95 | 643 | 628 | 163.1 |
| B | 8 | 3 | 6705647 | 53523.9 | 592 | 575 | 125.3 |
| B | 4 | 81 | 60581 | 479.0 | 592 | 575 | 125.3 |
| B | 0 | 171 | 60200 | 475.96 | 592 | 575 | 125.3 |
| C | 15 | 224 | 817065 | 4666.75 | 628 | 622 | 174.9 |
| C | 13 | 3 | 591970 | 3380.11 | 628 | 622 | 174.9 |
| C | 14 | 246 | 277144 | 1580.59 | 628 | 622 | 174.9 |
| D | 8 | 176 | 1932334 | 11687.92 | 581 | 557 | 165.3 |
| D | 12 | 2 | 1851924 | 11201.41 | 581 | 557 | 165.3 |
| D | 7 | 96 | 1000620 | 6050.73 | 581 | 557 | 165.3 |
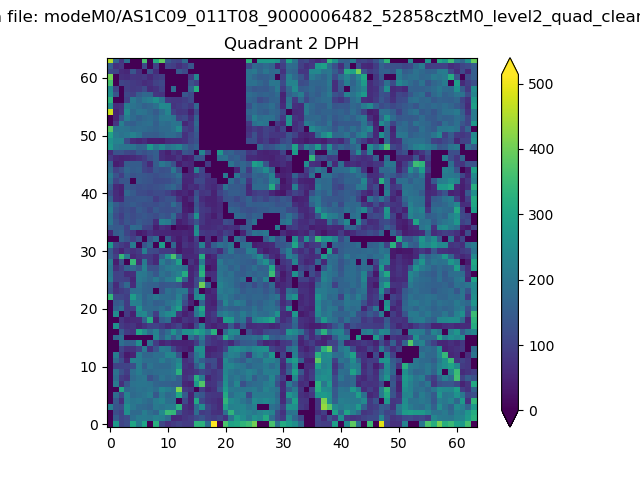
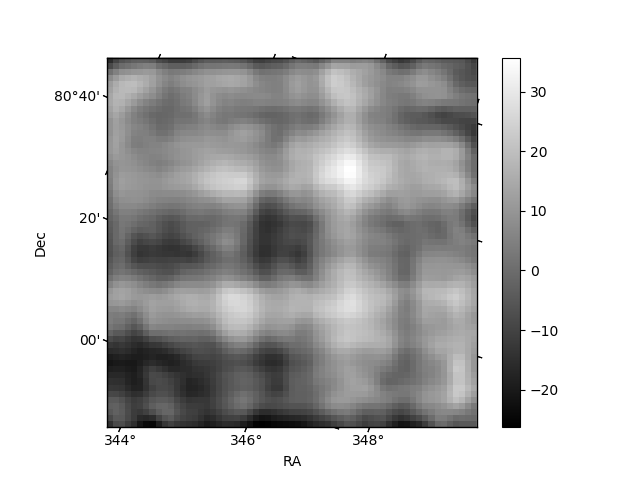
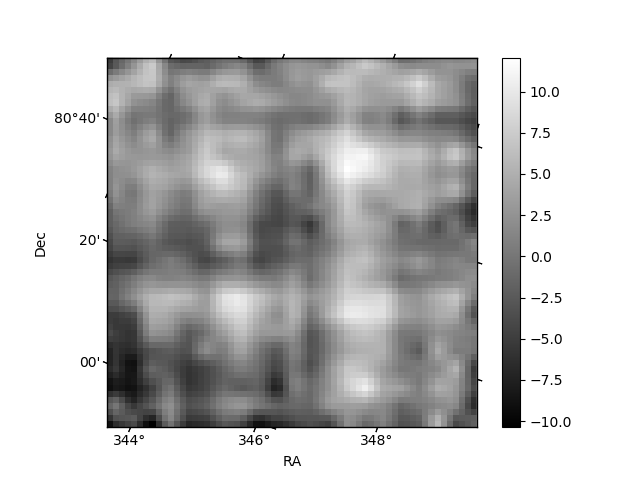
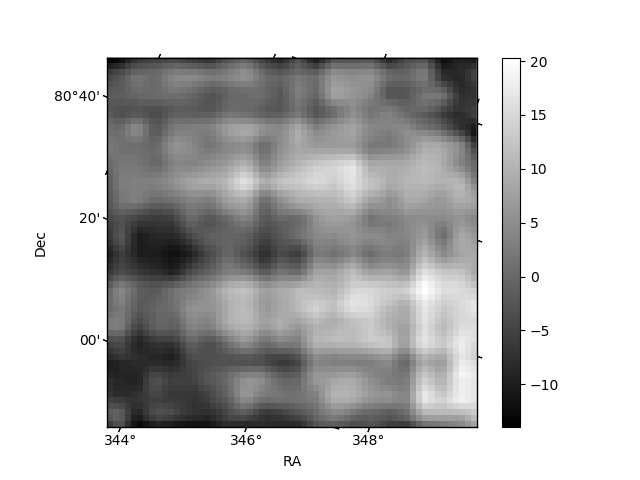
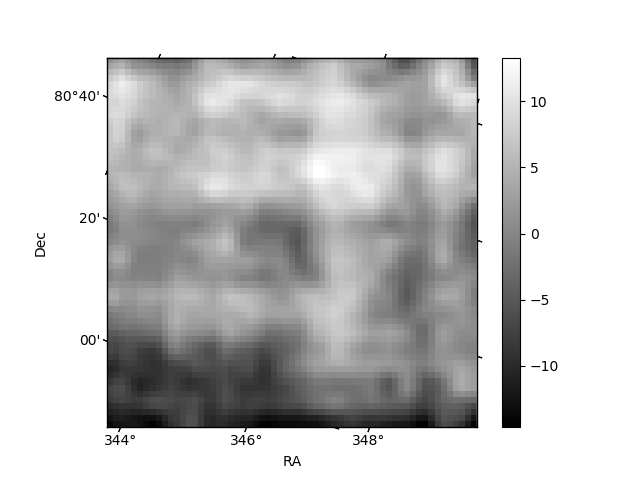
Histogram calculated using DETX and DETY for each event in the final _common_clean file
| Quadrant A | 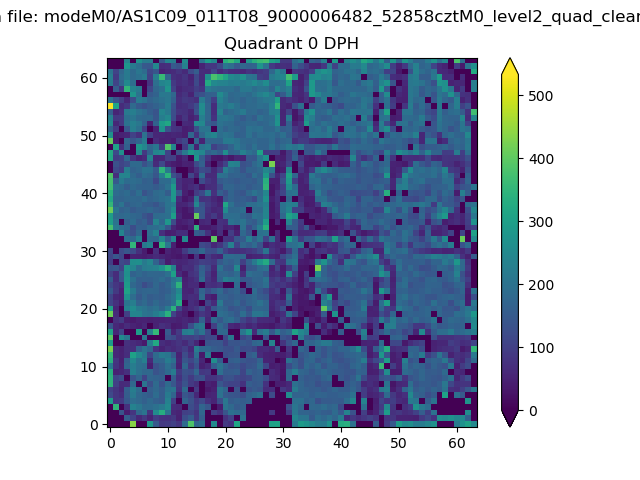 |
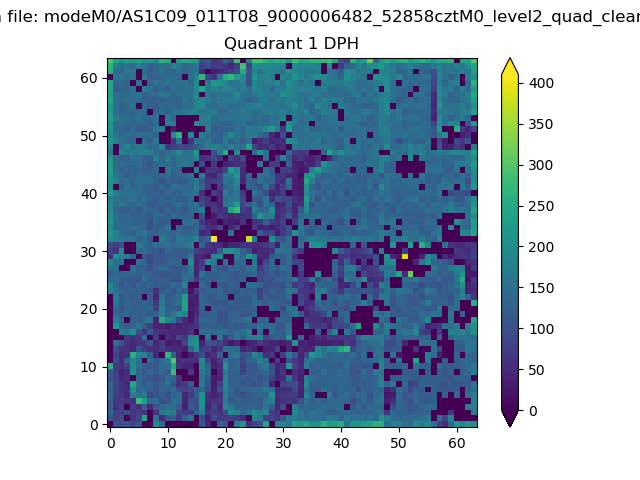 |
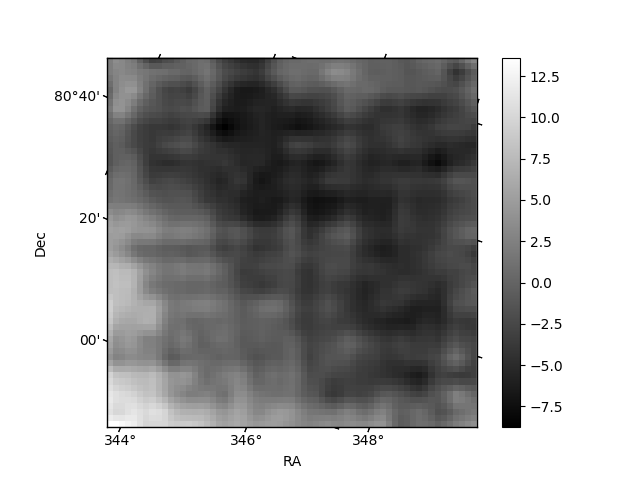
Quadrant B |
|---|---|---|---|
| Quadrant D | 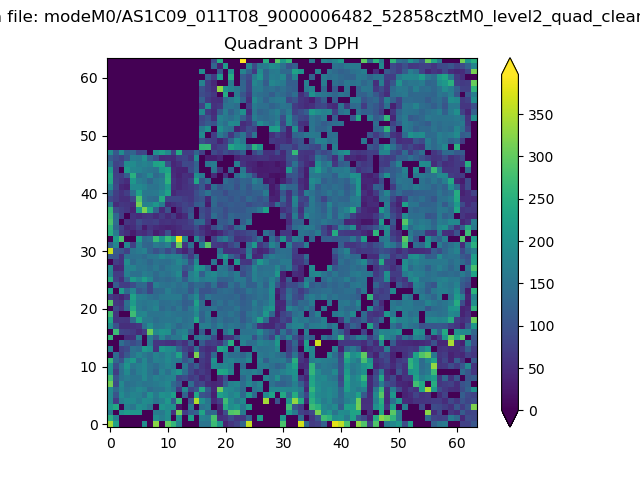 |
 |
Quadrant C |
| Plot type | Count rate plots | Images |
|---|---|---|
| Comparison with Poisson distribution Blue bars denote a histogram of data divided into 1 sec bins. Red curve is a Poisson curve with rate = median count rate of data. |
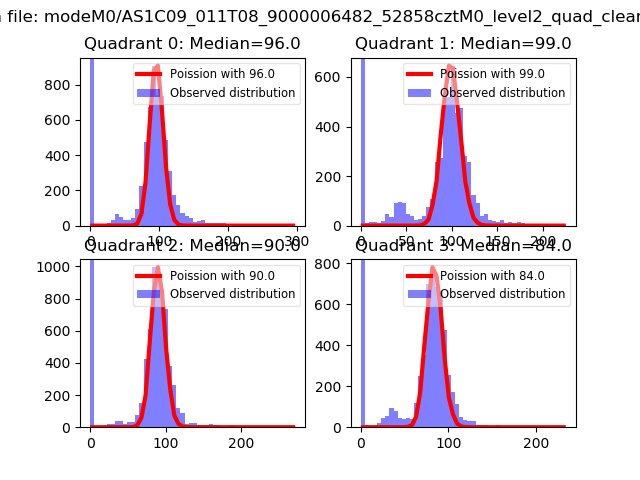 |
 |
| Quadrant-wise count rates Data is divided into 100 sec bins |
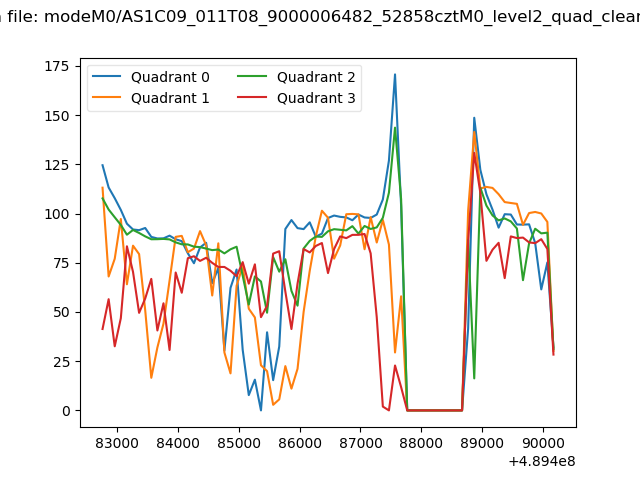 |
|
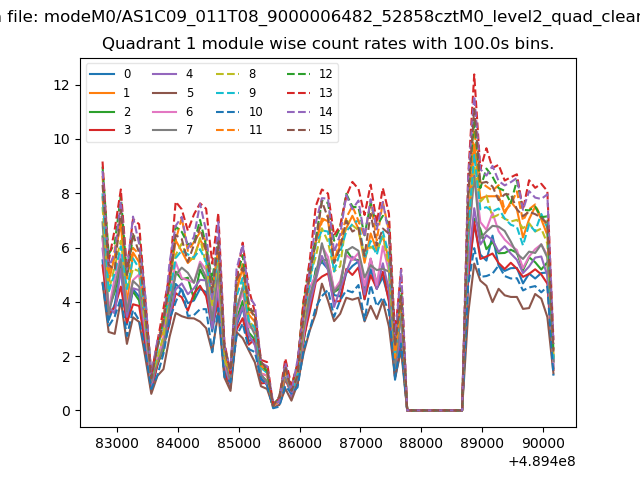
| Module-wise count rates for Quadrant A Data is divided into 100 sec bins |
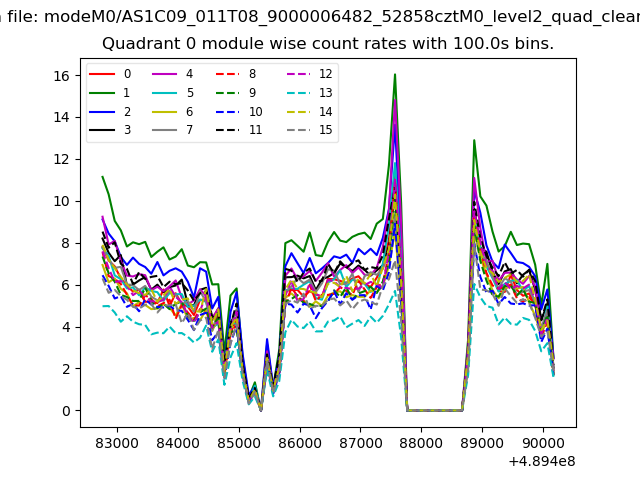 |
 |
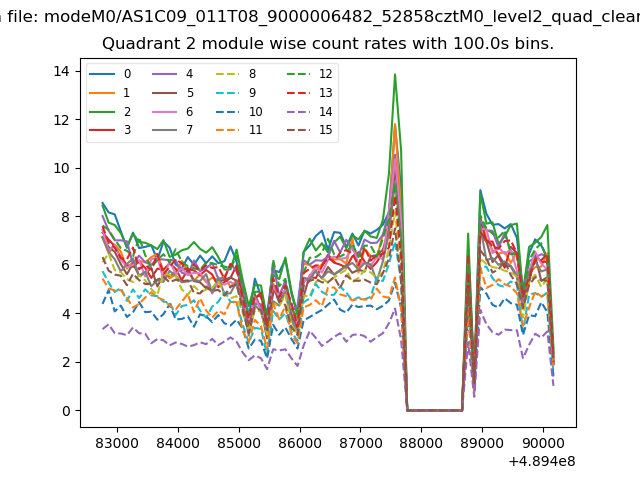
| Module-wise count rates for Quadrant B Data is divided into 100 sec bins |
 |
 |
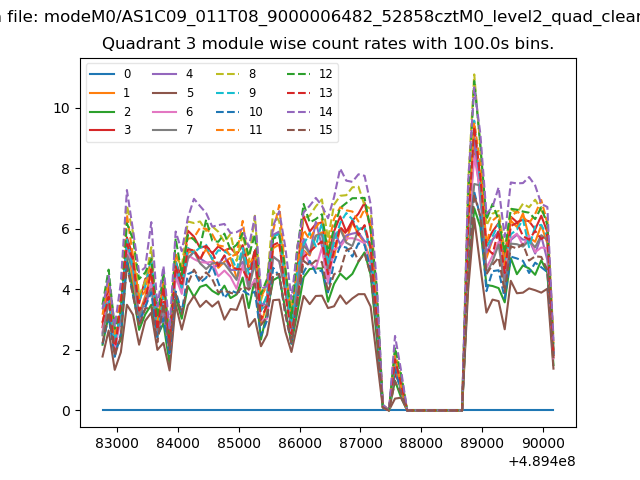
| Module-wise count rates for Quadrant C Data is divided into 100 sec bins |
 |
 |
| Module-wise count rates for Quadrant D Data is divided into 100 sec bins |
 |
 |
| Parameter | Plot |
|---|---|
| CZT HV Monitor | 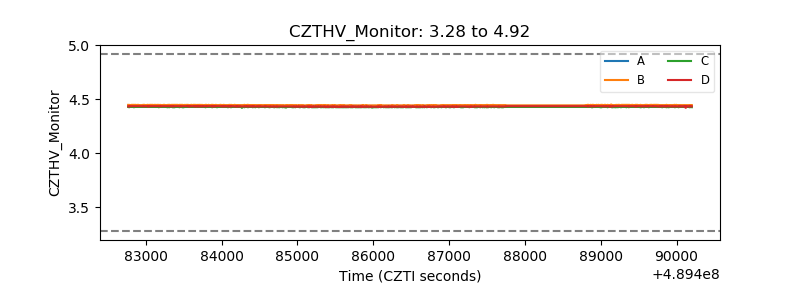 |
| D_VDD | 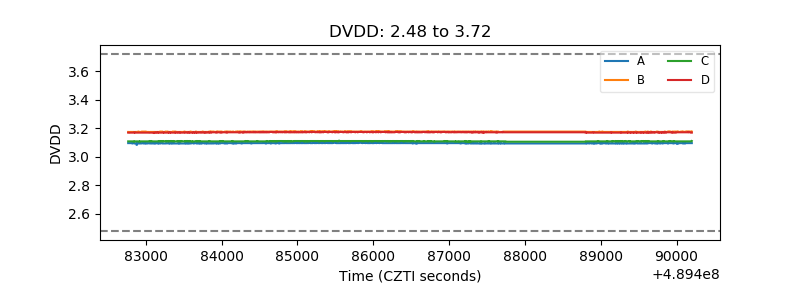 |
| Temperature 1 | 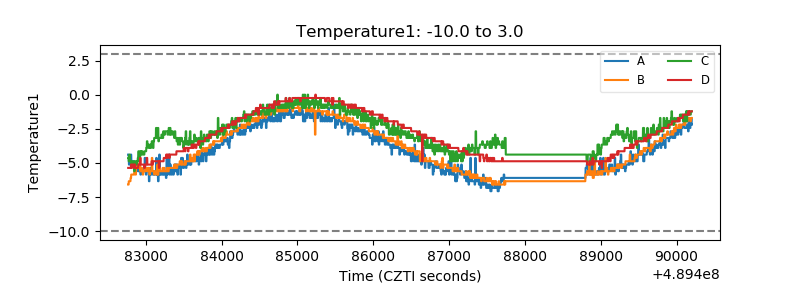 |
| Veto HV Monitor | 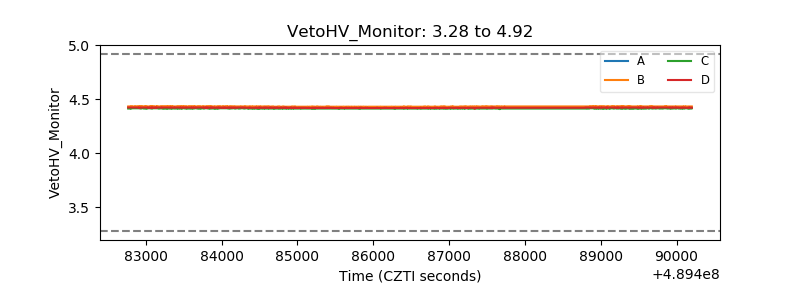 |
| Veto LLD | 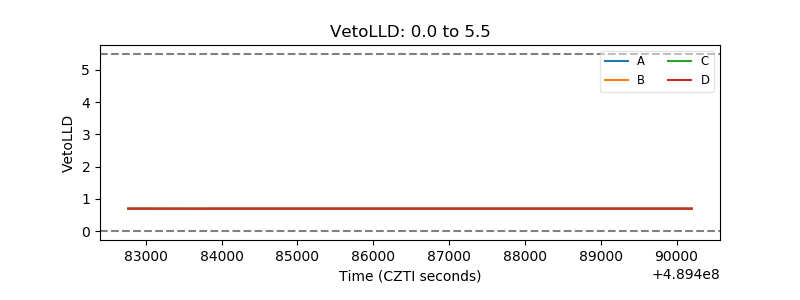 |
| Alpha Counter | 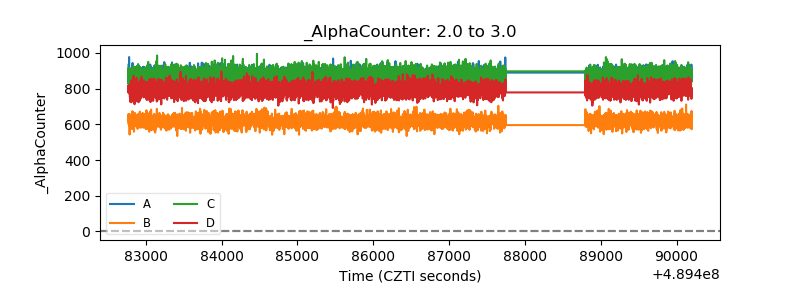 |
| _CPM_Rate | 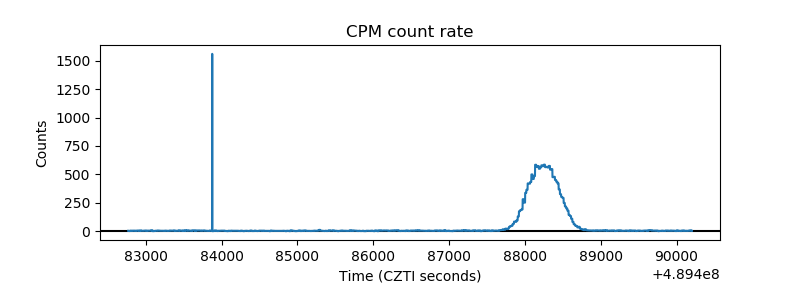 |
| CZT Counter | 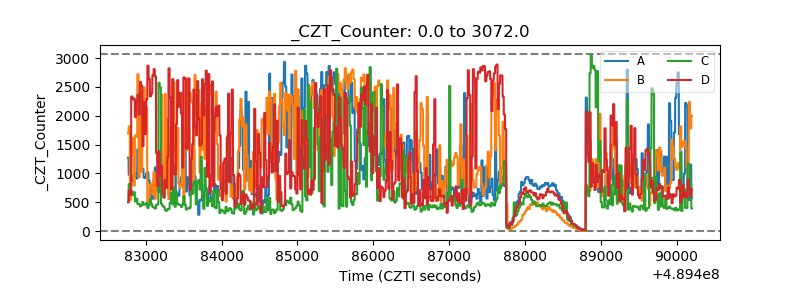 |
| +2.5 Volts monitor |  |
| +5 Volts monitor |  |
| _ROLL_ROT | 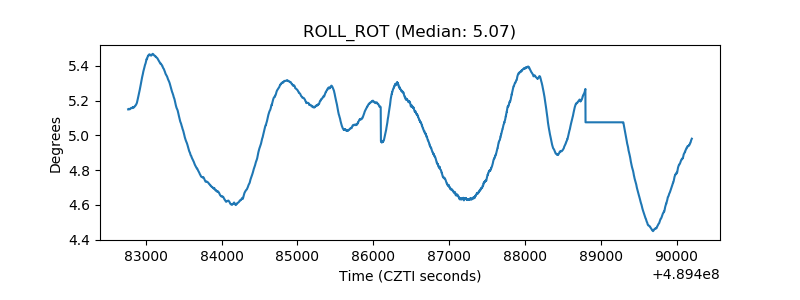 |
| _Roll_DEC | 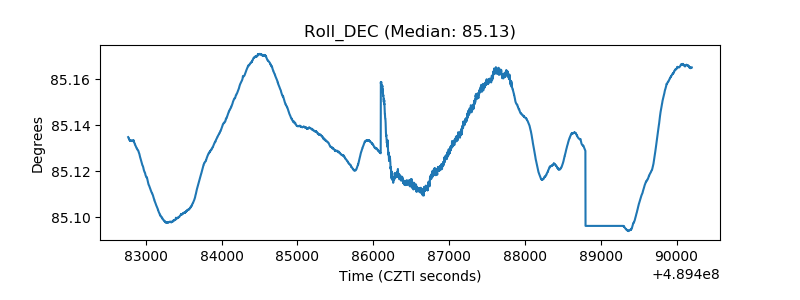 |
| _Roll_RA | 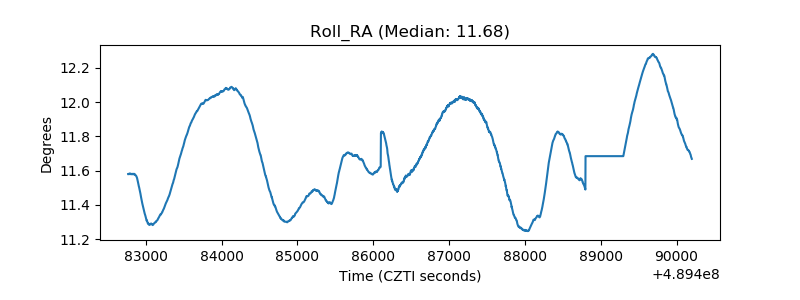 |
| Veto Counter | 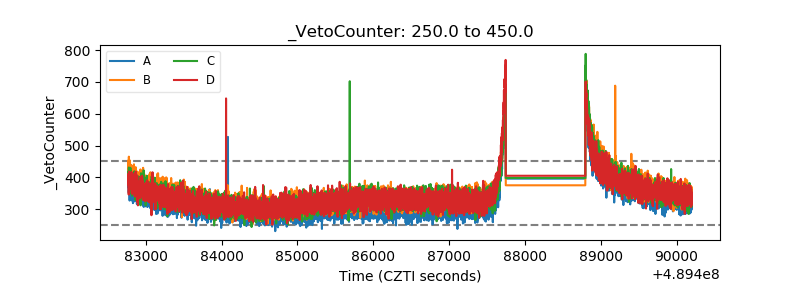 |