| Param | Original file | Final file |
|---|---|---|
| Filename | modeM0/AS1C09_011T08_9000006482_52859cztM0_level2.fits | modeM0/AS1C09_011T08_9000006482_52859cztM0_level2_quad_clean.evt |
| Size (bytes) | 755,694,720 | 81,466,560 |
| Size | 720.7 MB | 77.7 MB |
| Events in quadrant A | 8,532,427 | 481,403 |
| Events in quadrant B | 8,122,091 | 544,281 |
| Events in quadrant C | 4,895,962 | 525,289 |
| Events in quadrant D | 5,960,715 | 497,302 |
| Mode M0 | |||
|---|---|---|---|
| Quadrant | BADHDUFLAG | Total packets | Discarded packets |
| A | 0 | 29547 | 8 |
| B | 0 | 28366 | 1 |
| C | 0 | 18776 | 1 |
| D | 0 | 21829 | 1 |
| Mode M9 | |||
|---|---|---|---|
| Quadrant | BADHDUFLAG | Total packets | Discarded packets |
| A | 0 | 12 | 0 |
| B | 0 | 12 | 0 |
| C | 0 | 12 | 0 |
| D | 0 | 12 | 0 |
| Mode SS | |||
|---|---|---|---|
| Quadrant | BADHDUFLAG | Total packets | Discarded packets |
| A | 0 | 120 | 0 |
| B | 0 | 120 | 0 |
| C | 0 | 120 | 0 |
| D | 0 | 120 | 0 |
| Quadrant | Total seconds | Saturated seconds | Saturation percentage |
|---|---|---|---|
| A | 5989 | 1659 | 27.700785% |
| B | 5990 | 1328 | 22.170284% |
| C | 5990 | 674 | 11.252087% |
| D | 5990 | 755 | 12.604341% |
Noise dominated data is calculated using 1-second bins in cleaned event files. If a bin has >2000 counts, and if more than 50% of those come from <1% of pixels, then it is considered to be noise-dominated and hence unusable.
| Quadrant | # 1 sec bins | Bins with >0 counts | Bins with >2000 counts | High rate bins dominated by noise | Noise dominated (total time) | Noise dominated (detector-on time) | Marked lightcurve |
|---|---|---|---|---|---|---|---|
| A | 7110 | 5990 | 1403 | 1403 | 19.73% | 23.42% | 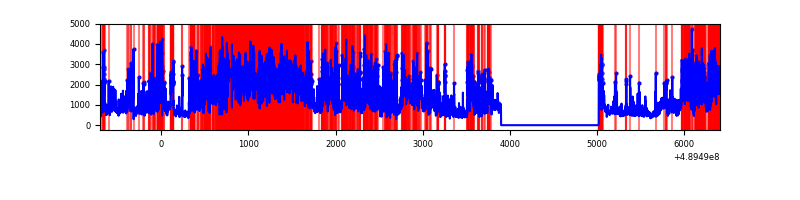 |
| B | 7111 | 5991 | 1093 | 1093 | 15.37% | 18.24% | 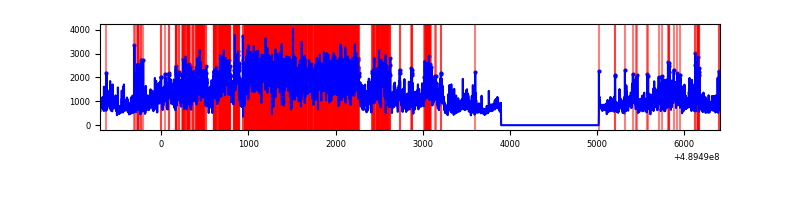 |
| C | 7111 | 5991 | 519 | 519 | 7.30% | 8.66% | 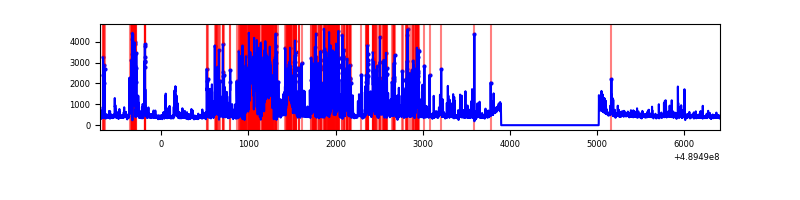 |
| D | 7111 | 5991 | 563 | 563 | 7.92% | 9.40% |  |
Top three noisy pixels from each quadrant. If the there are fewer than three noisy pixels in the level2.evt file, extra rows are filled as -1
| Pixel properties | Quadrant properties | ||||||
|---|---|---|---|---|---|---|---|
| Quadrant | DetID | PixID | Counts | Sigma | Mean | Median | Sigma |
| A | 9 | 191 | 4359897 | 29314.87 | 591 | 577 | 148.7 |
| A | 3 | 62 | 1042392 | 7005.83 | 591 | 577 | 148.7 |
| A | 3 | 14 | 375734 | 2522.79 | 591 | 577 | 148.7 |
| B | 8 | 3 | 5186458 | 39965.47 | 608 | 588 | 129.8 |
| B | 0 | 213 | 91108 | 697.6 | 608 | 588 | 129.8 |
| B | 0 | 171 | 73703 | 563.47 | 608 | 588 | 129.8 |
| C | 15 | 224 | 990858 | 6005.33 | 594 | 586 | 164.9 |
| C | 13 | 3 | 922907 | 5593.26 | 594 | 586 | 164.9 |
| C | 12 | 249 | 273659 | 1656.0 | 594 | 586 | 164.9 |
| D | 8 | 176 | 1180722 | 6777.18 | 599 | 571 | 174.1 |
| D | 2 | 37 | 771501 | 4427.17 | 599 | 571 | 174.1 |
| D | 7 | 96 | 508572 | 2917.27 | 599 | 571 | 174.1 |
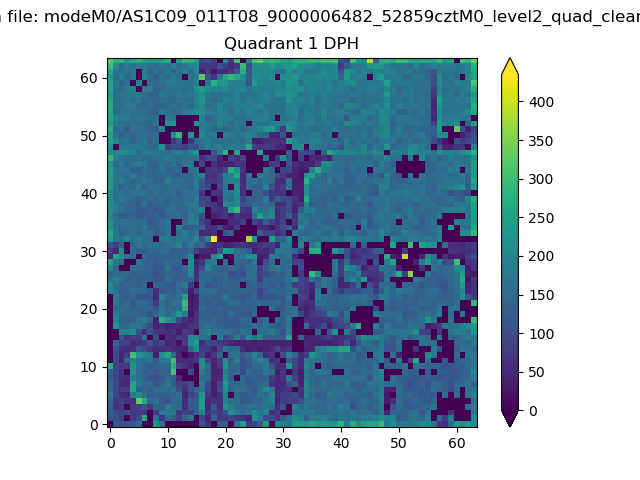
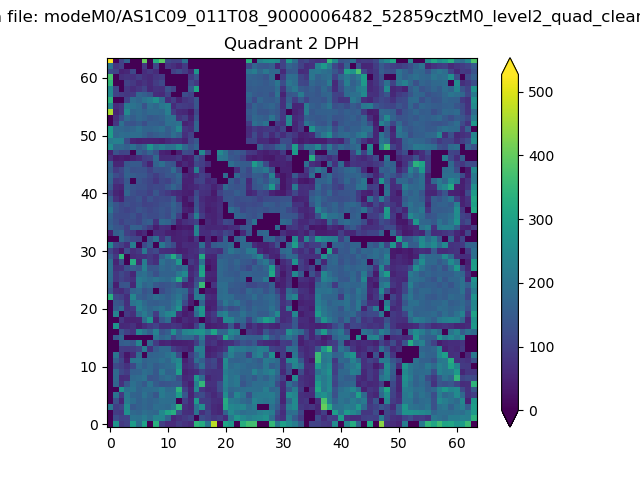
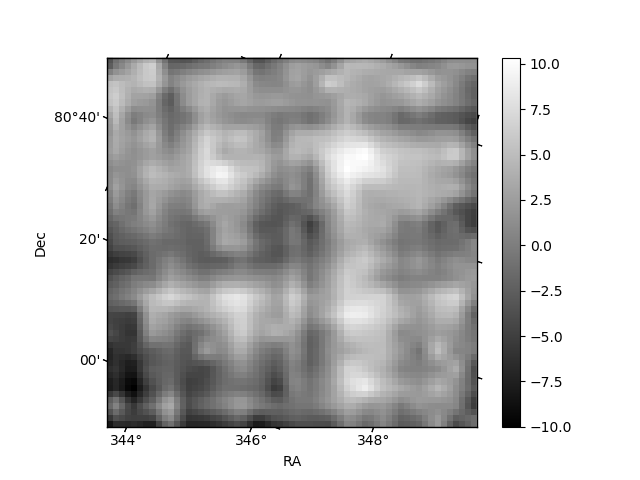
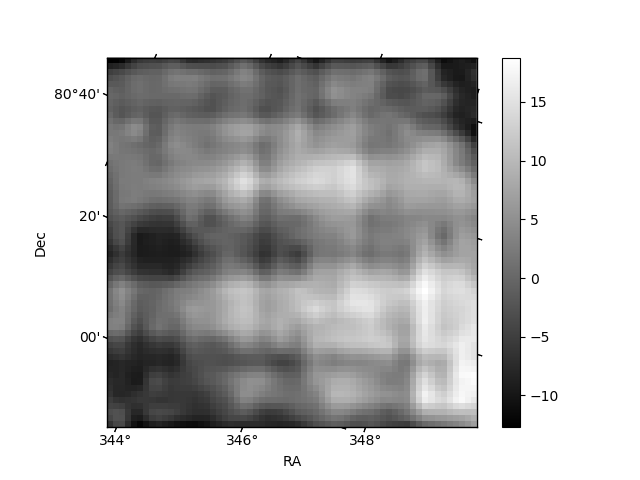
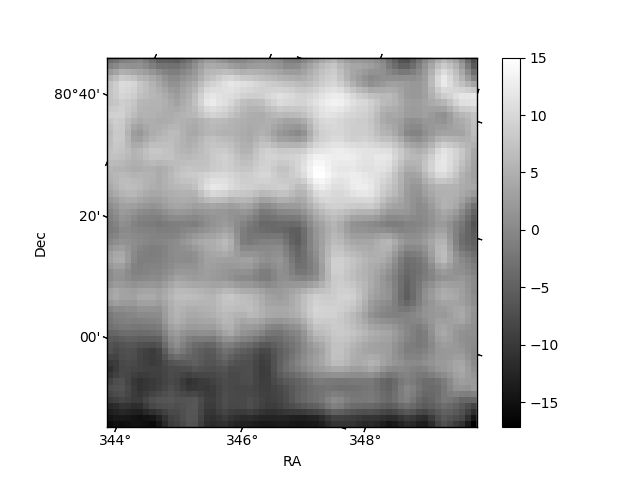
Histogram calculated using DETX and DETY for each event in the final _common_clean file
| Quadrant A | 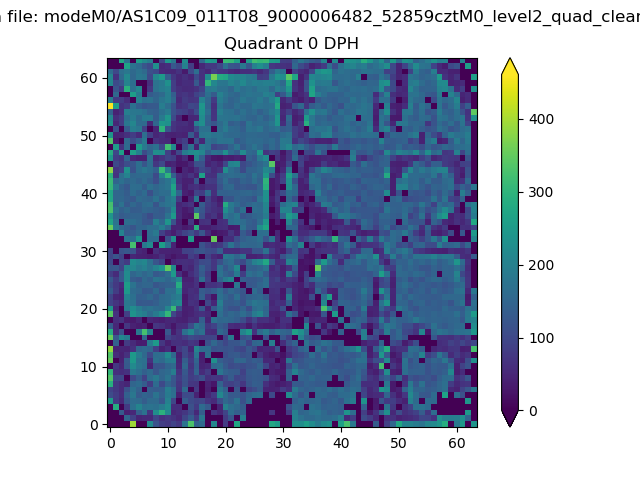 |
 |
Quadrant B |
|---|---|---|---|
| Quadrant D | 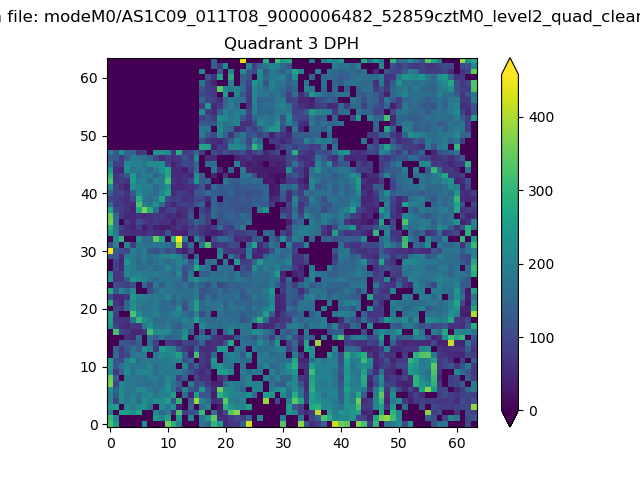 |
 |
Quadrant C |
| Plot type | Count rate plots | Images |
|---|---|---|
| Comparison with Poisson distribution Blue bars denote a histogram of data divided into 1 sec bins. Red curve is a Poisson curve with rate = median count rate of data. |
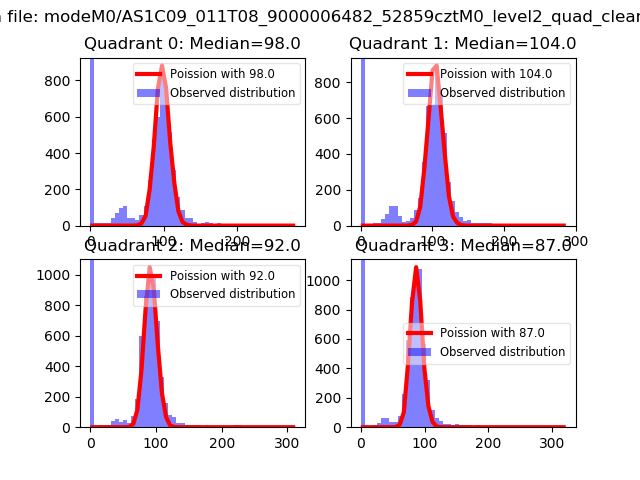 |
 |
| Quadrant-wise count rates Data is divided into 100 sec bins |
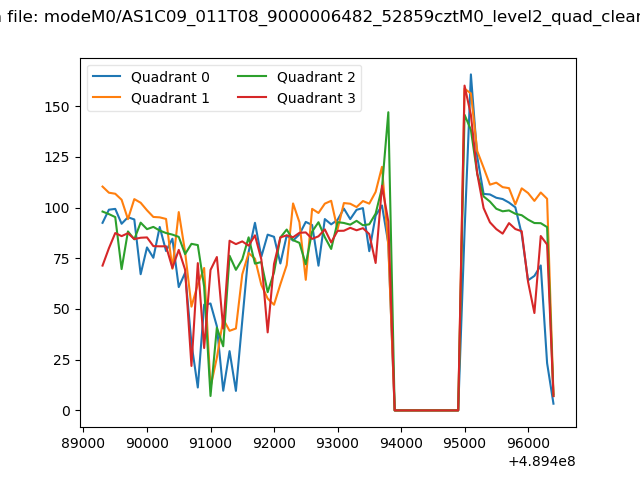 |
|
| Module-wise count rates for Quadrant A Data is divided into 100 sec bins |
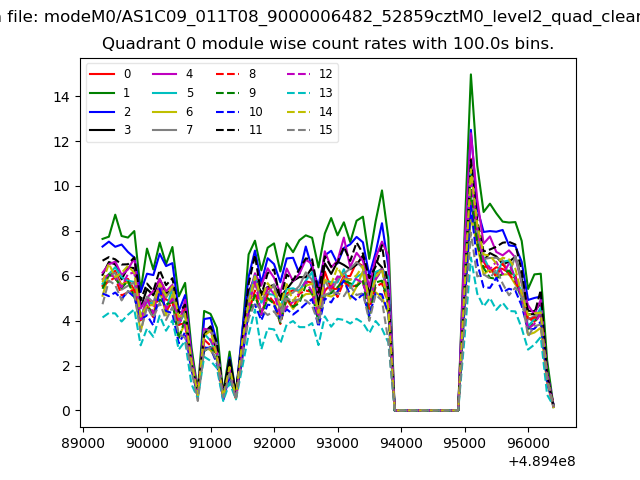 |
 |
| Module-wise count rates for Quadrant B Data is divided into 100 sec bins |
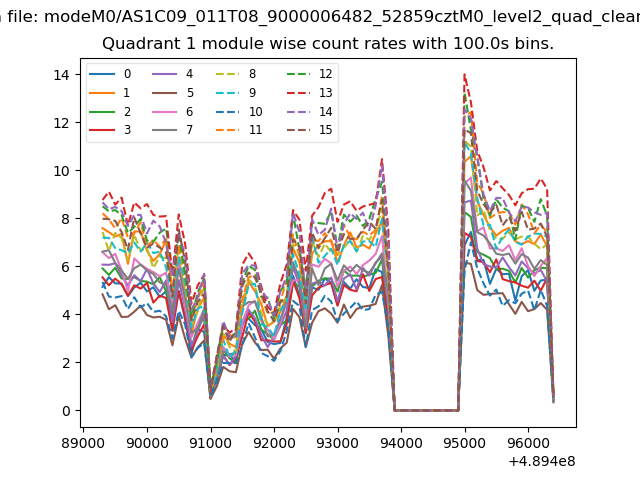 |
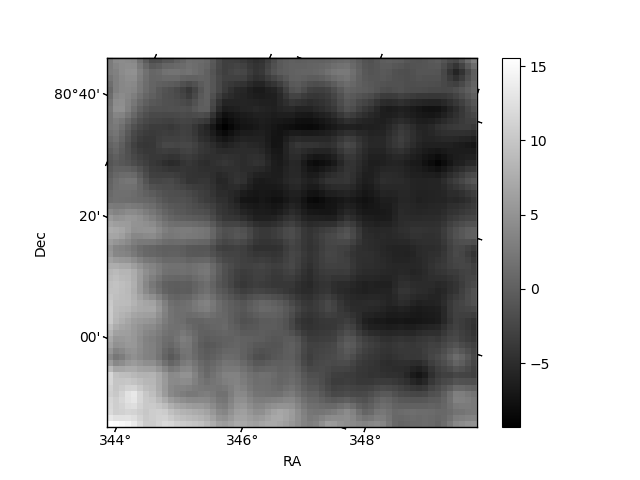 |
| Module-wise count rates for Quadrant C Data is divided into 100 sec bins |
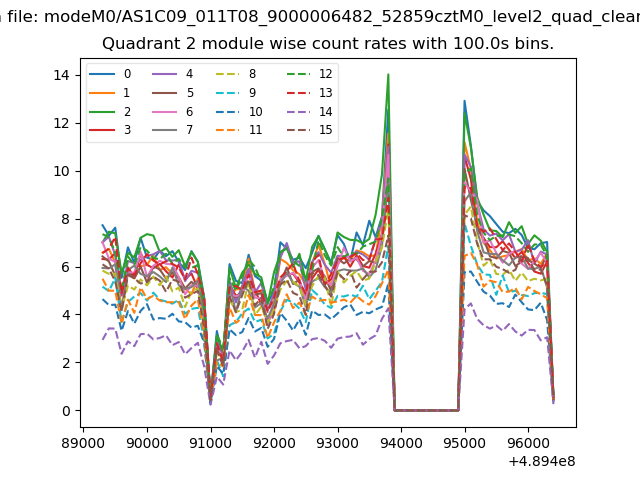 |
 |
| Module-wise count rates for Quadrant D Data is divided into 100 sec bins |
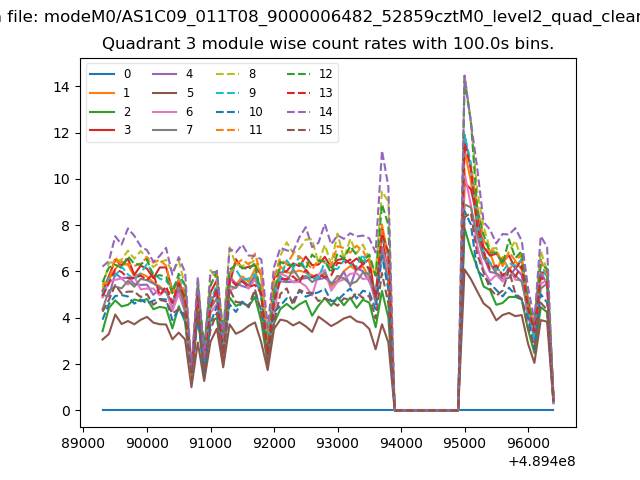 |
 |
| Parameter | Plot |
|---|---|
| CZT HV Monitor | 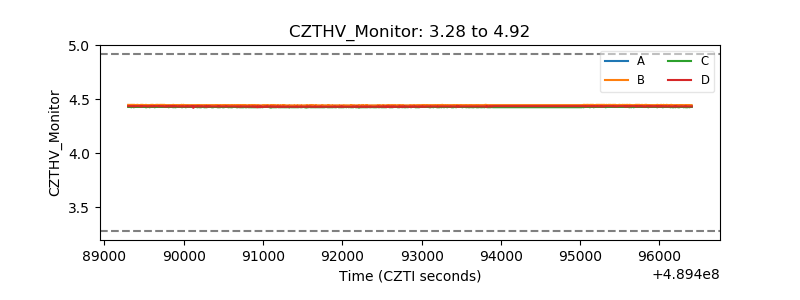 |
| D_VDD | 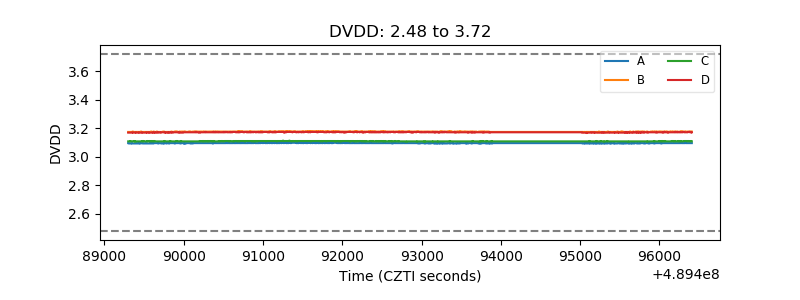 |
| Temperature 1 | 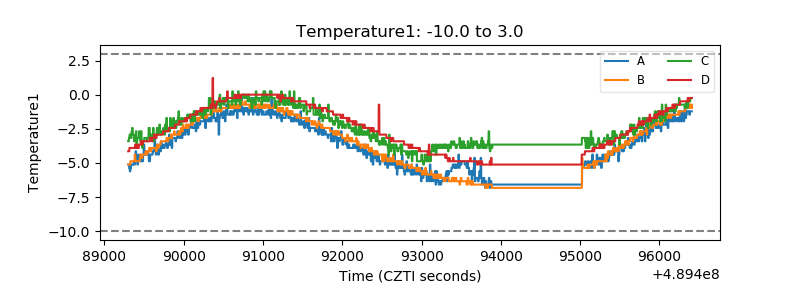 |
| Veto HV Monitor | 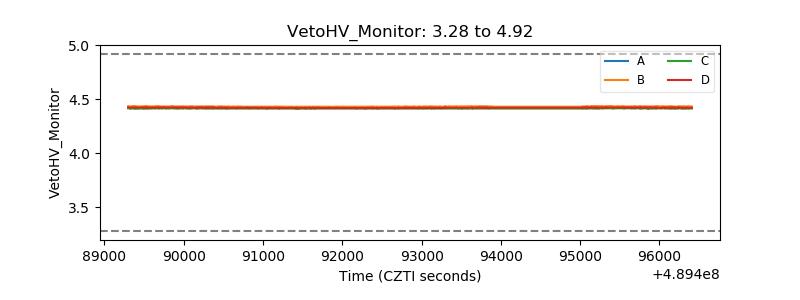 |
| Veto LLD | 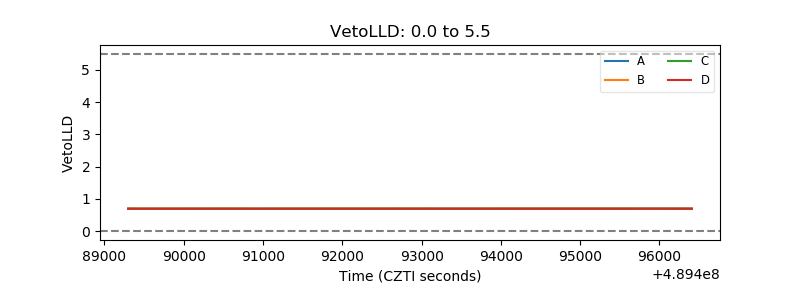 |
| Alpha Counter |  |
| _CPM_Rate | 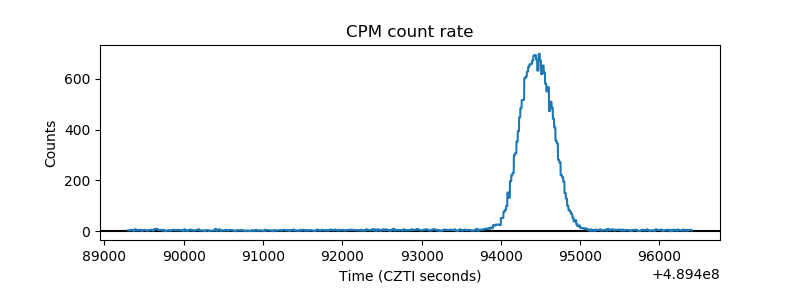 |
| CZT Counter | 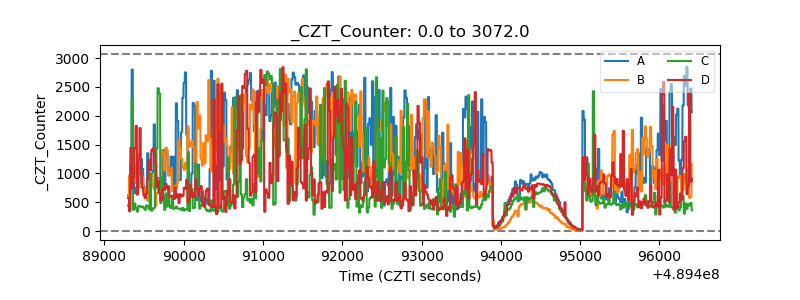 |
| +2.5 Volts monitor | 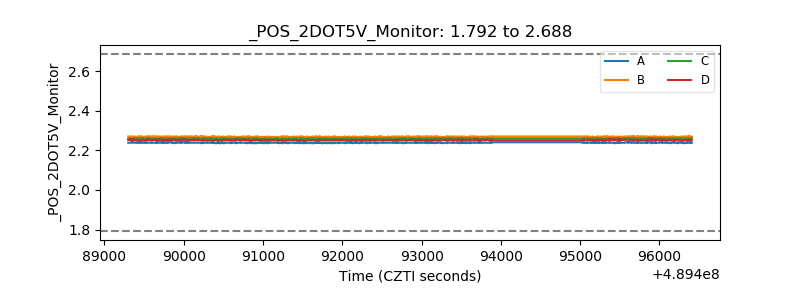 |
| +5 Volts monitor | 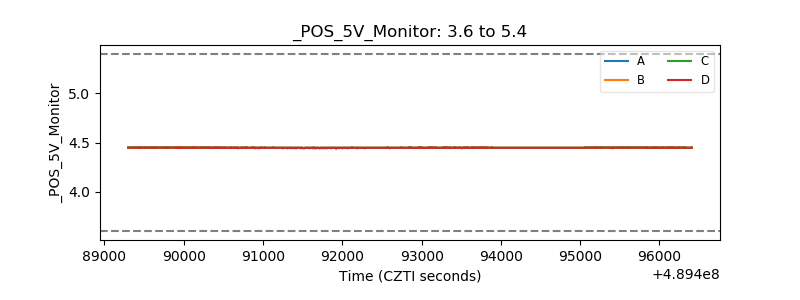 |
| _ROLL_ROT | 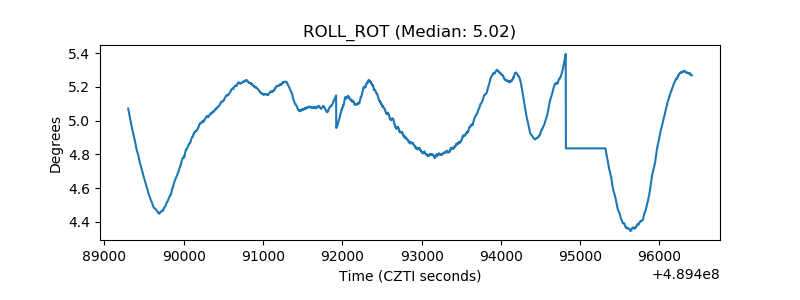 |
| _Roll_DEC | 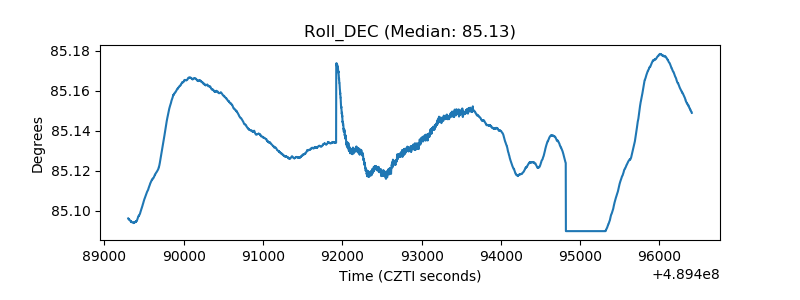 |
| _Roll_RA | 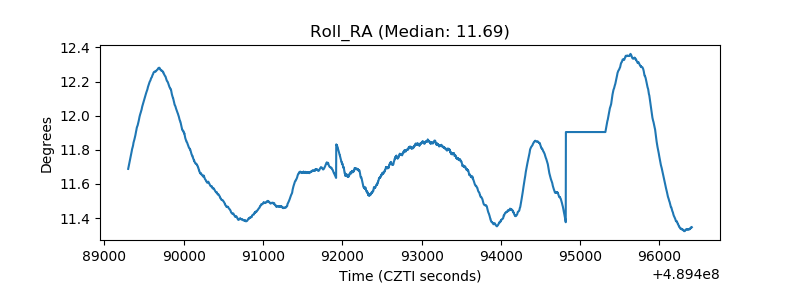 |
| Veto Counter | 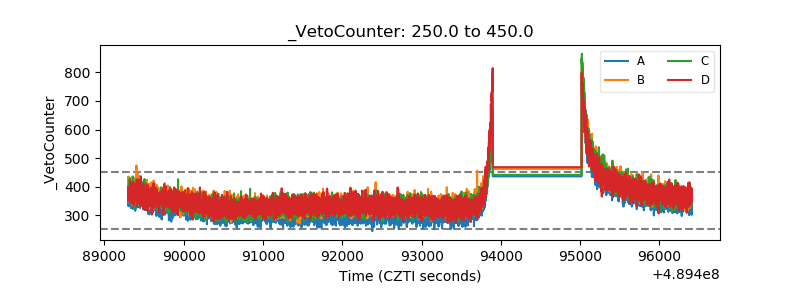 |