| Param | Original file | Final file |
|---|---|---|
| Filename | modeM0/AS1C09_011T08_9000006482_52861cztM0_level2.fits | modeM0/AS1C09_011T08_9000006482_52861cztM0_level2_quad_clean.evt |
| Size (bytes) | 728,991,360 | 76,651,200 |
| Size | 695.2 MB | 73.1 MB |
| Events in quadrant A | 7,533,694 | 497,483 |
| Events in quadrant B | 9,341,616 | 413,549 |
| Events in quadrant C | 4,502,251 | 510,077 |
| Events in quadrant D | 5,151,856 | 487,092 |
| Mode M0 | |||
|---|---|---|---|
| Quadrant | BADHDUFLAG | Total packets | Discarded packets |
| A | 0 | 26491 | 6 |
| B | 0 | 31887 | 1 |
| C | 0 | 17466 | 1 |
| D | 0 | 19320 | 1 |
| Mode M9 | |||
|---|---|---|---|
| Quadrant | BADHDUFLAG | Total packets | Discarded packets |
| A | 0 | 11 | 0 |
| B | 0 | 11 | 0 |
| C | 0 | 11 | 0 |
| D | 0 | 11 | 0 |
| Mode SS | |||
|---|---|---|---|
| Quadrant | BADHDUFLAG | Total packets | Discarded packets |
| A | 0 | 122 | 0 |
| B | 0 | 122 | 0 |
| C | 0 | 122 | 0 |
| D | 0 | 122 | 0 |
| Quadrant | Total seconds | Saturated seconds | Saturation percentage |
|---|---|---|---|
| A | 5892 | 1234 | 20.943652% |
| B | 5893 | 2255 | 38.265739% |
| C | 5893 | 533 | 9.044629% |
| D | 5893 | 599 | 10.164602% |
Noise dominated data is calculated using 1-second bins in cleaned event files. If a bin has >2000 counts, and if more than 50% of those come from <1% of pixels, then it is considered to be noise-dominated and hence unusable.
| Quadrant | # 1 sec bins | Bins with >0 counts | Bins with >2000 counts | High rate bins dominated by noise | Noise dominated (total time) | Noise dominated (detector-on time) | Marked lightcurve |
|---|---|---|---|---|---|---|---|
| A | 7047 | 5893 | 1035 | 1035 | 14.69% | 17.56% | 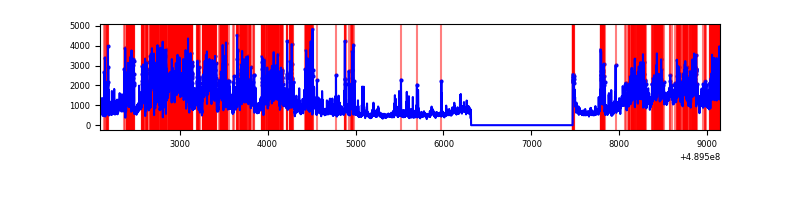 |
| B | 7047 | 5892 | 1652 | 1652 | 23.44% | 28.04% | 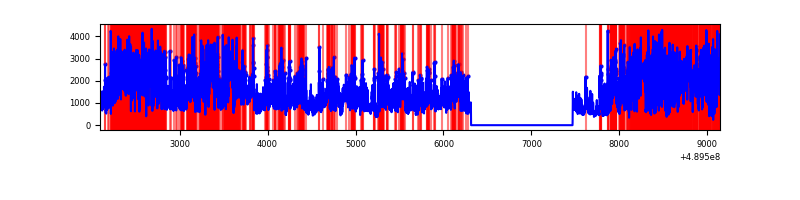 |
| C | 7048 | 5894 | 380 | 380 | 5.39% | 6.45% | 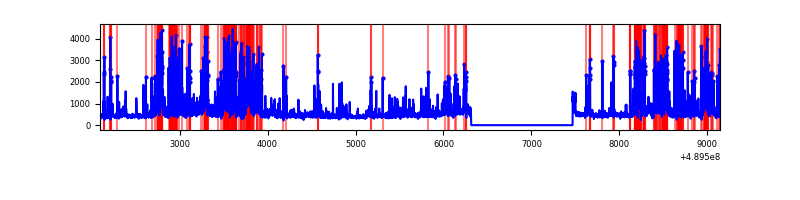 |
| D | 7048 | 5894 | 477 | 477 | 6.77% | 8.09% | 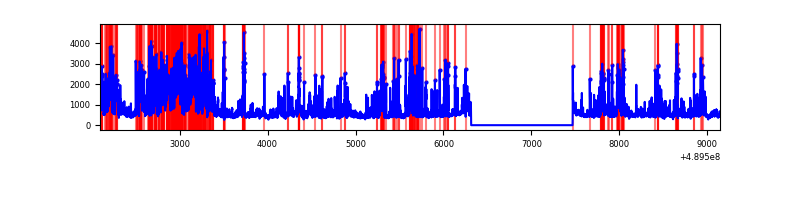 |
Top three noisy pixels from each quadrant. If the there are fewer than three noisy pixels in the level2.evt file, extra rows are filled as -1
| Pixel properties | Quadrant properties | ||||||
|---|---|---|---|---|---|---|---|
| Quadrant | DetID | PixID | Counts | Sigma | Mean | Median | Sigma |
| A | 9 | 191 | 3428165 | 23095.79 | 593 | 580 | 148.4 |
| A | 3 | 62 | 1075723 | 7244.54 | 593 | 580 | 148.4 |
| A | 5 | 241 | 106404 | 713.06 | 593 | 580 | 148.4 |
| B | 8 | 3 | 6486759 | 58357.08 | 528 | 510 | 111.1 |
| B | 0 | 213 | 237001 | 2127.72 | 528 | 510 | 111.1 |
| B | 10 | 254 | 80344 | 718.27 | 528 | 510 | 111.1 |
| C | 15 | 224 | 1377125 | 8404.25 | 591 | 584 | 163.8 |
| C | 13 | 3 | 352139 | 2146.36 | 591 | 584 | 163.8 |
| C | 1 | 44 | 89222 | 541.17 | 591 | 584 | 163.8 |
| D | 8 | 176 | 1058906 | 6287.02 | 594 | 568 | 168.3 |
| D | 2 | 37 | 816610 | 4847.67 | 594 | 568 | 168.3 |
| D | 12 | 17 | 230924 | 1368.42 | 594 | 568 | 168.3 |
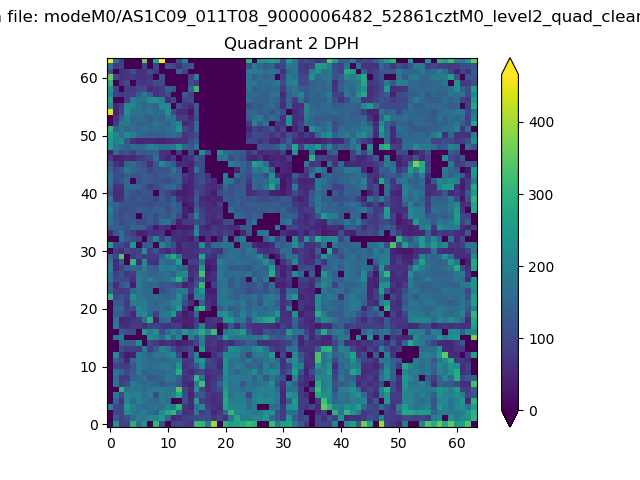
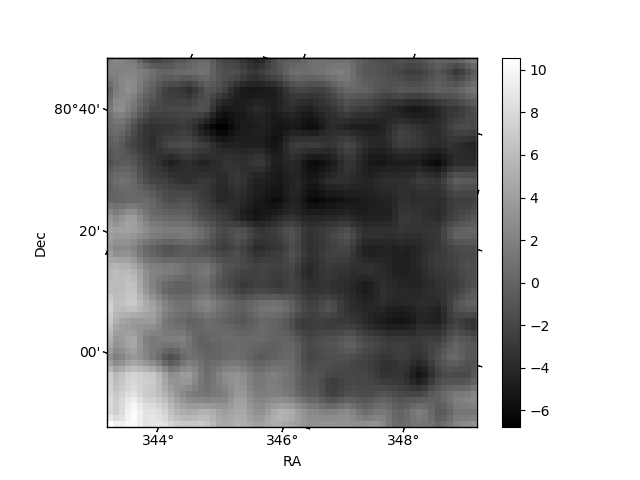
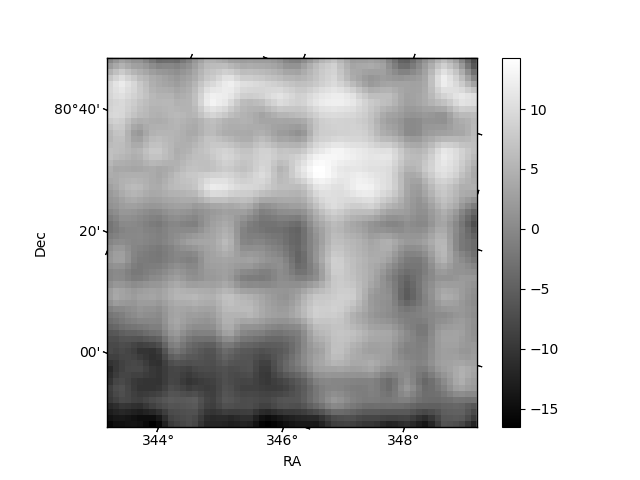
Histogram calculated using DETX and DETY for each event in the final _common_clean file
| Quadrant A | 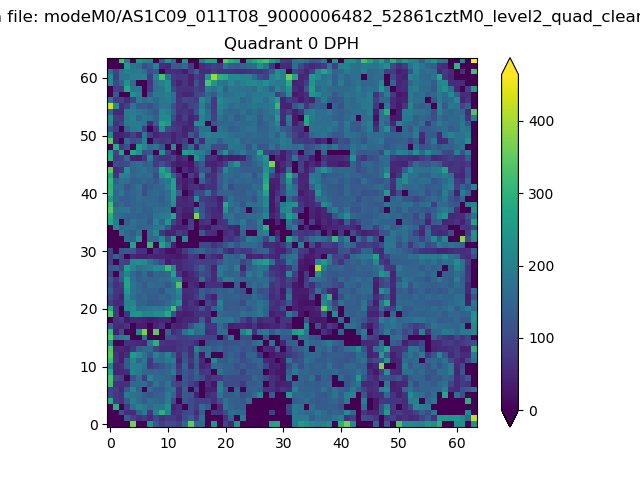 |
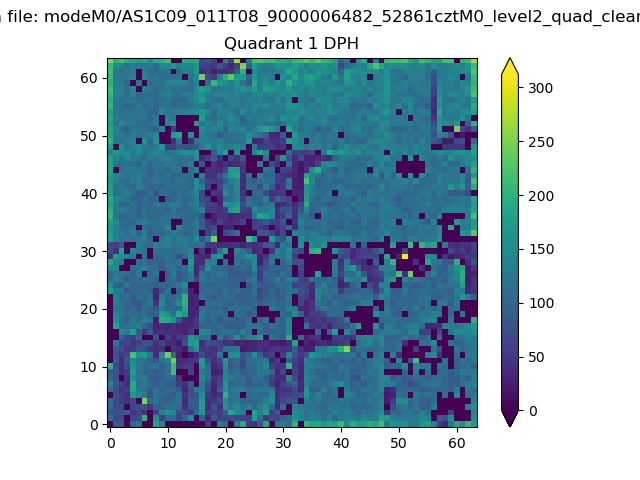 |
Quadrant B |
|---|---|---|---|
| Quadrant D | 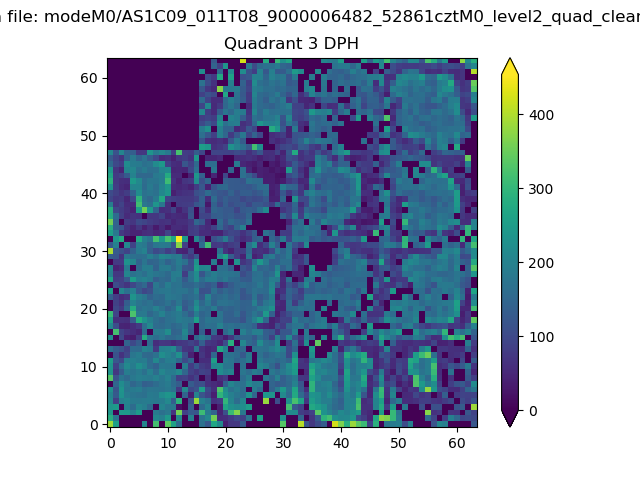 |
 |
Quadrant C |
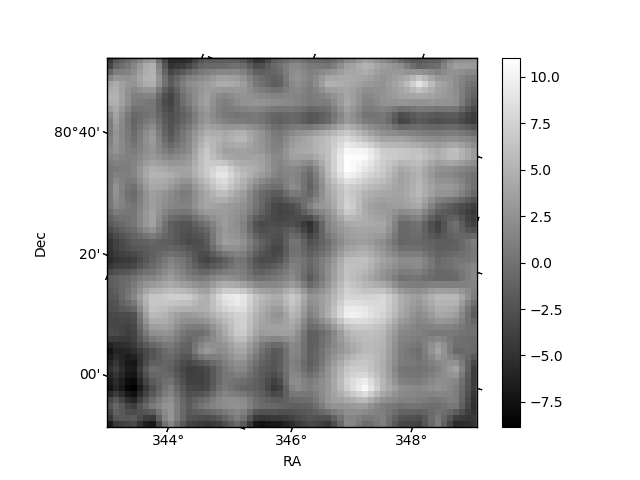
| Plot type | Count rate plots | Images |
|---|---|---|
| Comparison with Poisson distribution Blue bars denote a histogram of data divided into 1 sec bins. Red curve is a Poisson curve with rate = median count rate of data. |
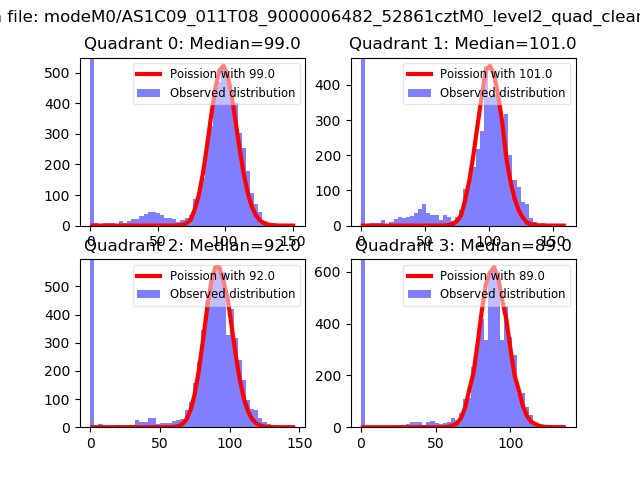 |
 |
| Quadrant-wise count rates Data is divided into 100 sec bins |
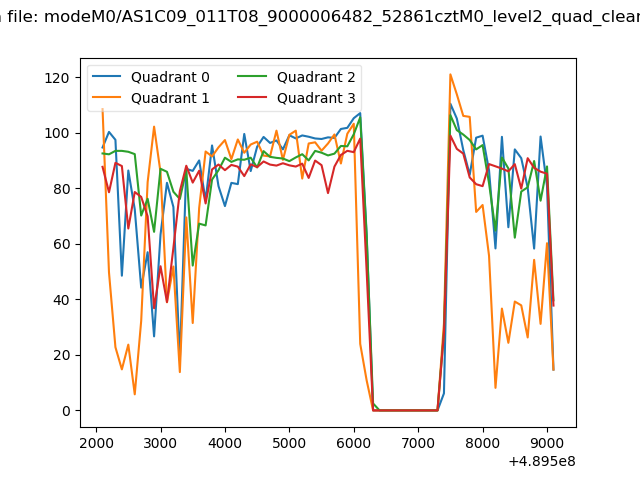 |
|
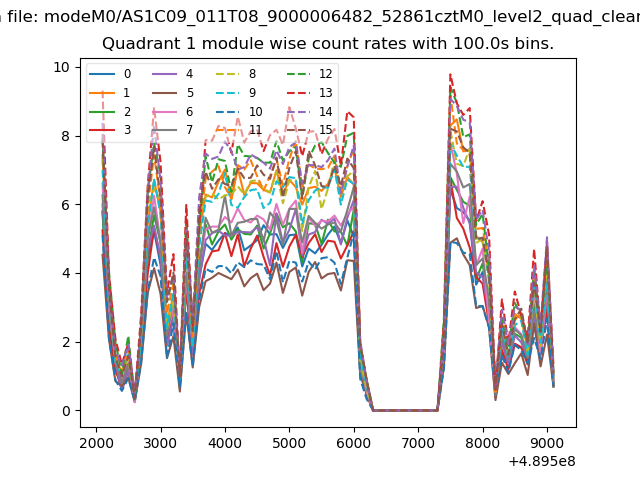
| Module-wise count rates for Quadrant A Data is divided into 100 sec bins |
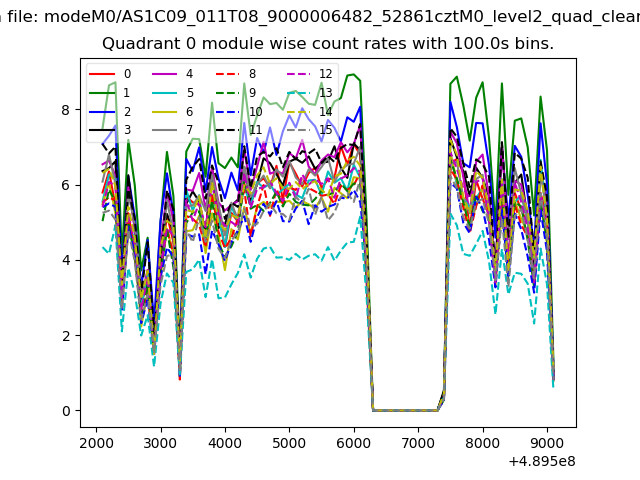 |
 |
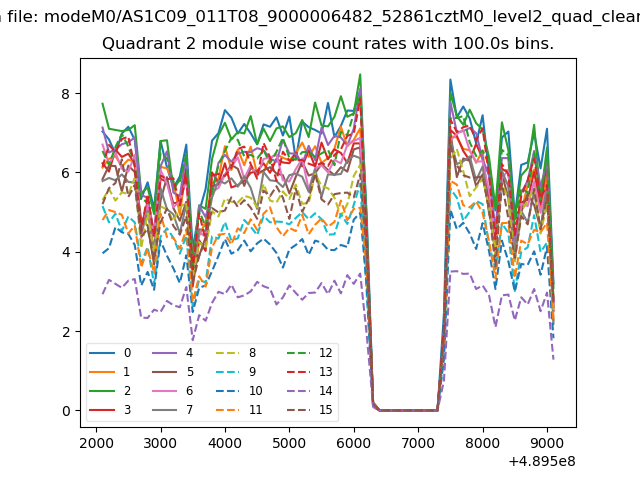
| Module-wise count rates for Quadrant B Data is divided into 100 sec bins |
 |
 |
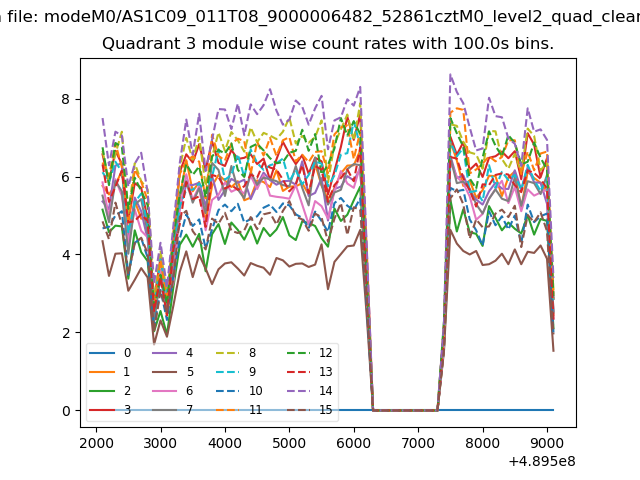
| Module-wise count rates for Quadrant C Data is divided into 100 sec bins |
 |
 |
| Module-wise count rates for Quadrant D Data is divided into 100 sec bins |
 |
 |
| Parameter | Plot |
|---|---|
| CZT HV Monitor | 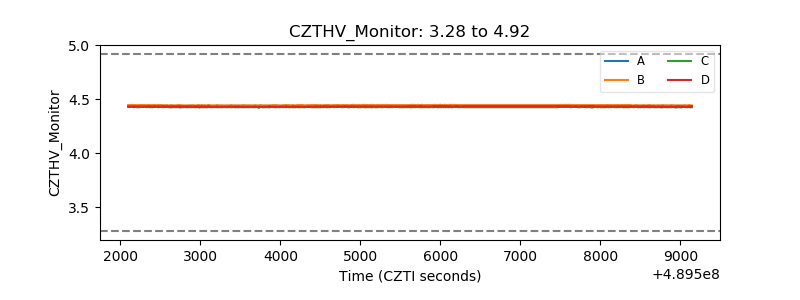 |
| D_VDD | 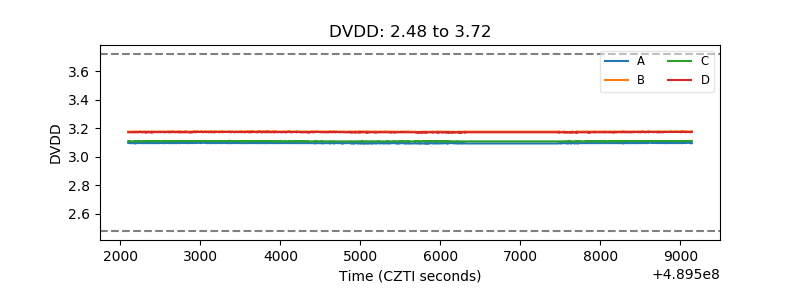 |
| Temperature 1 | 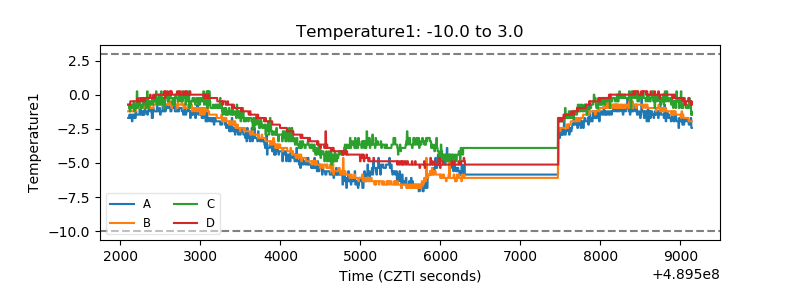 |
| Veto HV Monitor | 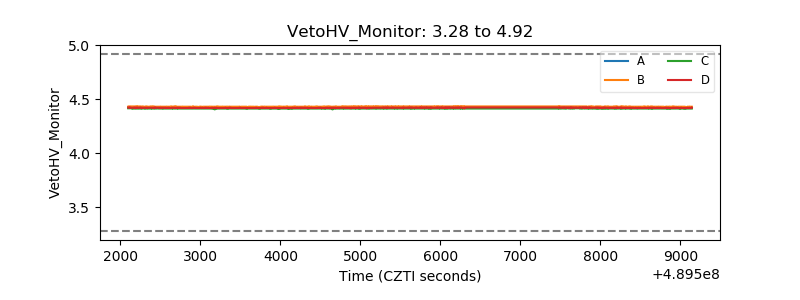 |
| Veto LLD | 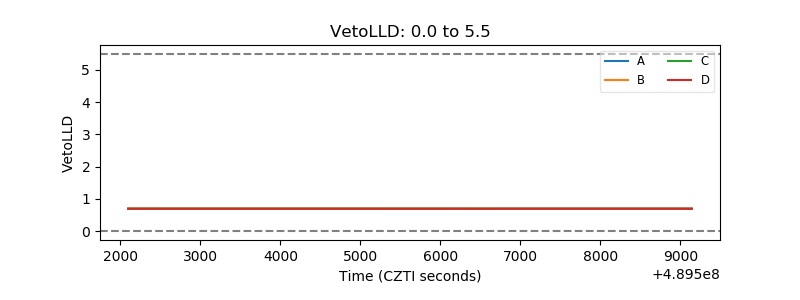 |
| Alpha Counter |  |
| _CPM_Rate | 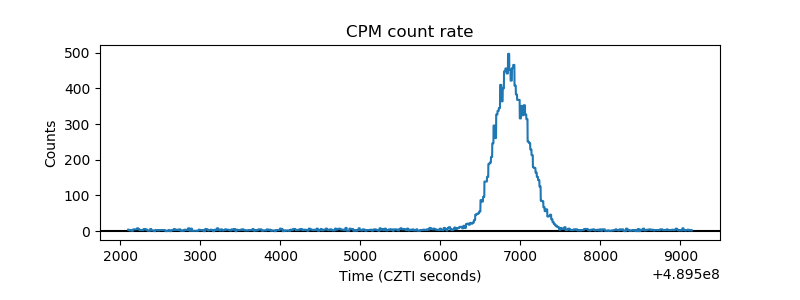 |
| CZT Counter | 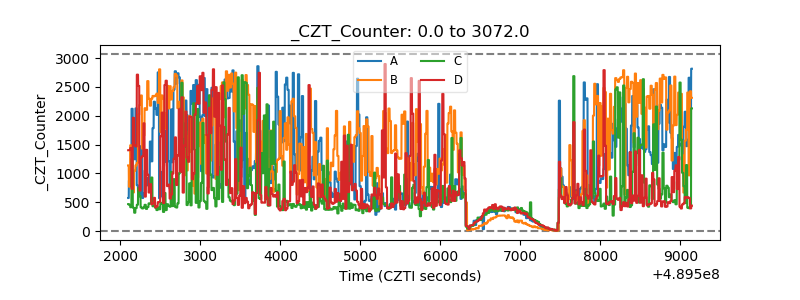 |
| +2.5 Volts monitor | 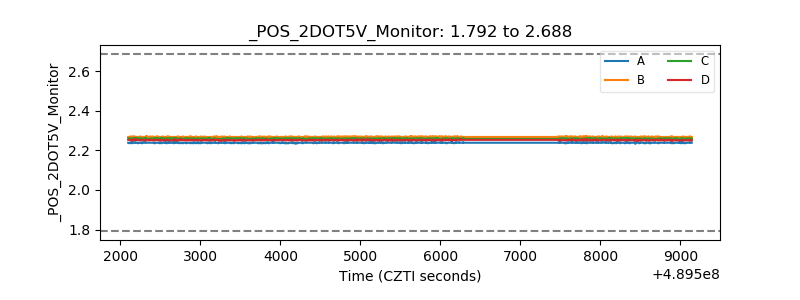 |
| +5 Volts monitor | 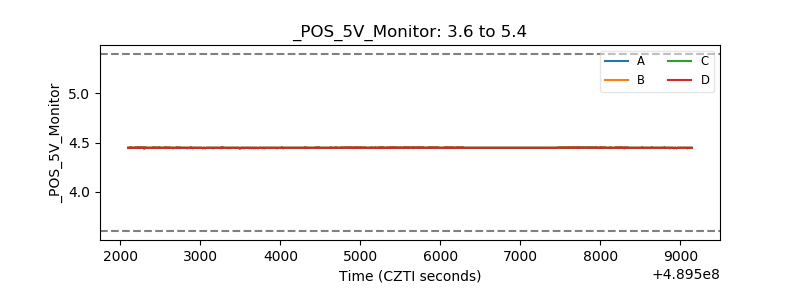 |
| _ROLL_ROT | 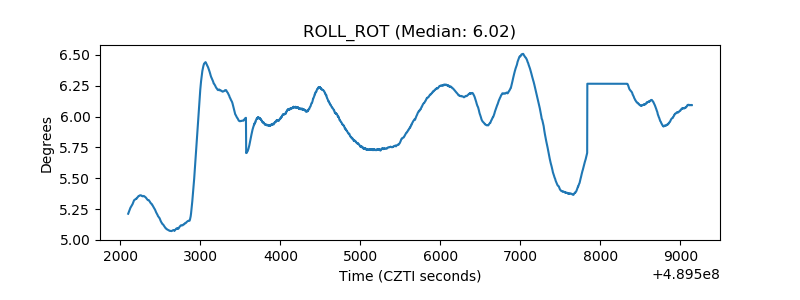 |
| _Roll_DEC | 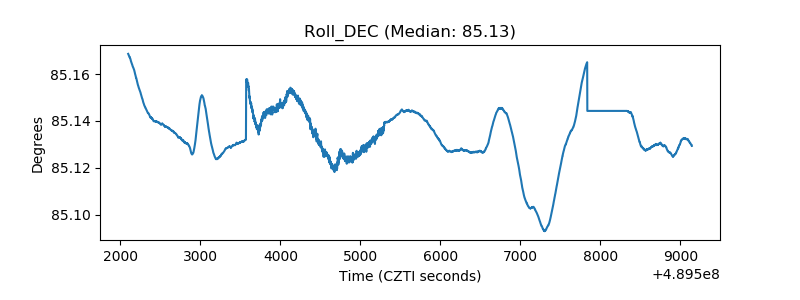 |
| _Roll_RA | 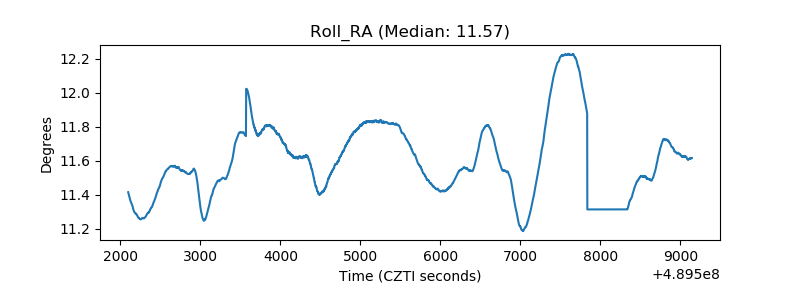 |
| Veto Counter | 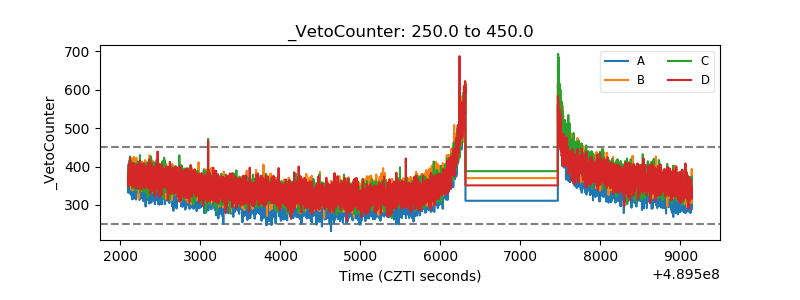 |