| Param | Original file | Final file |
|---|---|---|
| Filename | modeM0/AS1C09_011T08_9000006482_52864cztM0_level2.fits | modeM0/AS1C09_011T08_9000006482_52864cztM0_level2_quad_clean.evt |
| Size (bytes) | 914,051,520 | 81,768,960 |
| Size | 871.7 MB | 78.0 MB |
| Events in quadrant A | 5,776,692 | 646,225 |
| Events in quadrant B | 11,367,997 | 418,047 |
| Events in quadrant C | 5,381,985 | 586,702 |
| Events in quadrant D | 10,770,805 | 339,930 |
| Mode M0 | |||
|---|---|---|---|
| Quadrant | BADHDUFLAG | Total packets | Discarded packets |
| A | 0 | 22228 | 1 |
| B | 0 | 38585 | 1 |
| C | 0 | 21095 | 1 |
| D | 0 | 36833 | 1 |
| Mode M9 | |||
|---|---|---|---|
| Quadrant | BADHDUFLAG | Total packets | Discarded packets |
| A | 0 | 2 | 0 |
| B | 0 | 2 | 0 |
| C | 0 | 2 | 0 |
| D | 0 | 2 | 0 |
| Mode SS | |||
|---|---|---|---|
| Quadrant | BADHDUFLAG | Total packets | Discarded packets |
| A | 0 | 142 | 0 |
| B | 0 | 142 | 0 |
| C | 0 | 142 | 0 |
| D | 0 | 142 | 0 |
| Quadrant | Total seconds | Saturated seconds | Saturation percentage |
|---|---|---|---|
| A | 6956 | 455 | 6.541116% |
| B | 6957 | 3090 | 44.415696% |
| C | 6957 | 665 | 9.558718% |
| D | 6956 | 3353 | 48.202990% |
Noise dominated data is calculated using 1-second bins in cleaned event files. If a bin has >2000 counts, and if more than 50% of those come from <1% of pixels, then it is considered to be noise-dominated and hence unusable.
| Quadrant | # 1 sec bins | Bins with >0 counts | Bins with >2000 counts | High rate bins dominated by noise | Noise dominated (total time) | Noise dominated (detector-on time) | Marked lightcurve |
|---|---|---|---|---|---|---|---|
| A | 7131 | 6957 | 370 | 370 | 5.19% | 5.32% | 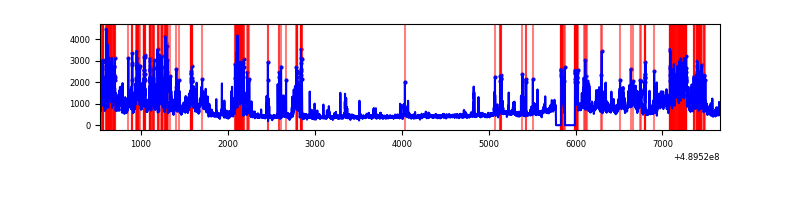 |
| B | 7132 | 6958 | 2484 | 2484 | 34.83% | 35.70% | 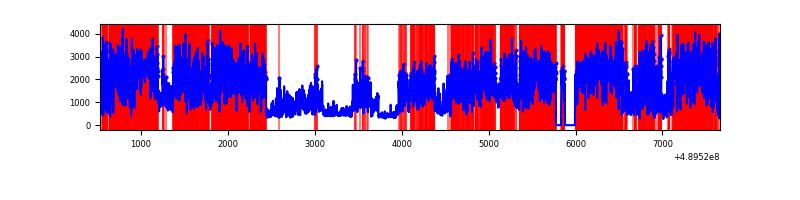 |
| C | 7132 | 6959 | 493 | 493 | 6.91% | 7.08% | 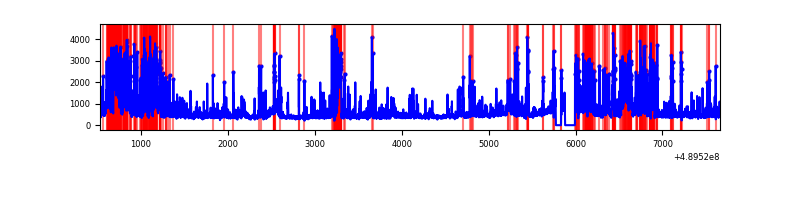 |
| D | 7131 | 6956 | 2564 | 2564 | 35.96% | 36.86% | 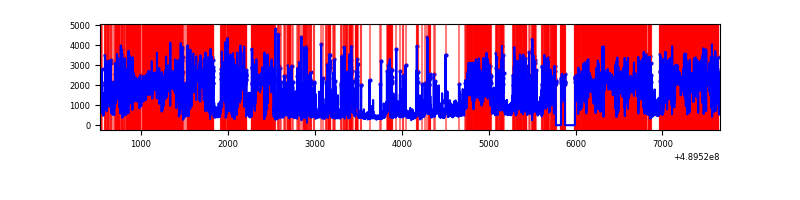 |
Top three noisy pixels from each quadrant. If the there are fewer than three noisy pixels in the level2.evt file, extra rows are filled as -1
| Pixel properties | Quadrant properties | ||||||
|---|---|---|---|---|---|---|---|
| Quadrant | DetID | PixID | Counts | Sigma | Mean | Median | Sigma |
| A | 9 | 191 | 1646871 | 9196.57 | 714 | 699 | 179.0 |
| A | 3 | 78 | 522831 | 2916.96 | 714 | 699 | 179.0 |
| A | 3 | 14 | 145968 | 811.57 | 714 | 699 | 179.0 |
| B | 8 | 3 | 7844022 | 63465.73 | 587 | 568 | 123.6 |
| B | 0 | 213 | 839642 | 6789.41 | 587 | 568 | 123.6 |
| B | 5 | 185 | 56449 | 452.16 | 587 | 568 | 123.6 |
| C | 15 | 224 | 1852539 | 9891.39 | 682 | 672 | 187.2 |
| C | 13 | 3 | 239556 | 1275.95 | 682 | 672 | 187.2 |
| C | 4 | 5 | 230768 | 1229.01 | 682 | 672 | 187.2 |
| D | 15 | 125 | 6579522 | 45112.95 | 497 | 473 | 145.8 |
| D | 8 | 176 | 828519 | 5677.96 | 497 | 473 | 145.8 |
| D | 2 | 172 | 524203 | 3591.25 | 497 | 473 | 145.8 |
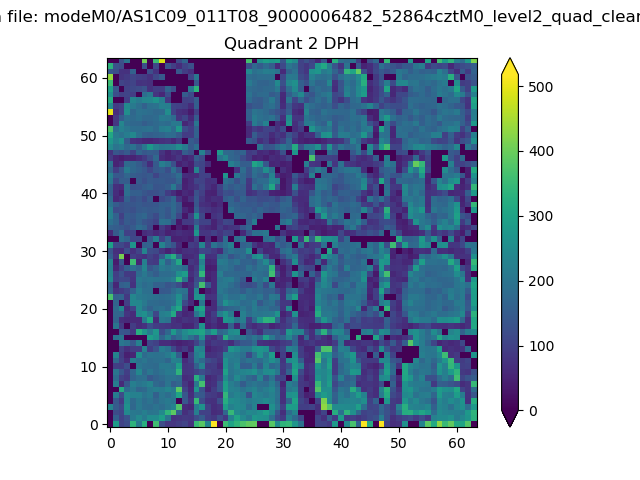
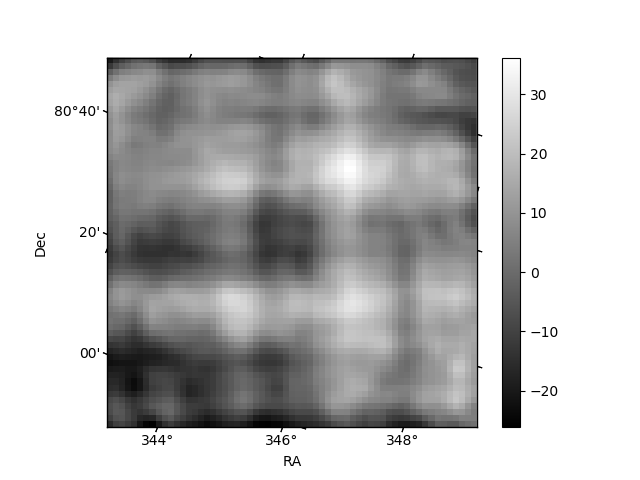
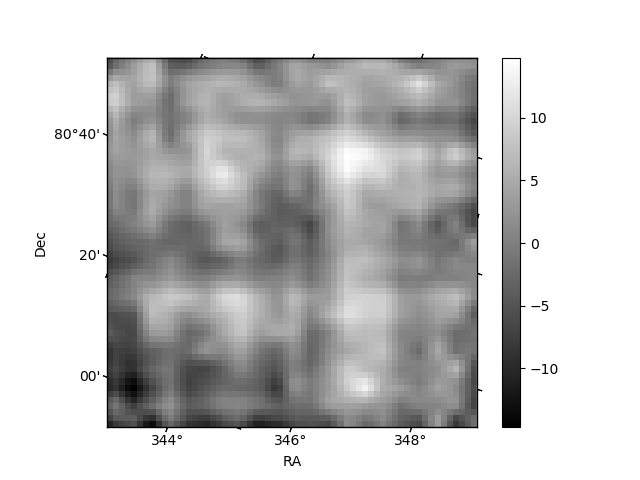
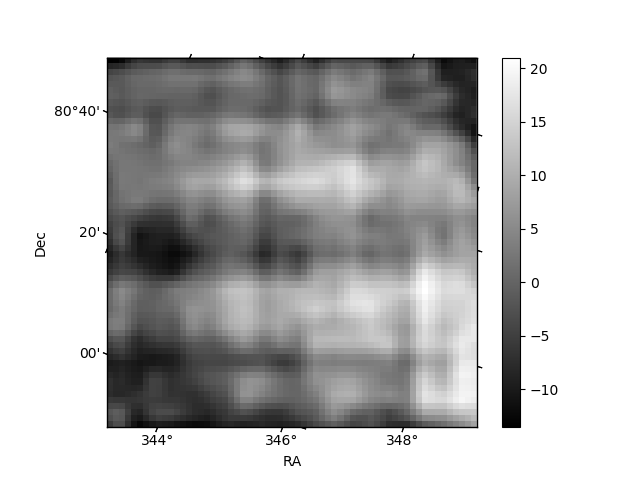
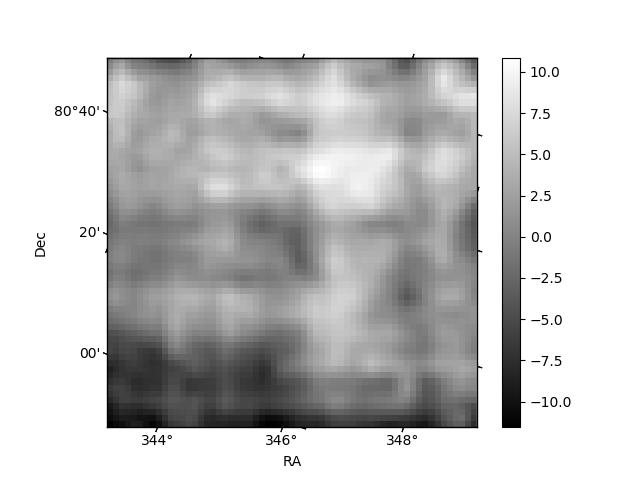
Histogram calculated using DETX and DETY for each event in the final _common_clean file
| Quadrant A | 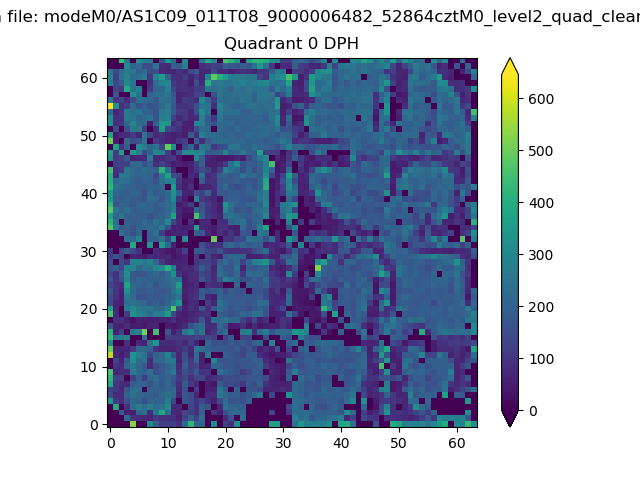 |
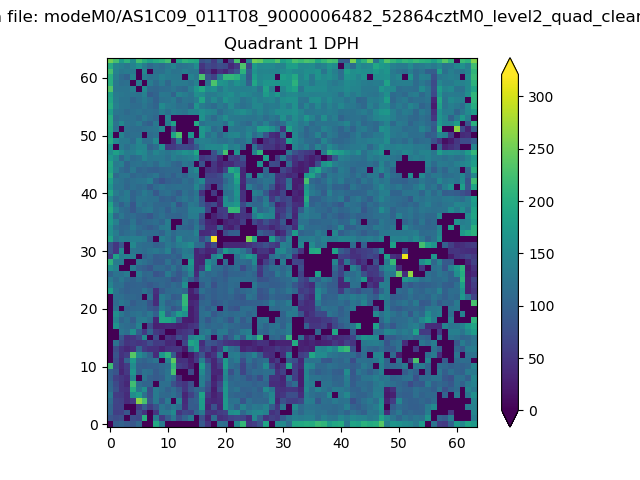 |
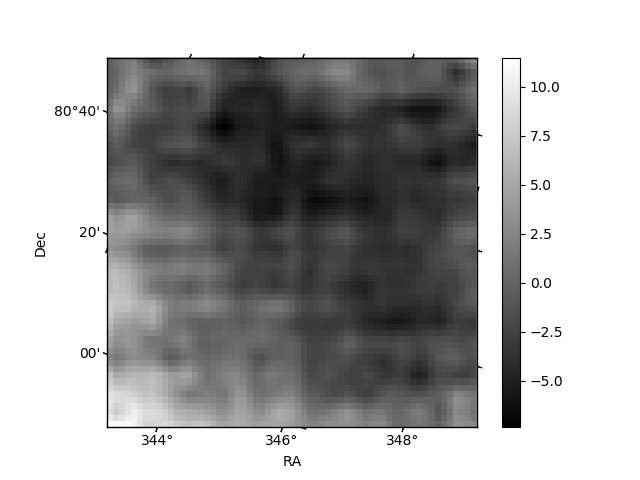
Quadrant B |
|---|---|---|---|
| Quadrant D | 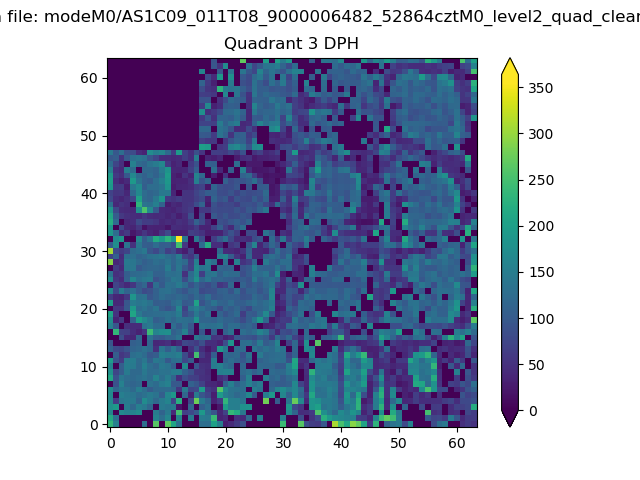 |
 |
Quadrant C |
| Plot type | Count rate plots | Images |
|---|---|---|
| Comparison with Poisson distribution Blue bars denote a histogram of data divided into 1 sec bins. Red curve is a Poisson curve with rate = median count rate of data. |
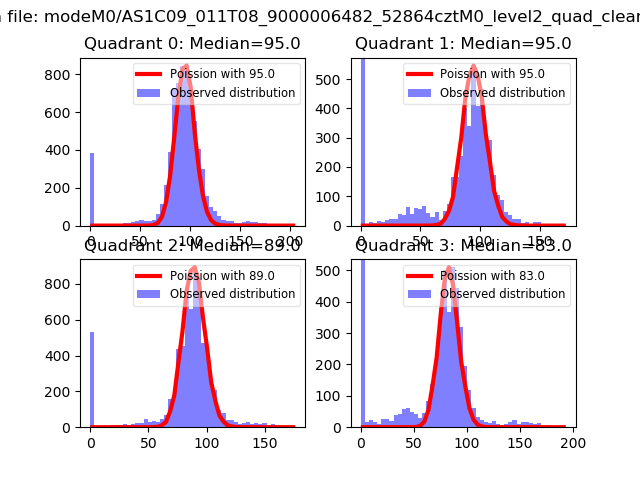 |
 |
| Quadrant-wise count rates Data is divided into 100 sec bins |
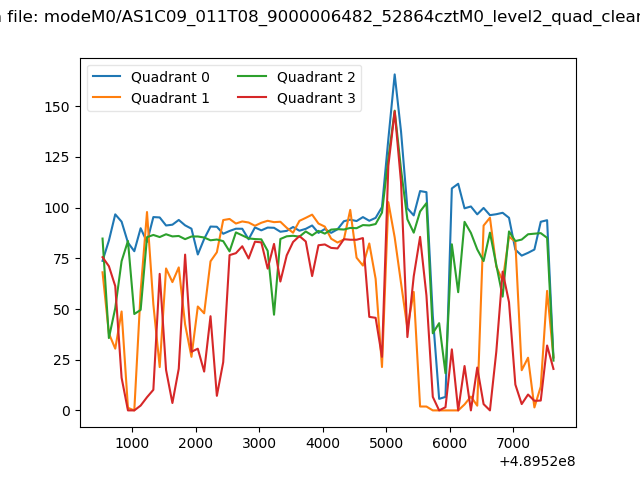 |
|
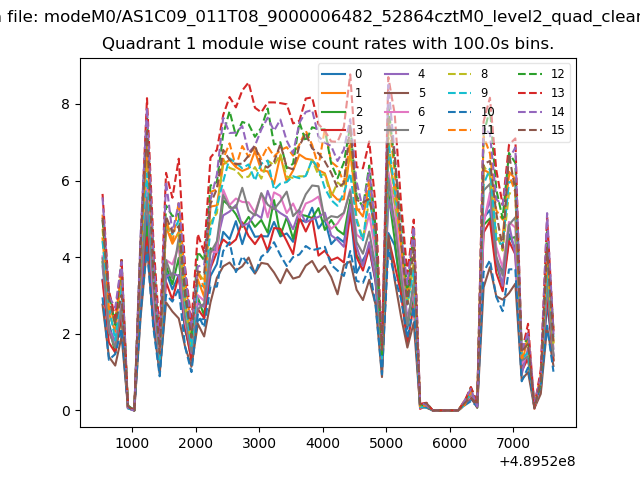
| Module-wise count rates for Quadrant A Data is divided into 100 sec bins |
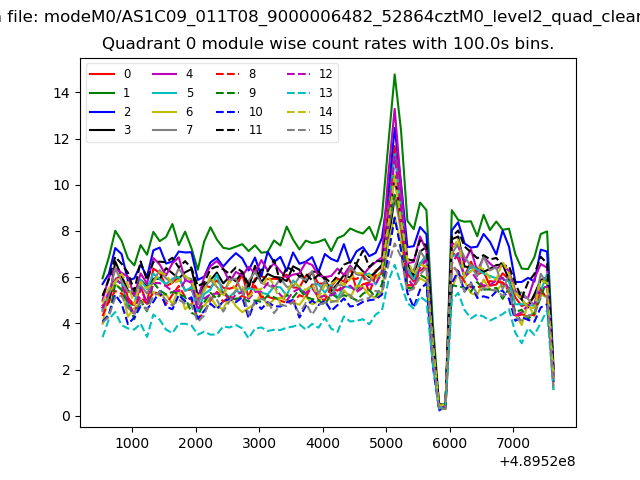 |
 |
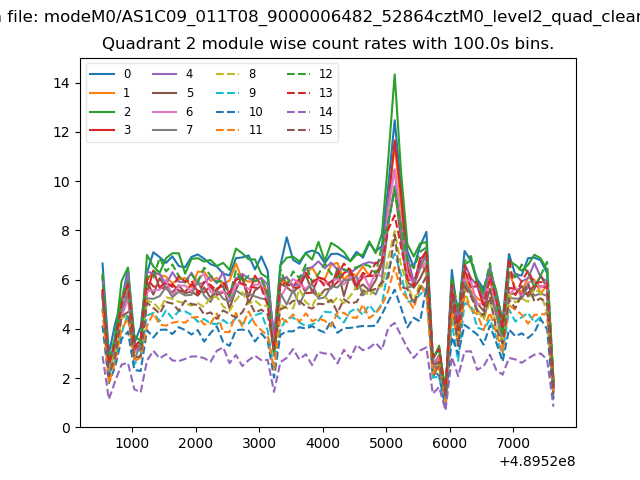
| Module-wise count rates for Quadrant B Data is divided into 100 sec bins |
 |
 |
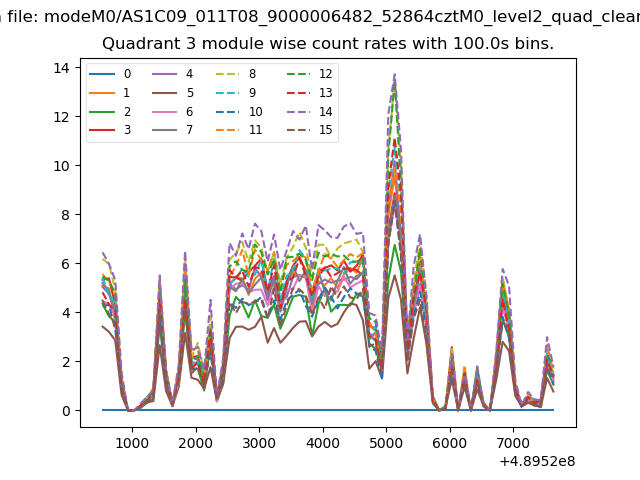
| Module-wise count rates for Quadrant C Data is divided into 100 sec bins |
 |
 |
| Module-wise count rates for Quadrant D Data is divided into 100 sec bins |
 |
 |
| Parameter | Plot |
|---|---|
| CZT HV Monitor | 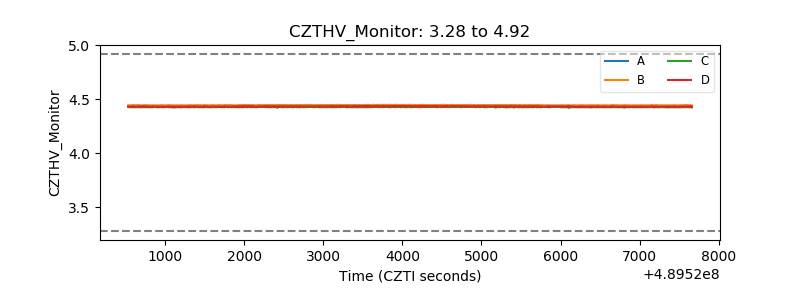 |
| D_VDD | 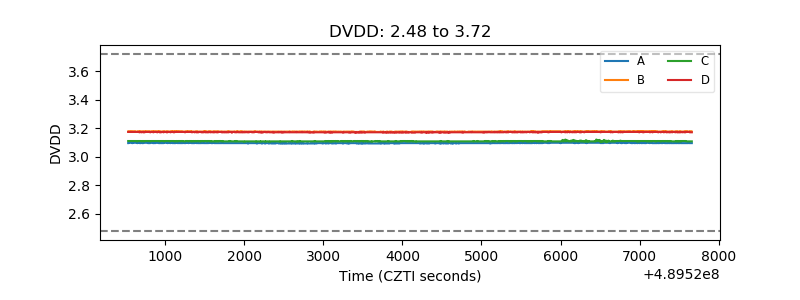 |
| Temperature 1 | 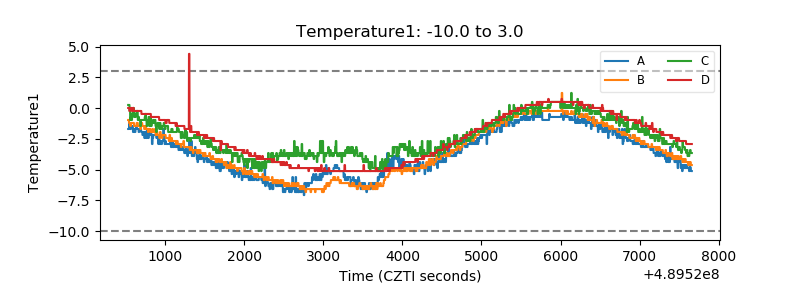 |
| Veto HV Monitor | 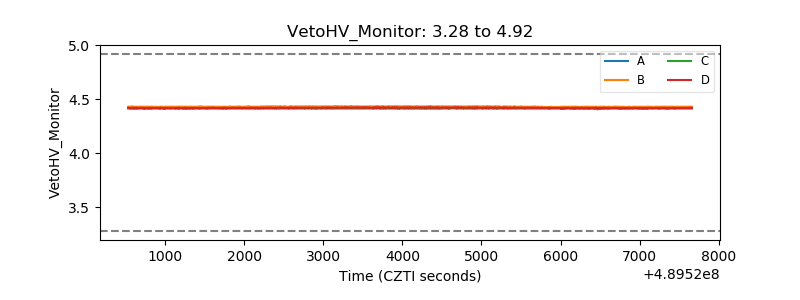 |
| Veto LLD | 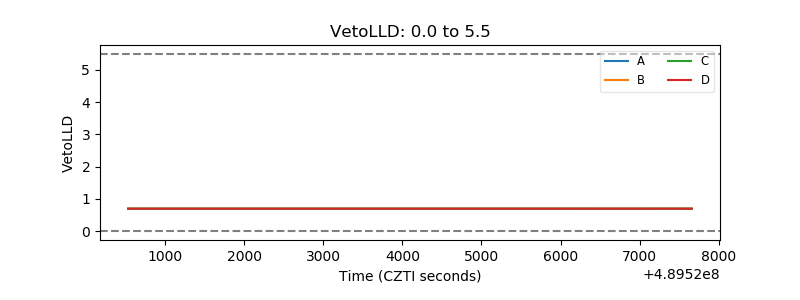 |
| Alpha Counter | 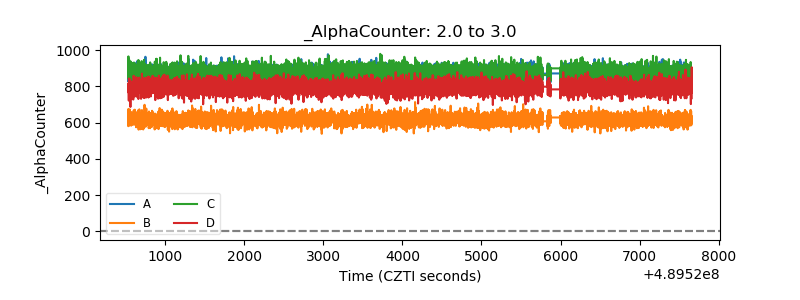 |
| _CPM_Rate | 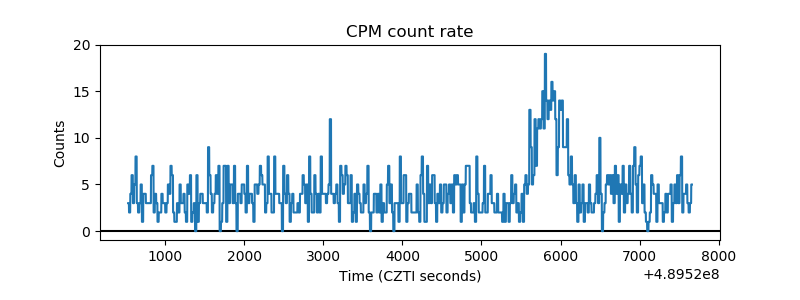 |
| CZT Counter | 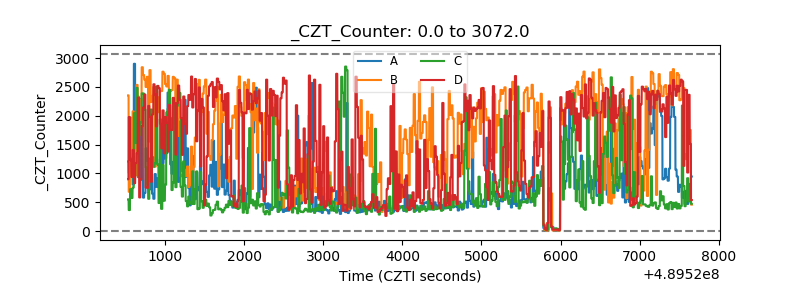 |
| +2.5 Volts monitor | 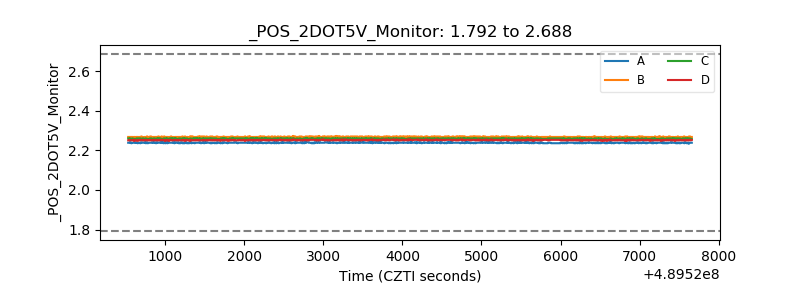 |
| +5 Volts monitor | 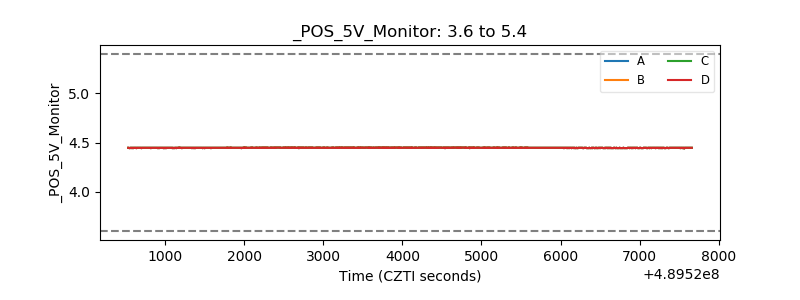 |
| _ROLL_ROT | 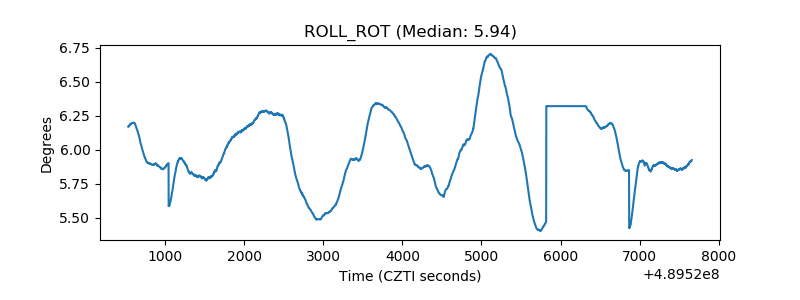 |
| _Roll_DEC | 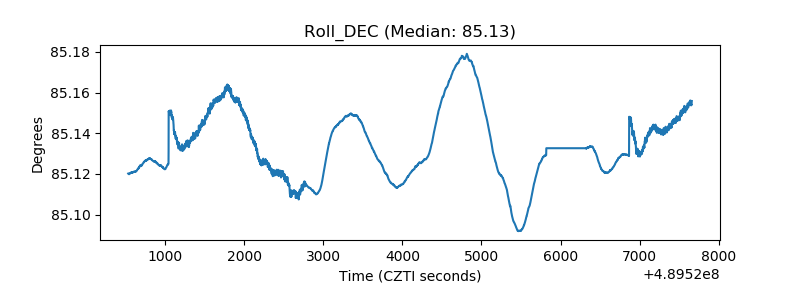 |
| _Roll_RA | 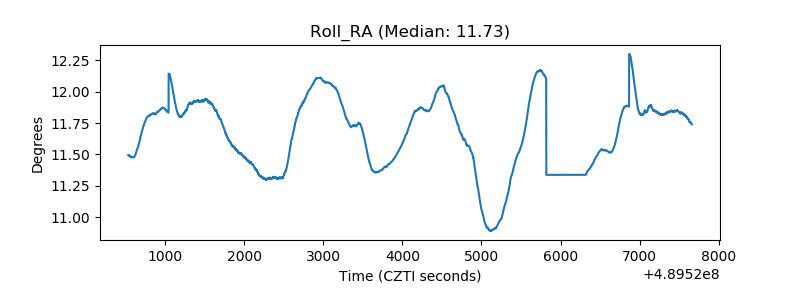 |
| Veto Counter | 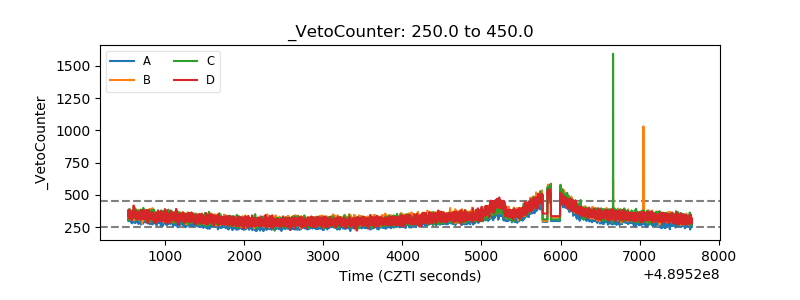 |