| Param | Original file | Final file |
|---|---|---|
| Filename | modeM0/AS1C09_011T08_9000006482_52865cztM0_level2.fits | modeM0/AS1C09_011T08_9000006482_52865cztM0_level2_quad_clean.evt |
| Size (bytes) | 861,148,800 | 95,973,120 |
| Size | 821.3 MB | 91.5 MB |
| Events in quadrant A | 5,681,369 | 713,612 |
| Events in quadrant B | 10,656,727 | 538,232 |
| Events in quadrant C | 4,941,361 | 653,044 |
| Events in quadrant D | 10,007,048 | 469,755 |
| Mode M0 | |||
|---|---|---|---|
| Quadrant | BADHDUFLAG | Total packets | Discarded packets |
| A | 0 | 22380 | 0 |
| B | 0 | 36994 | 0 |
| C | 0 | 20448 | 0 |
| D | 0 | 34998 | 0 |
| Mode SS | |||
|---|---|---|---|
| Quadrant | BADHDUFLAG | Total packets | Discarded packets |
| A | 0 | 152 | 0 |
| B | 0 | 152 | 0 |
| C | 0 | 152 | 0 |
| D | 0 | 152 | 0 |
| Quadrant | Total seconds | Saturated seconds | Saturation percentage |
|---|---|---|---|
| A | 7634 | 304 | 3.982185% |
| B | 7634 | 2525 | 33.075714% |
| C | 7634 | 460 | 6.025675% |
| D | 7634 | 2402 | 31.464501% |
Noise dominated data is calculated using 1-second bins in cleaned event files. If a bin has >2000 counts, and if more than 50% of those come from <1% of pixels, then it is considered to be noise-dominated and hence unusable.
| Quadrant | # 1 sec bins | Bins with >0 counts | Bins with >2000 counts | High rate bins dominated by noise | Noise dominated (total time) | Noise dominated (detector-on time) | Marked lightcurve |
|---|---|---|---|---|---|---|---|
| A | 7634 | 7634 | 259 | 259 | 3.39% | 3.39% | 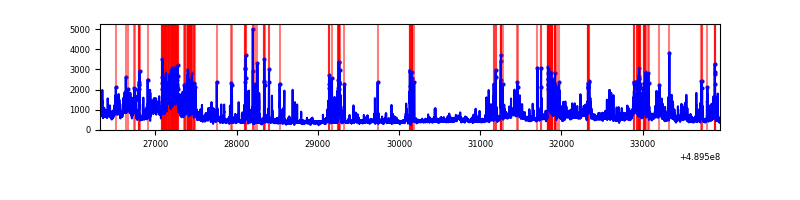 |
| B | 7634 | 7634 | 1897 | 1897 | 24.85% | 24.85% | 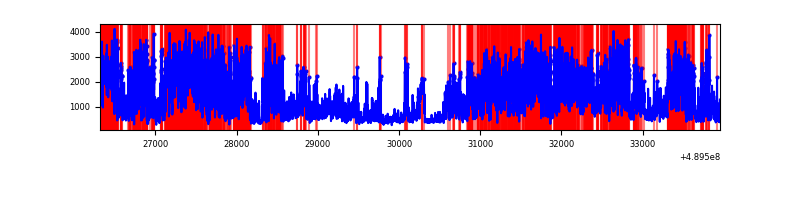 |
| C | 7634 | 7634 | 352 | 352 | 4.61% | 4.61% | 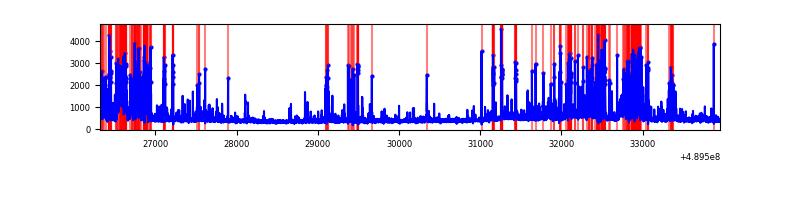 |
| D | 7634 | 7634 | 1997 | 1997 | 26.16% | 26.16% | 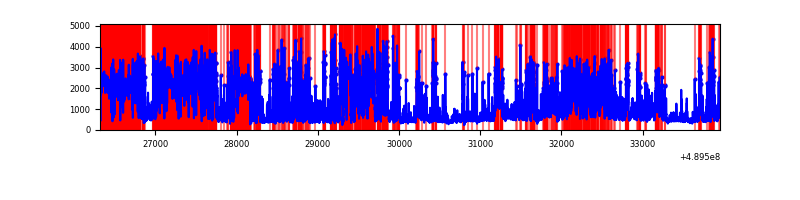 |
Top three noisy pixels from each quadrant. If the there are fewer than three noisy pixels in the level2.evt file, extra rows are filled as -1
| Pixel properties | Quadrant properties | ||||||
|---|---|---|---|---|---|---|---|
| Quadrant | DetID | PixID | Counts | Sigma | Mean | Median | Sigma |
| A | 9 | 191 | 1041063 | 5141.74 | 794 | 772 | 202.3 |
| A | 4 | 238 | 405154 | 1998.7 | 794 | 772 | 202.3 |
| A | 5 | 243 | 240750 | 1186.12 | 794 | 772 | 202.3 |
| B | 8 | 3 | 6892746 | 46547.72 | 691 | 666 | 148.1 |
| B | 0 | 213 | 309547 | 2086.12 | 691 | 666 | 148.1 |
| B | 10 | 254 | 179188 | 1205.7 | 691 | 666 | 148.1 |
| C | 15 | 224 | 1095650 | 5223.61 | 759 | 753 | 209.6 |
| C | 2 | 12 | 277662 | 1321.1 | 759 | 753 | 209.6 |
| C | 7 | 80 | 213113 | 1013.14 | 759 | 753 | 209.6 |
| D | 15 | 125 | 3553353 | 19094.78 | 643 | 614 | 186.1 |
| D | 8 | 176 | 1597055 | 8580.33 | 643 | 614 | 186.1 |
| D | 2 | 37 | 735813 | 3951.45 | 643 | 614 | 186.1 |
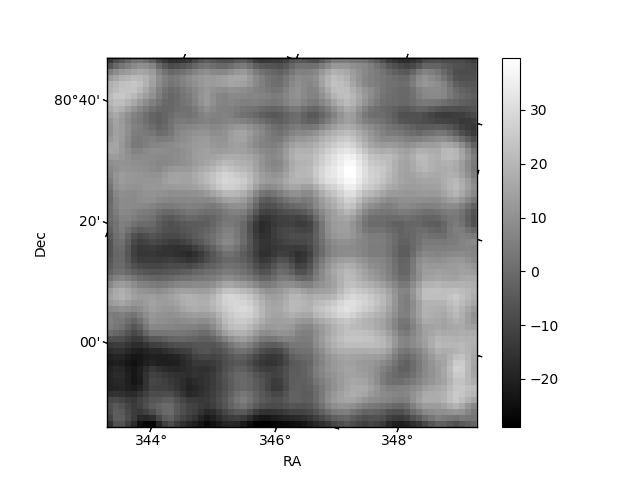
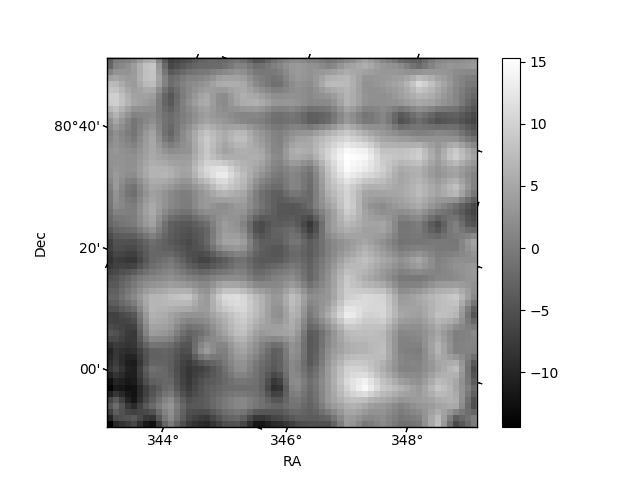
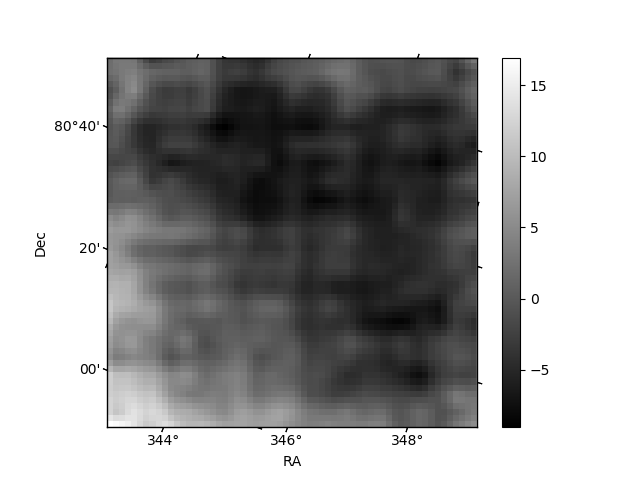
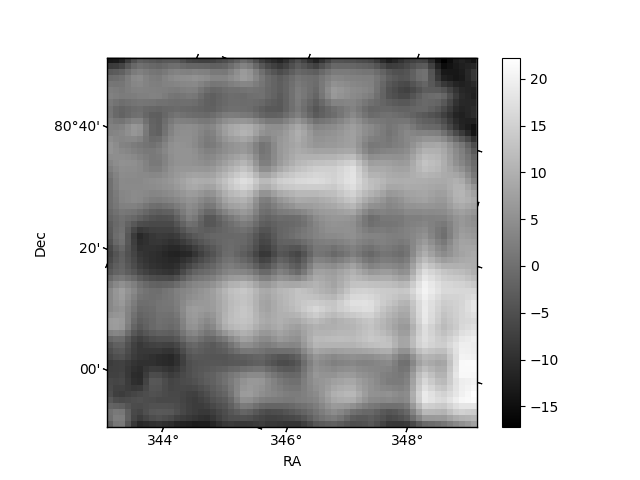
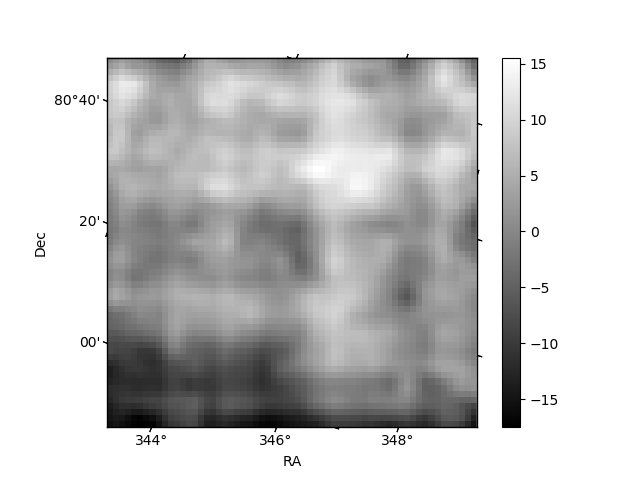
Histogram calculated using DETX and DETY for each event in the final _common_clean file
| Quadrant A | 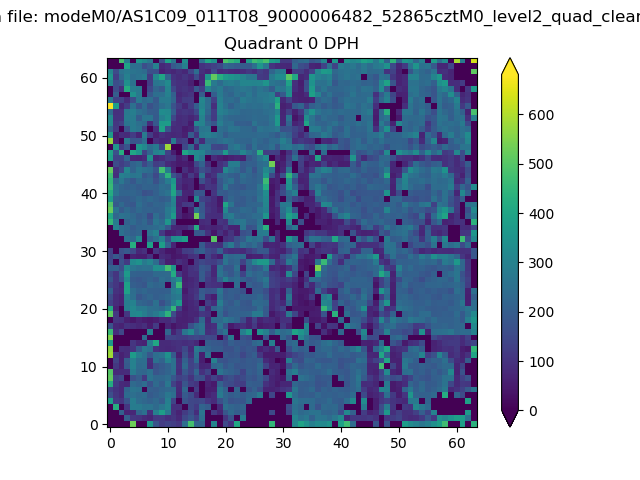 |
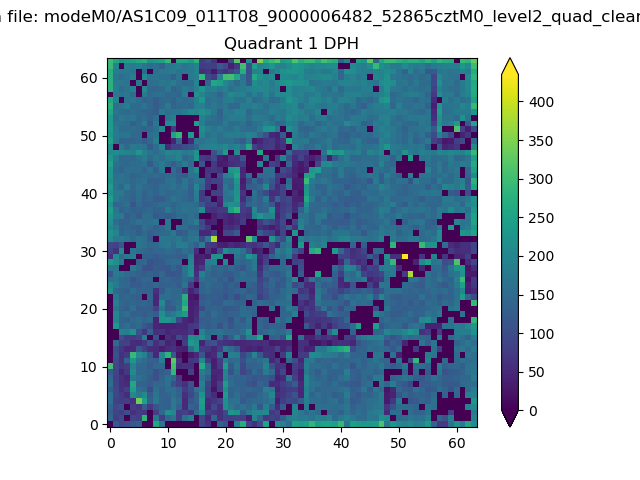 |
Quadrant B |
|---|---|---|---|
| Quadrant D | 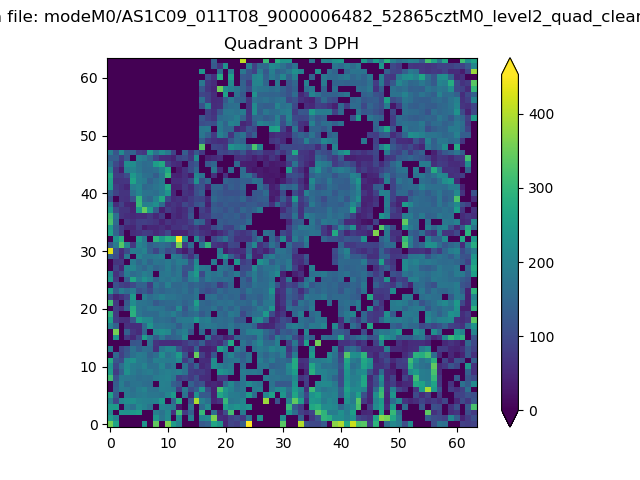 |
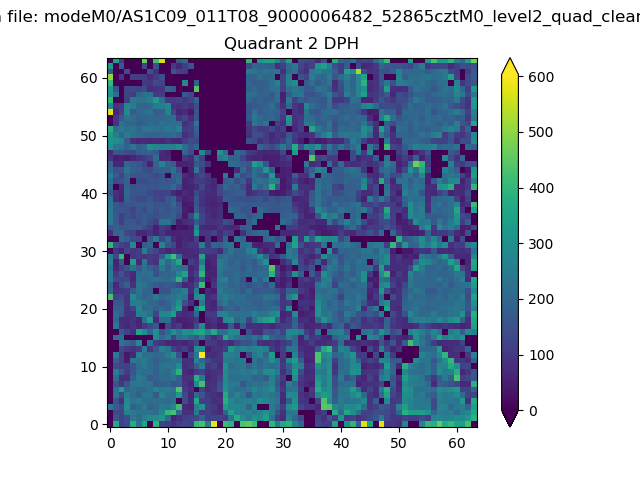 |
Quadrant C |
| Plot type | Count rate plots | Images |
|---|---|---|
| Comparison with Poisson distribution Blue bars denote a histogram of data divided into 1 sec bins. Red curve is a Poisson curve with rate = median count rate of data. |
 |
 |
| Quadrant-wise count rates Data is divided into 100 sec bins |
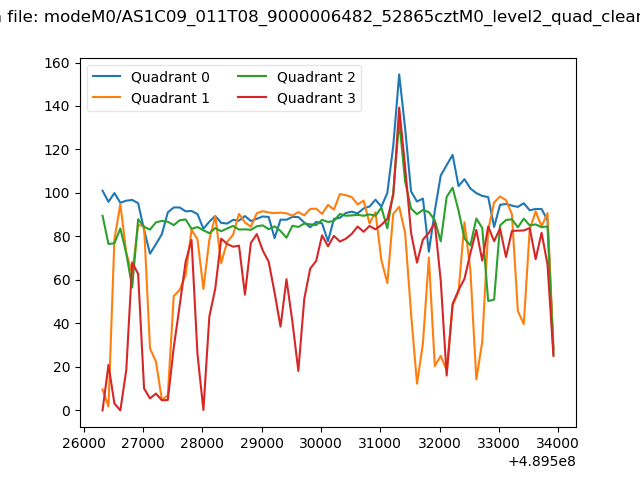 |
|
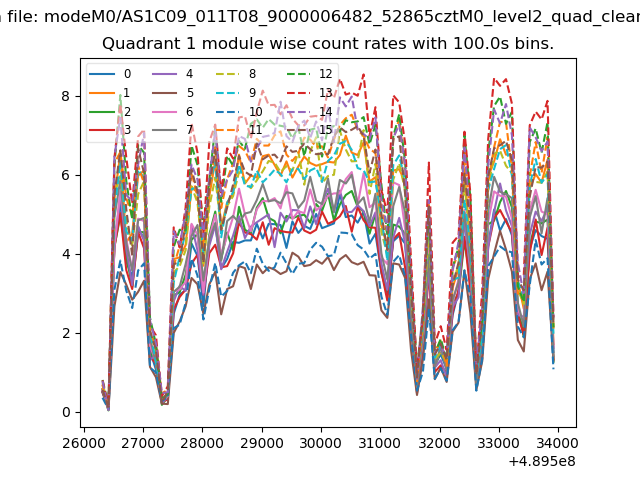
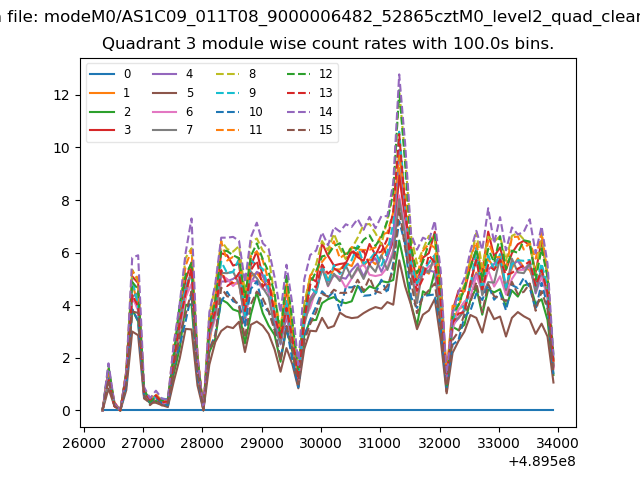
| Module-wise count rates for Quadrant A Data is divided into 100 sec bins |
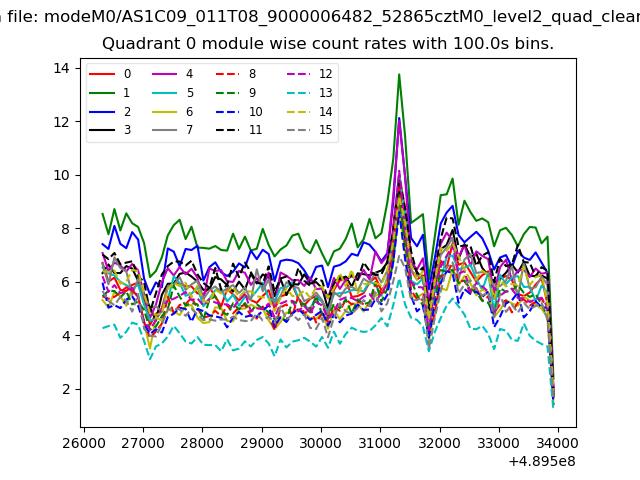 |
 |
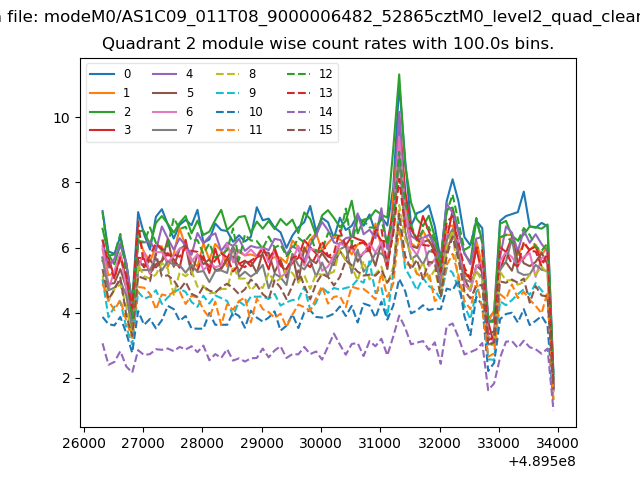
| Module-wise count rates for Quadrant B Data is divided into 100 sec bins |
 |
 |
| Module-wise count rates for Quadrant C Data is divided into 100 sec bins |
 |
 |
| Module-wise count rates for Quadrant D Data is divided into 100 sec bins |
 |
 |
| Parameter | Plot |
|---|---|
| CZT HV Monitor | 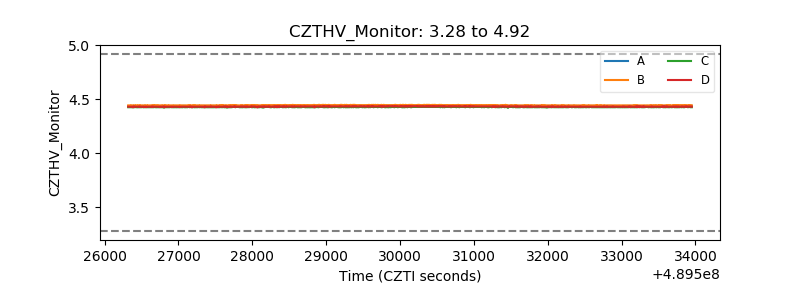 |
| D_VDD | 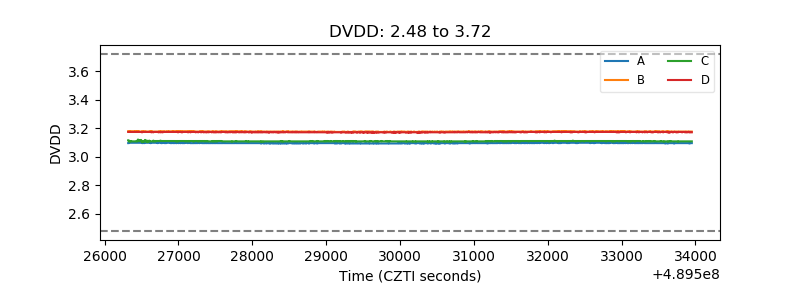 |
| Temperature 1 | 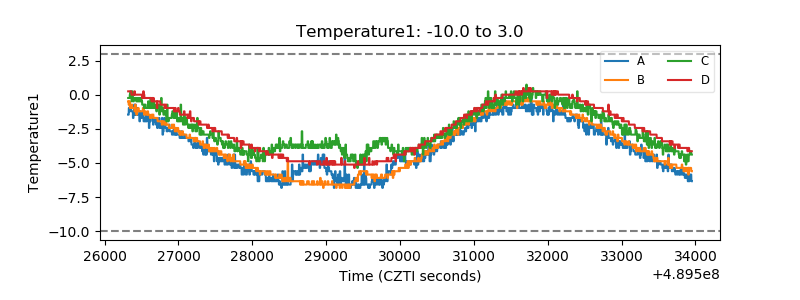 |
| Veto HV Monitor | 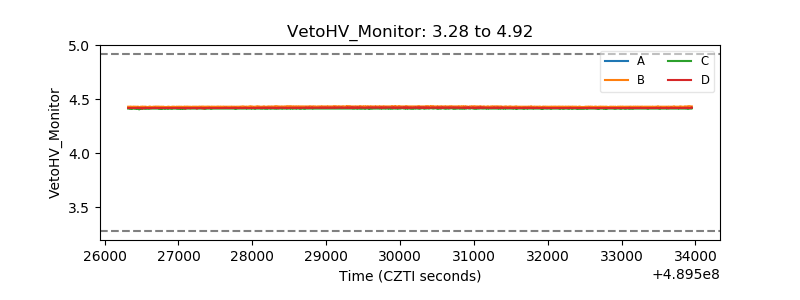 |
| Veto LLD | 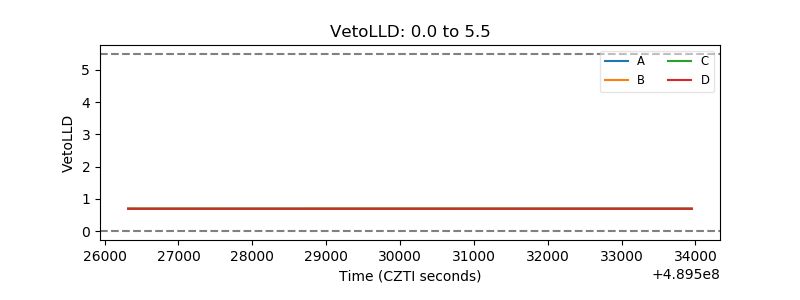 |
| Alpha Counter | 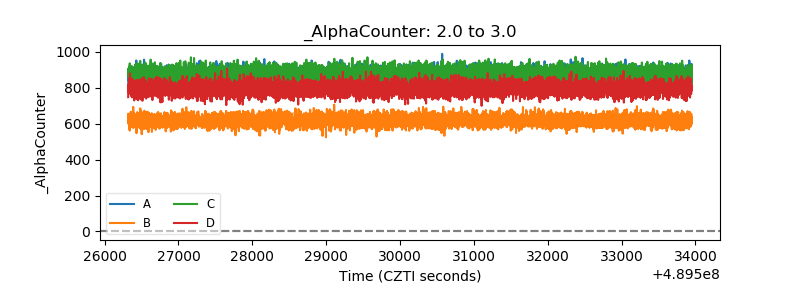 |
| _CPM_Rate | 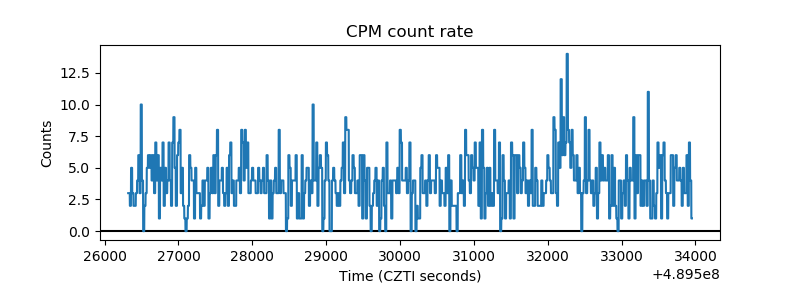 |
| CZT Counter | 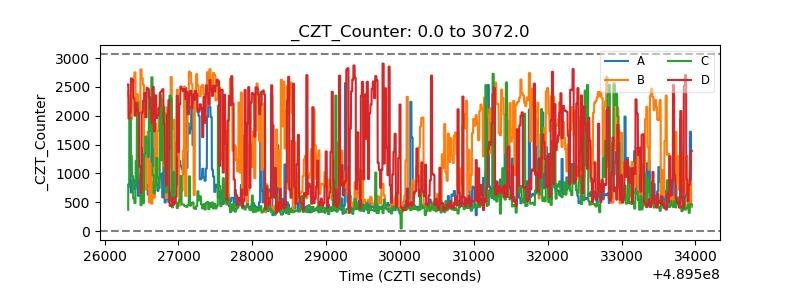 |
| +2.5 Volts monitor |  |
| +5 Volts monitor |  |
| _ROLL_ROT | 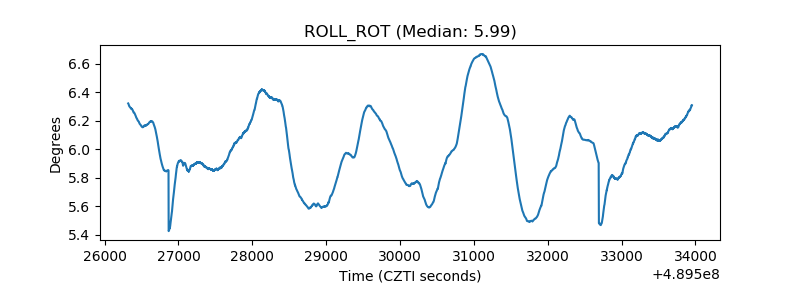 |
| _Roll_DEC | 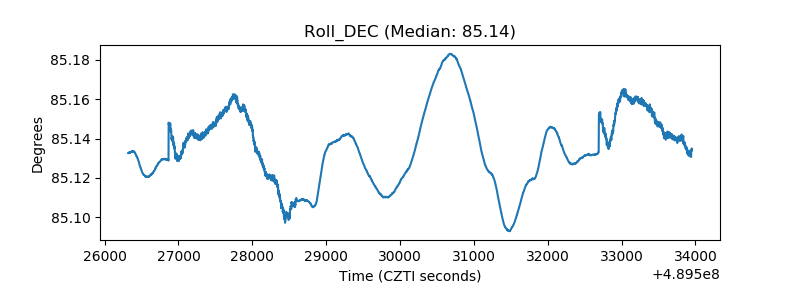 |
| _Roll_RA | 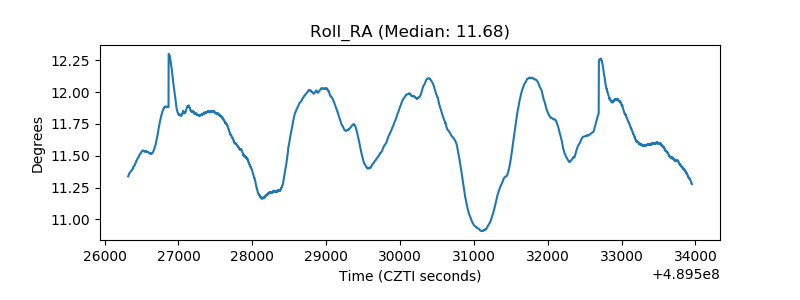 |
| Veto Counter | 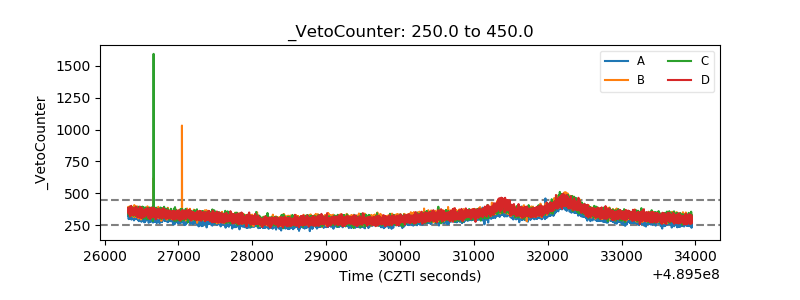 |