| Param | Original file | Final file |
|---|---|---|
| Filename | modeM0/AS1C09_011T08_9000006482_52866cztM0_level2.fits | modeM0/AS1C09_011T08_9000006482_52866cztM0_level2_quad_clean.evt |
| Size (bytes) | 747,984,960 | 109,604,160 |
| Size | 713.3 MB | 104.5 MB |
| Events in quadrant A | 6,332,935 | 749,552 |
| Events in quadrant B | 6,703,023 | 739,848 |
| Events in quadrant C | 6,006,245 | 673,999 |
| Events in quadrant D | 8,022,603 | 594,944 |
| Mode M0 | |||
|---|---|---|---|
| Quadrant | BADHDUFLAG | Total packets | Discarded packets |
| A | 0 | 24432 | 0 |
| B | 0 | 25632 | 0 |
| C | 0 | 23699 | 0 |
| D | 0 | 29531 | 0 |
| Mode SS | |||
|---|---|---|---|
| Quadrant | BADHDUFLAG | Total packets | Discarded packets |
| A | 0 | 162 | 0 |
| B | 0 | 162 | 0 |
| C | 0 | 162 | 0 |
| D | 0 | 162 | 0 |
| Quadrant | Total seconds | Saturated seconds | Saturation percentage |
|---|---|---|---|
| A | 8050 | 427 | 5.304348% |
| B | 8050 | 859 | 10.670807% |
| C | 8051 | 710 | 8.818780% |
| D | 8051 | 1375 | 17.078624% |
Noise dominated data is calculated using 1-second bins in cleaned event files. If a bin has >2000 counts, and if more than 50% of those come from <1% of pixels, then it is considered to be noise-dominated and hence unusable.
| Quadrant | # 1 sec bins | Bins with >0 counts | Bins with >2000 counts | High rate bins dominated by noise | Noise dominated (total time) | Noise dominated (detector-on time) | Marked lightcurve |
|---|---|---|---|---|---|---|---|
| A | 8050 | 8050 | 305 | 305 | 3.79% | 3.79% | 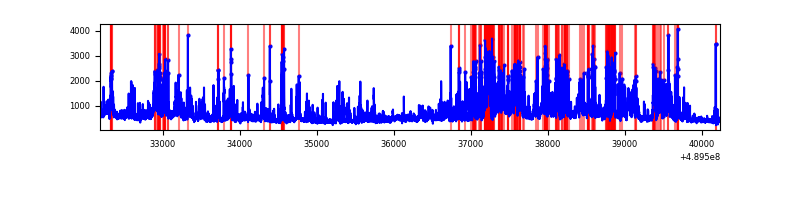 |
| B | 8050 | 8050 | 493 | 493 | 6.12% | 6.12% | 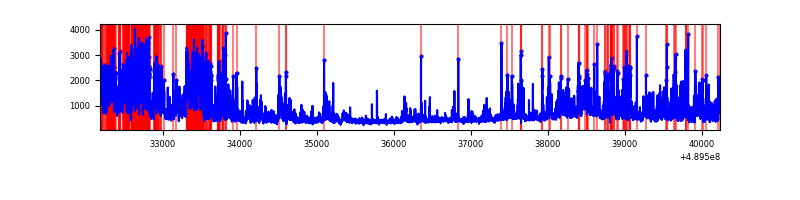 |
| C | 8051 | 8051 | 508 | 508 | 6.31% | 6.31% | 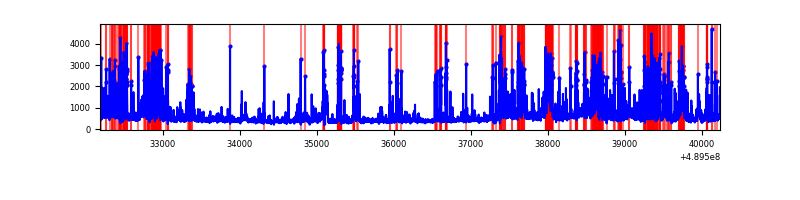 |
| D | 8051 | 8051 | 1098 | 1098 | 13.64% | 13.64% | 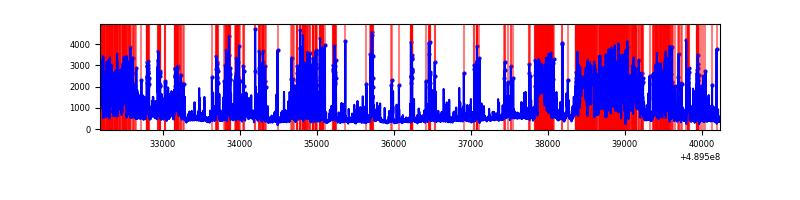 |
Top three noisy pixels from each quadrant. If the there are fewer than three noisy pixels in the level2.evt file, extra rows are filled as -1
| Pixel properties | Quadrant properties | ||||||
|---|---|---|---|---|---|---|---|
| Quadrant | DetID | PixID | Counts | Sigma | Mean | Median | Sigma |
| A | 9 | 191 | 1335320 | 6264.68 | 844 | 824 | 213.0 |
| A | 4 | 238 | 371160 | 1738.51 | 844 | 824 | 213.0 |
| A | 0 | 8 | 289978 | 1357.41 | 844 | 824 | 213.0 |
| B | 8 | 3 | 2474146 | 14100.15 | 822 | 791 | 175.4 |
| B | 0 | 213 | 359447 | 2044.63 | 822 | 791 | 175.4 |
| B | 4 | 81 | 148751 | 843.49 | 822 | 791 | 175.4 |
| C | 15 | 224 | 898295 | 4018.95 | 805 | 793 | 223.3 |
| C | 2 | 12 | 842553 | 3769.34 | 805 | 793 | 223.3 |
| C | 13 | 3 | 370164 | 1654.02 | 805 | 793 | 223.3 |
| D | 8 | 176 | 2048514 | 9262.47 | 768 | 735 | 221.1 |
| D | 15 | 125 | 1766251 | 7985.74 | 768 | 735 | 221.1 |
| D | 12 | 17 | 233731 | 1053.88 | 768 | 735 | 221.1 |
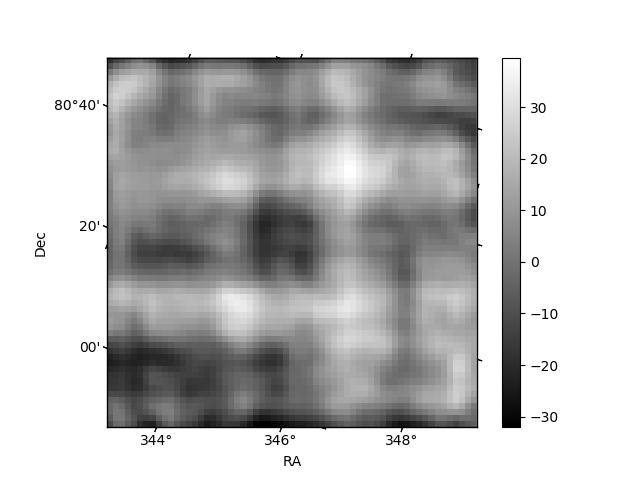
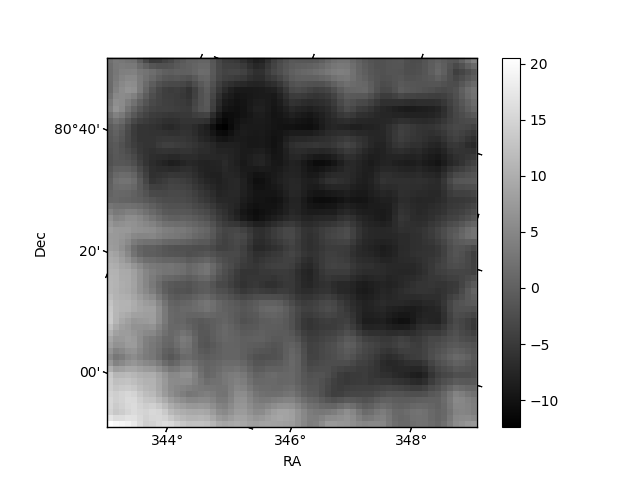
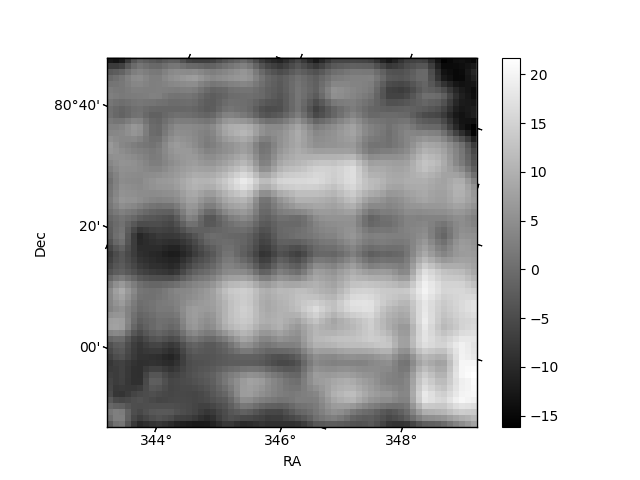
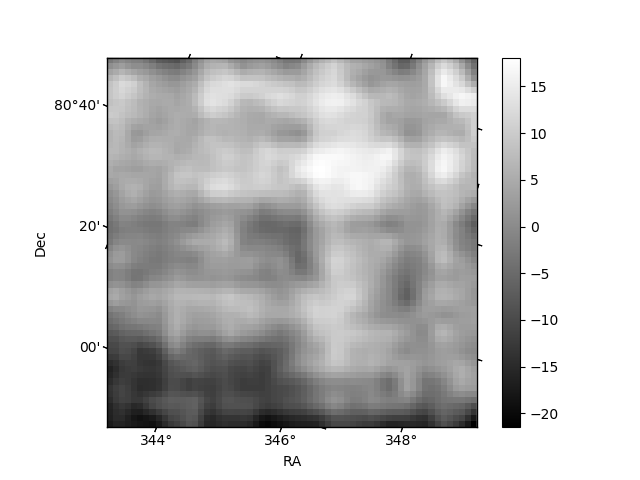
Histogram calculated using DETX and DETY for each event in the final _common_clean file
| Quadrant A | 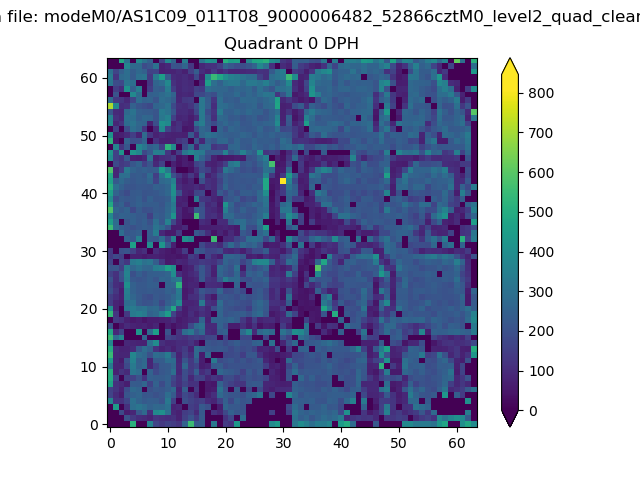 |
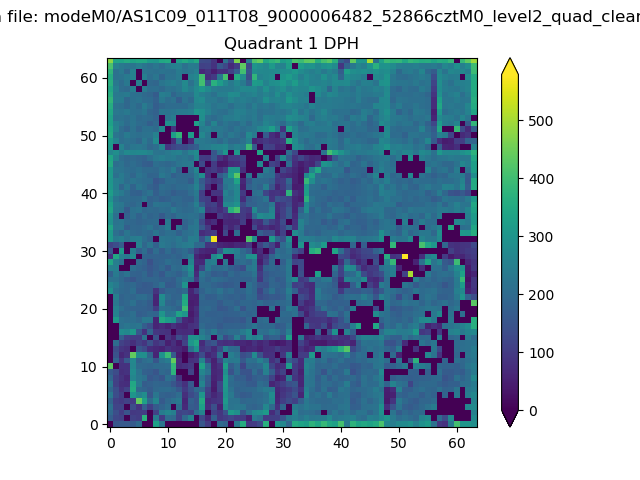 |
Quadrant B |
|---|---|---|---|
| Quadrant D | 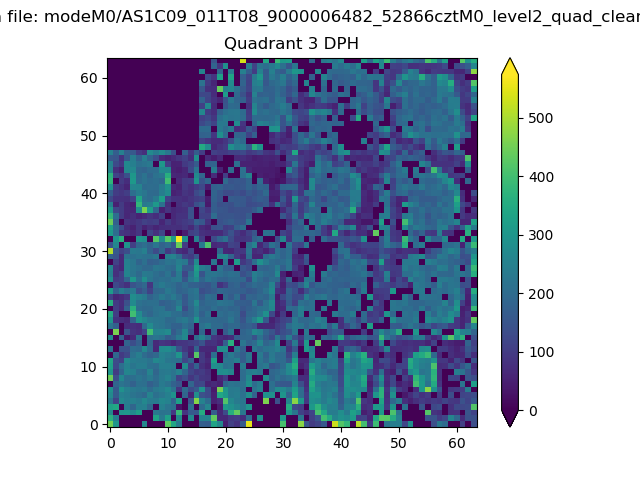 |
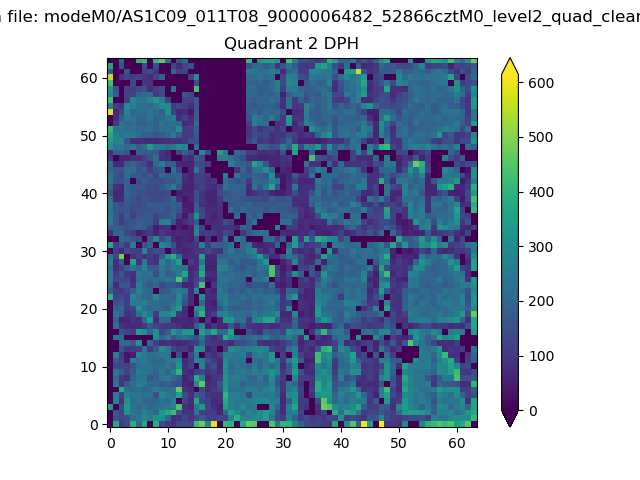 |
Quadrant C |
| Plot type | Count rate plots | Images |
|---|---|---|
| Comparison with Poisson distribution Blue bars denote a histogram of data divided into 1 sec bins. Red curve is a Poisson curve with rate = median count rate of data. |
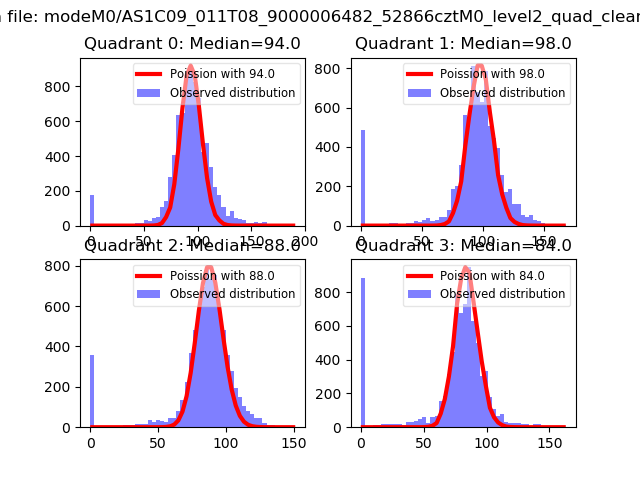 |
 |
| Quadrant-wise count rates Data is divided into 100 sec bins |
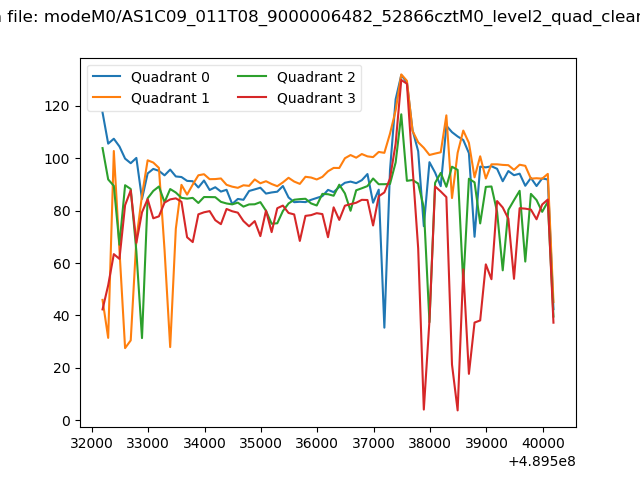 |
|
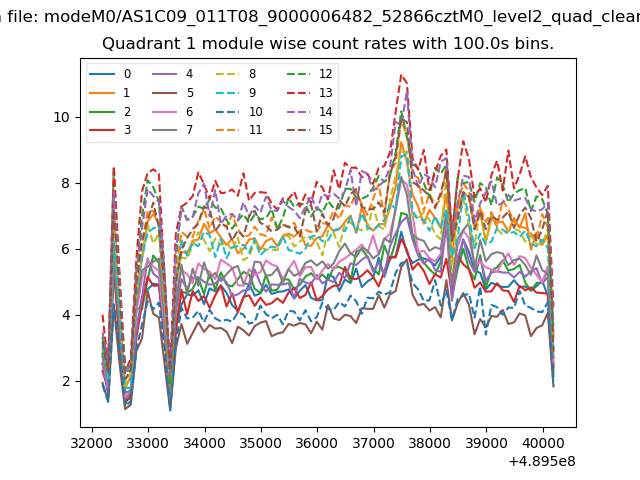
| Module-wise count rates for Quadrant A Data is divided into 100 sec bins |
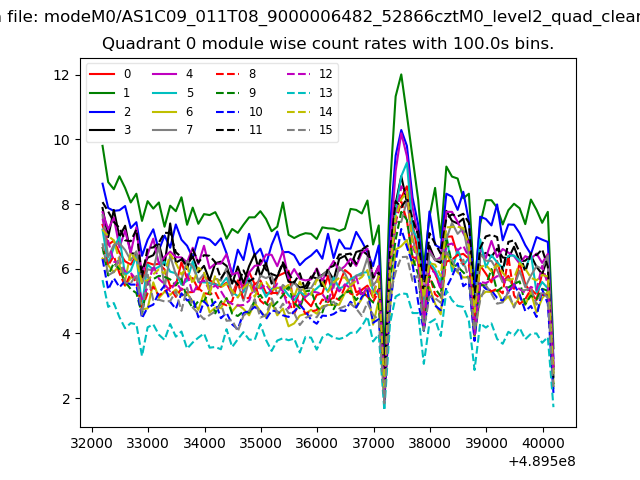 |
 |
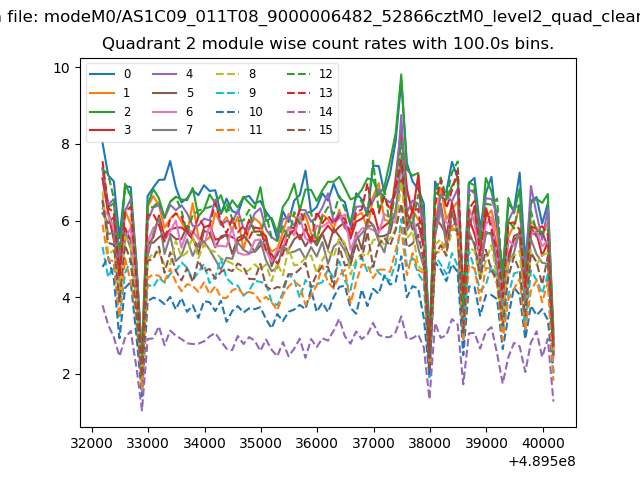
| Module-wise count rates for Quadrant B Data is divided into 100 sec bins |
 |
 |
| Module-wise count rates for Quadrant C Data is divided into 100 sec bins |
 |
 |
| Module-wise count rates for Quadrant D Data is divided into 100 sec bins |
 |
 |
| Parameter | Plot |
|---|---|
| CZT HV Monitor | 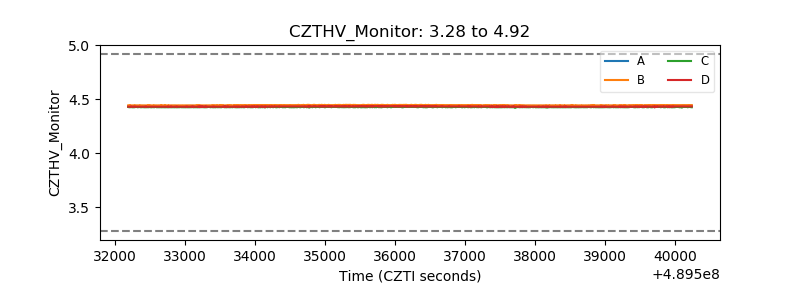 |
| D_VDD | 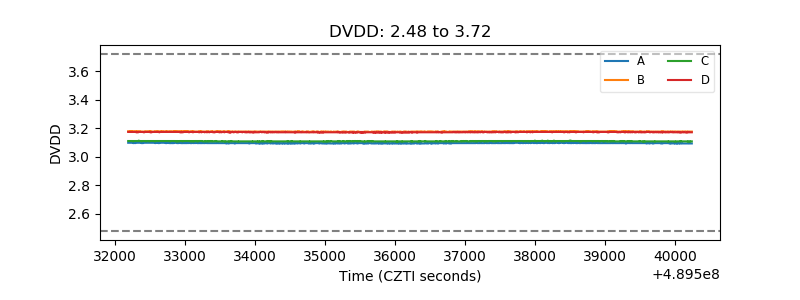 |
| Temperature 1 | 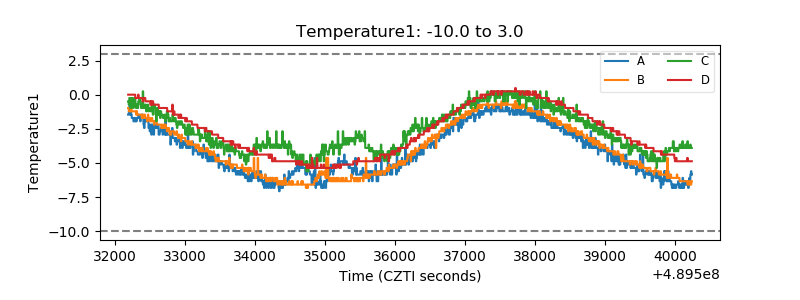 |
| Veto HV Monitor | 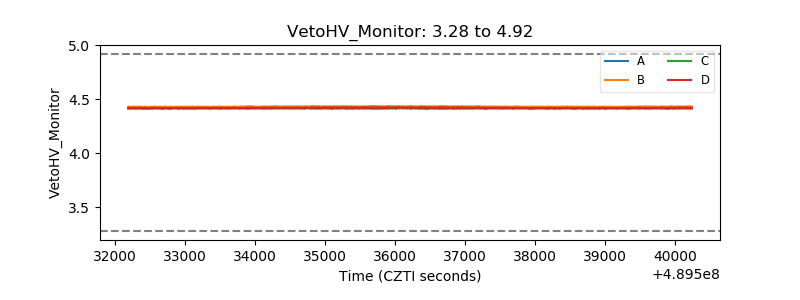 |
| Veto LLD | 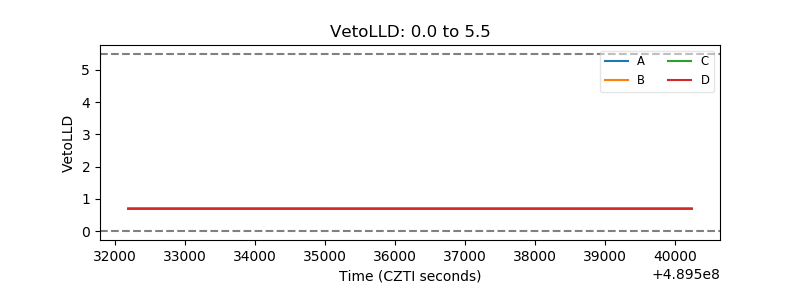 |
| Alpha Counter | 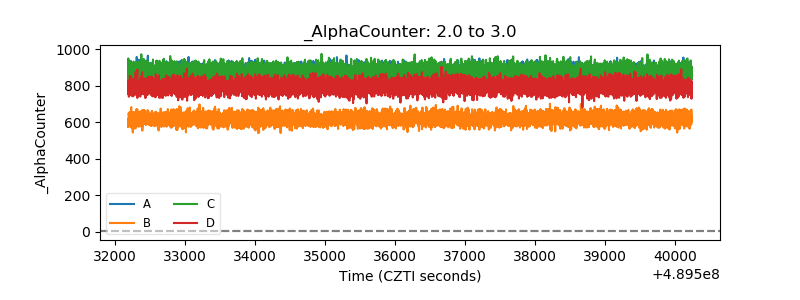 |
| _CPM_Rate | 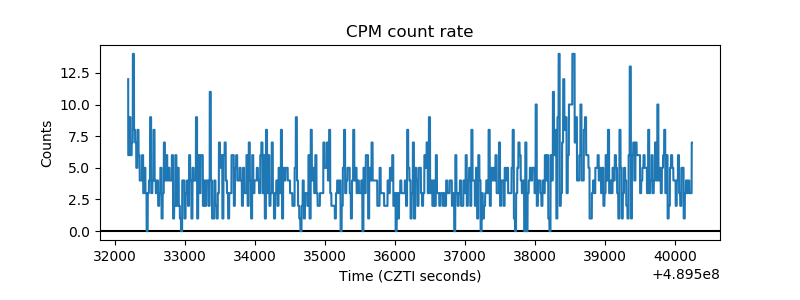 |
| CZT Counter | 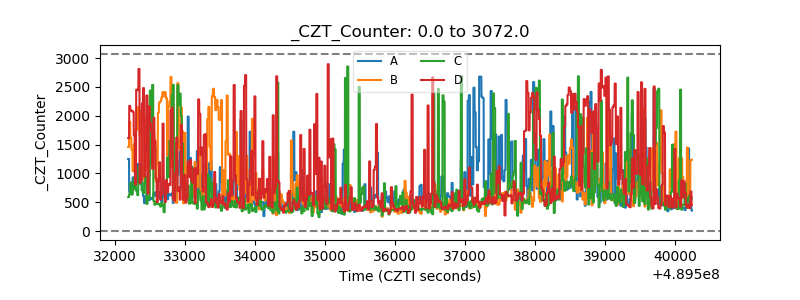 |
| +2.5 Volts monitor |  |
| +5 Volts monitor |  |
| _ROLL_ROT | 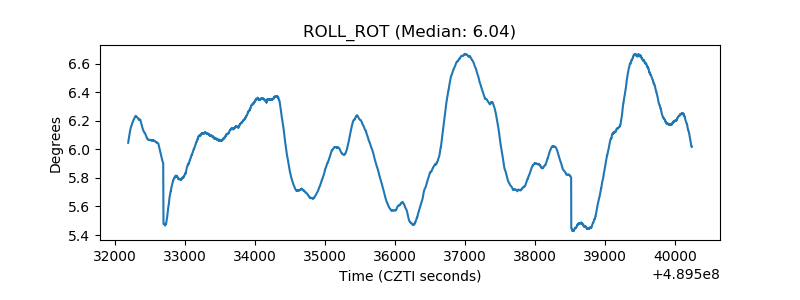 |
| _Roll_DEC | 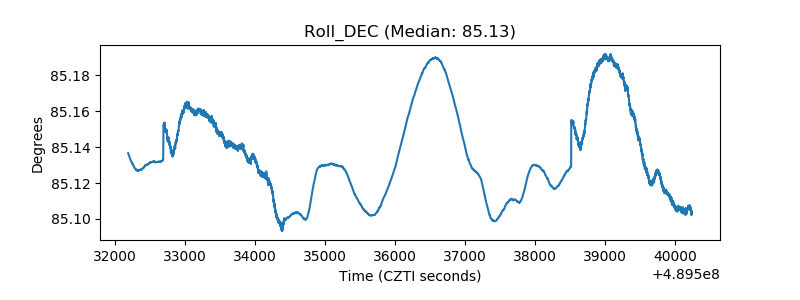 |
| _Roll_RA | 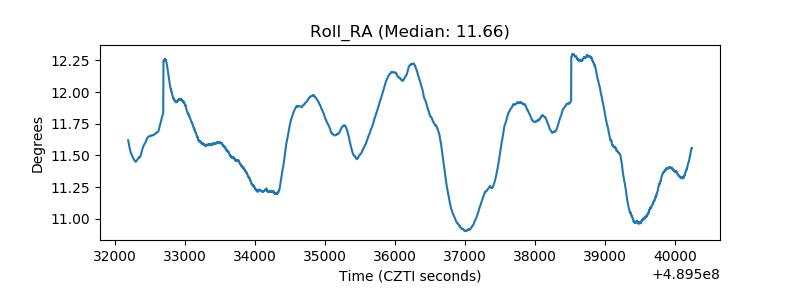 |
| Veto Counter | 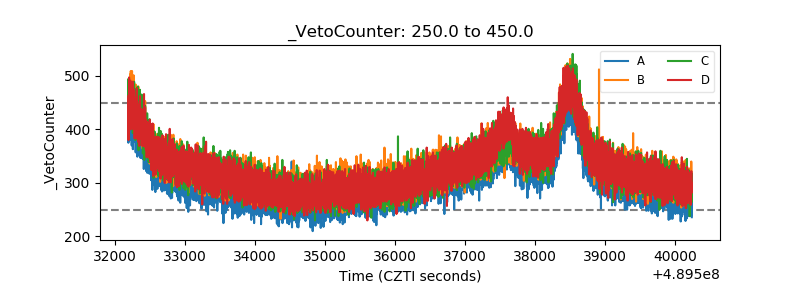 |