| Param | Original file | Final file |
|---|---|---|
| Filename | modeM0/AS1C09_011T08_9000006482_52869cztM0_level2.fits | modeM0/AS1C09_011T08_9000006482_52869cztM0_level2_quad_clean.evt |
| Size (bytes) | 1,932,802,560 | 251,628,480 |
| Size | 1.8 GB | 240.0 MB |
| Events in quadrant A | 19,170,379 | 1,481,338 |
| Events in quadrant B | 18,331,127 | 1,711,207 |
| Events in quadrant C | 15,218,486 | 1,608,818 |
| Events in quadrant D | 17,337,997 | 1,485,822 |
| Mode M0 | |||
|---|---|---|---|
| Quadrant | BADHDUFLAG | Total packets | Discarded packets |
| A | 0 | 70672 | 4 |
| B | 0 | 68132 | 4 |
| C | 0 | 59127 | 4 |
| D | 0 | 65021 | 4 |
| Mode M9 | |||
|---|---|---|---|
| Quadrant | BADHDUFLAG | Total packets | Discarded packets |
| A | 0 | 13 | 0 |
| B | 0 | 13 | 0 |
| C | 0 | 13 | 0 |
| D | 0 | 13 | 0 |
| Mode SS | |||
|---|---|---|---|
| Quadrant | BADHDUFLAG | Total packets | Discarded packets |
| A | 0 | 394 | 0 |
| B | 0 | 394 | 0 |
| C | 0 | 394 | 0 |
| D | 0 | 394 | 0 |
| Quadrant | Total seconds | Saturated seconds | Saturation percentage |
|---|---|---|---|
| A | 19301 | 3458 | 17.916170% |
| B | 19302 | 2450 | 12.692985% |
| C | 19302 | 1616 | 8.372189% |
| D | 19301 | 2326 | 12.051189% |
Noise dominated data is calculated using 1-second bins in cleaned event files. If a bin has >2000 counts, and if more than 50% of those come from <1% of pixels, then it is considered to be noise-dominated and hence unusable.
| Quadrant | # 1 sec bins | Bins with >0 counts | Bins with >2000 counts | High rate bins dominated by noise | Noise dominated (total time) | Noise dominated (detector-on time) | Marked lightcurve |
|---|---|---|---|---|---|---|---|
| A | 20631 | 19303 | 2993 | 2993 | 14.51% | 15.51% | 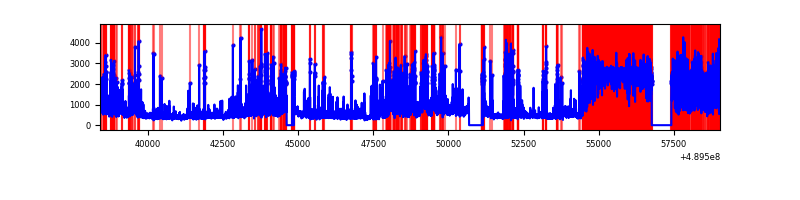 |
| B | 20632 | 19306 | 1440 | 1440 | 6.98% | 7.46% | 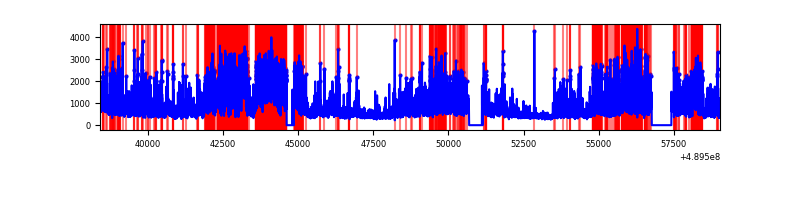 |
| C | 20632 | 19306 | 1254 | 1254 | 6.08% | 6.50% | 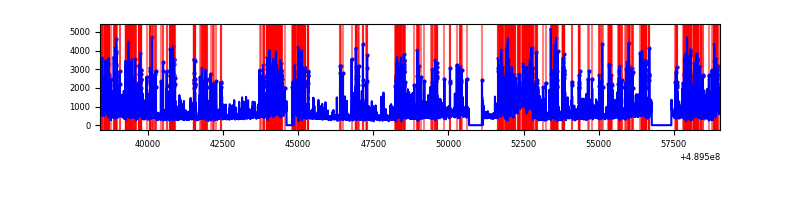 |
| D | 20631 | 19306 | 2025 | 2025 | 9.82% | 10.49% | 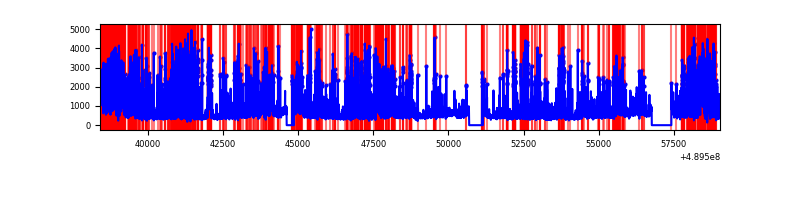 |
Top three noisy pixels from each quadrant. If the there are fewer than three noisy pixels in the level2.evt file, extra rows are filled as -1
| Pixel properties | Quadrant properties | ||||||
|---|---|---|---|---|---|---|---|
| Quadrant | DetID | PixID | Counts | Sigma | Mean | Median | Sigma |
| A | 9 | 191 | 9428358 | 20345.19 | 1845 | 1799 | 463.3 |
| A | 0 | 8 | 743286 | 1600.34 | 1845 | 1799 | 463.3 |
| A | 3 | 62 | 433575 | 931.89 | 1845 | 1799 | 463.3 |
| B | 8 | 3 | 8932791 | 21762.67 | 1950 | 1881 | 410.4 |
| B | 4 | 81 | 427362 | 1036.8 | 1950 | 1881 | 410.4 |
| B | 0 | 213 | 306950 | 743.39 | 1950 | 1881 | 410.4 |
| C | 2 | 12 | 4363811 | 8188.11 | 1929 | 1904 | 532.7 |
| C | 13 | 3 | 905114 | 1695.49 | 1929 | 1904 | 532.7 |
| C | 15 | 224 | 554178 | 1036.72 | 1929 | 1904 | 532.7 |
| D | 8 | 176 | 2781001 | 5144.33 | 1886 | 1800 | 540.2 |
| D | 12 | 17 | 2371213 | 4385.81 | 1886 | 1800 | 540.2 |
| D | 15 | 125 | 874418 | 1615.22 | 1886 | 1800 | 540.2 |
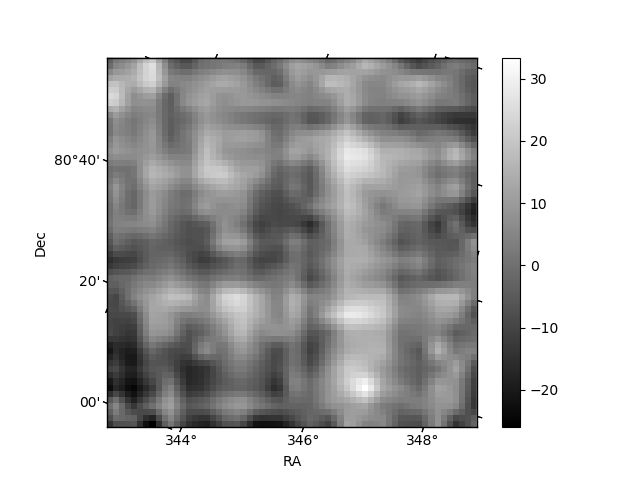
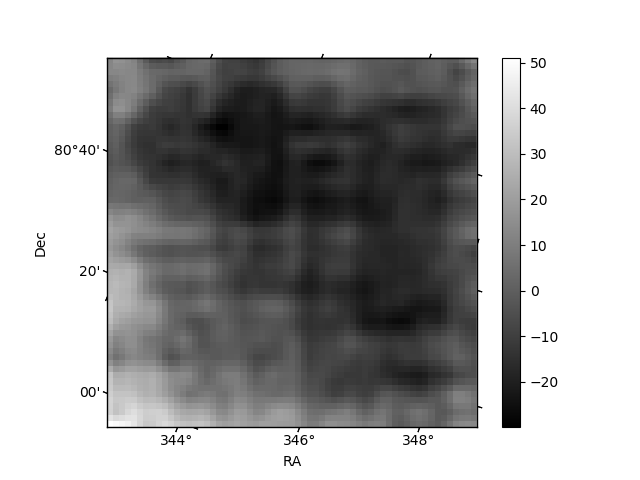
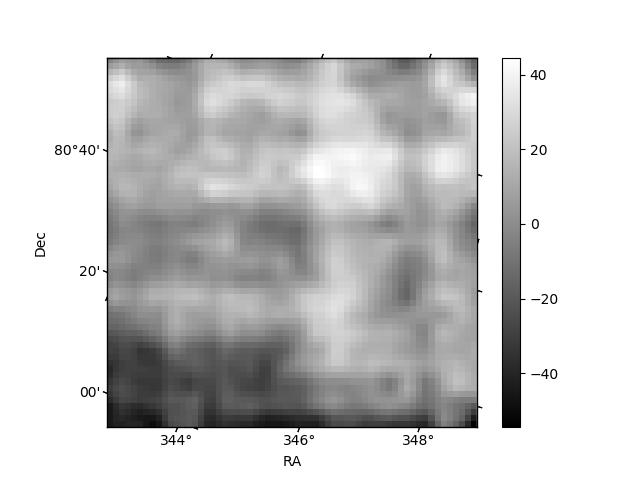
Histogram calculated using DETX and DETY for each event in the final _common_clean file
| Quadrant A | 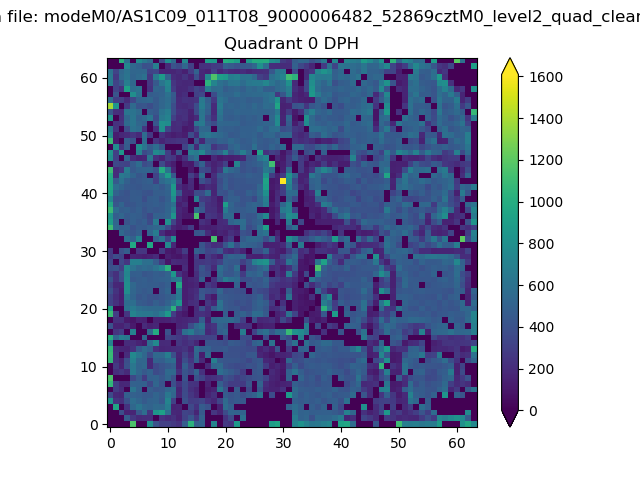 |
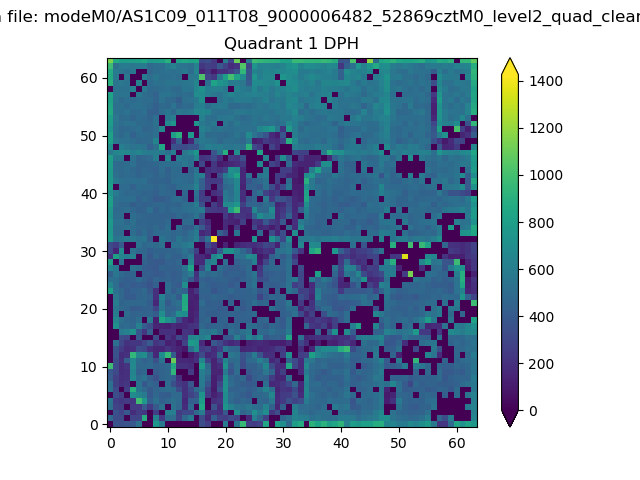 |
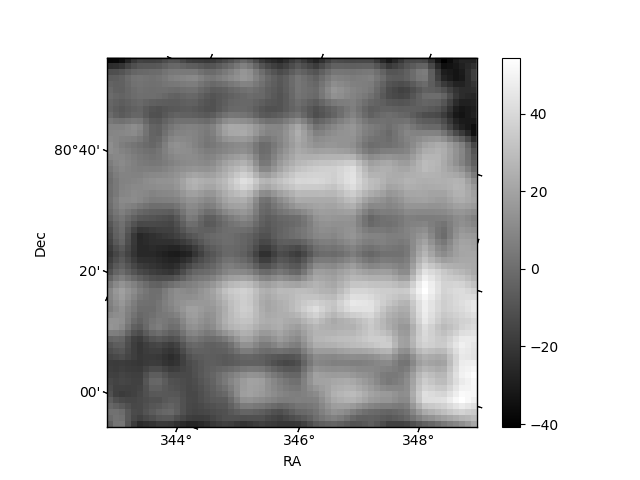
Quadrant B |
|---|---|---|---|
| Quadrant D | 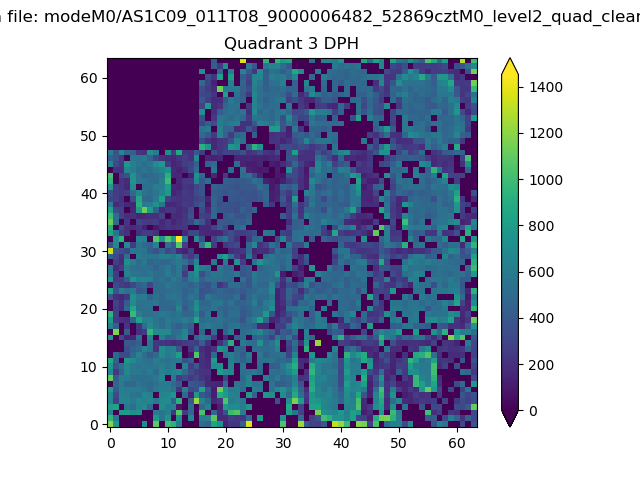 |
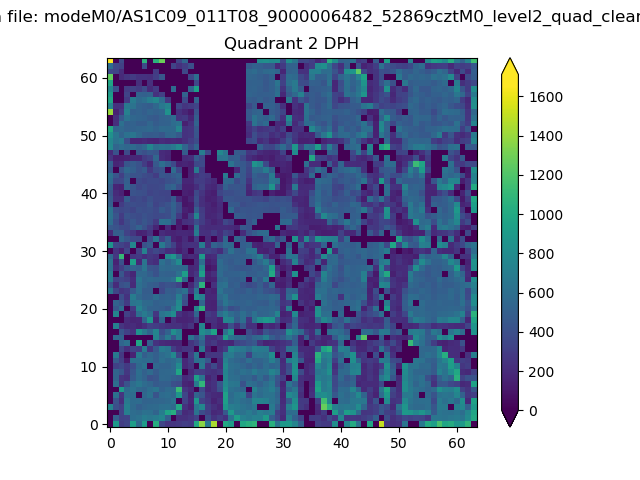 |
Quadrant C |
| Plot type | Count rate plots | Images |
|---|---|---|
| Comparison with Poisson distribution Blue bars denote a histogram of data divided into 1 sec bins. Red curve is a Poisson curve with rate = median count rate of data. |
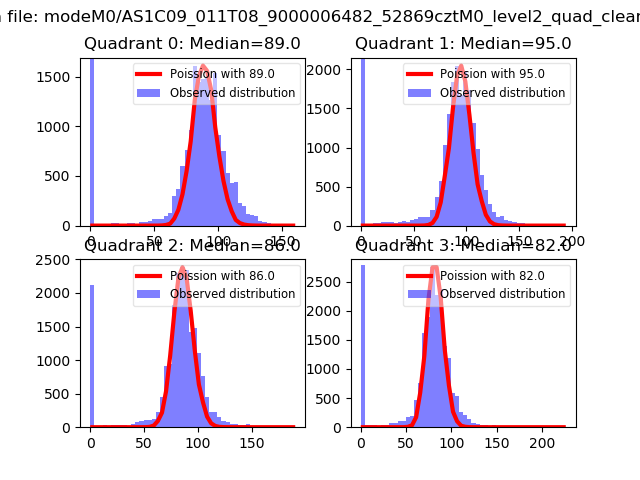 |
 |
| Quadrant-wise count rates Data is divided into 100 sec bins |
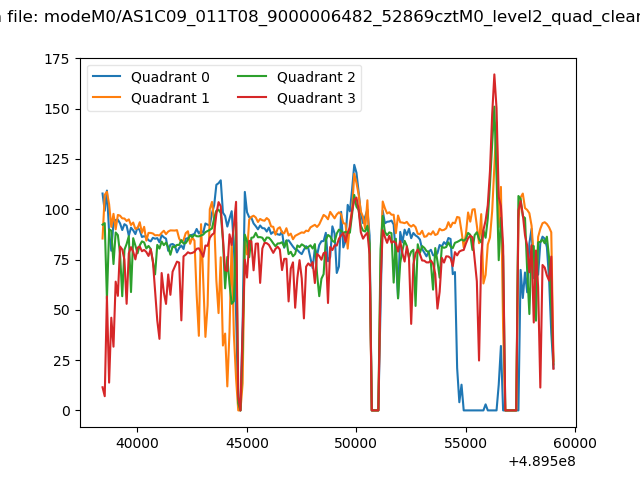 |
|
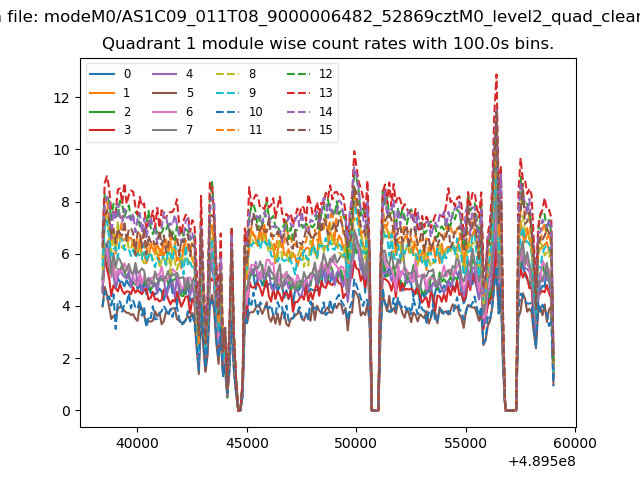
| Module-wise count rates for Quadrant A Data is divided into 100 sec bins |
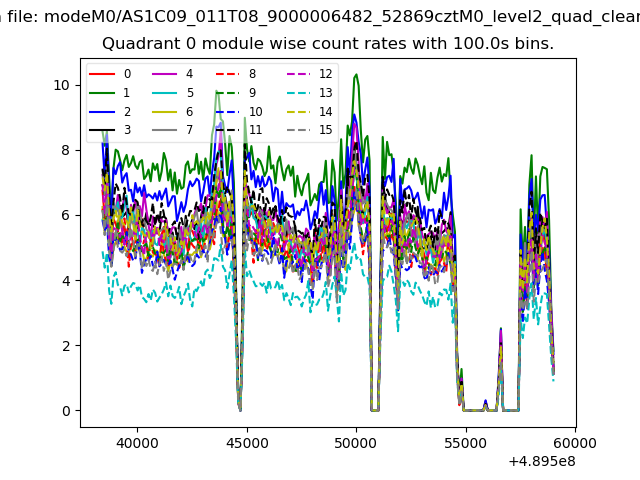 |
 |
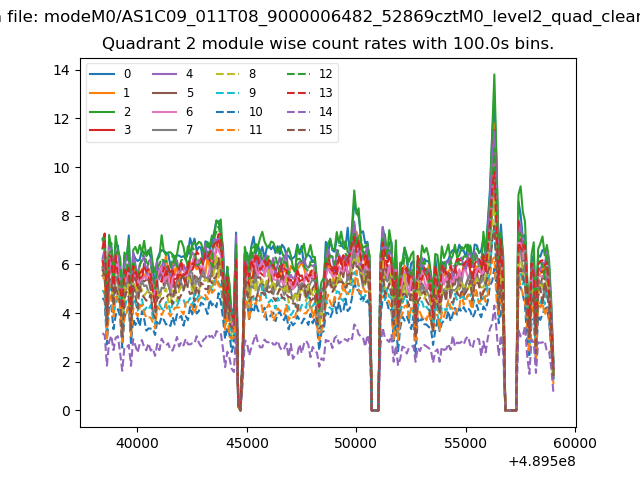
| Module-wise count rates for Quadrant B Data is divided into 100 sec bins |
 |
 |
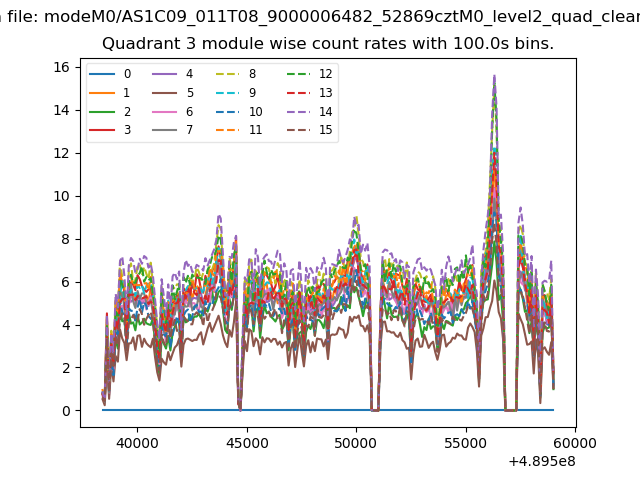
| Module-wise count rates for Quadrant C Data is divided into 100 sec bins |
 |
 |
| Module-wise count rates for Quadrant D Data is divided into 100 sec bins |
 |
 |
| Parameter | Plot |
|---|---|
| CZT HV Monitor | 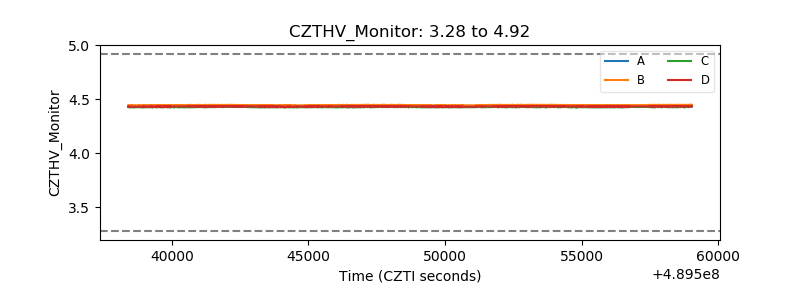 |
| D_VDD | 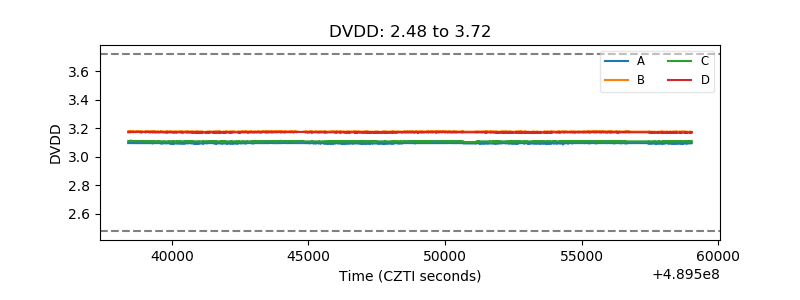 |
| Temperature 1 | 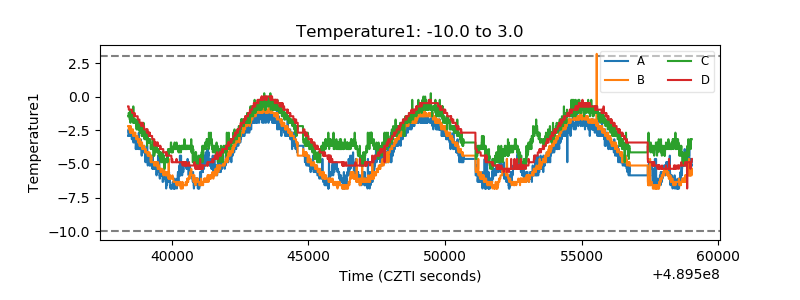 |
| Veto HV Monitor | 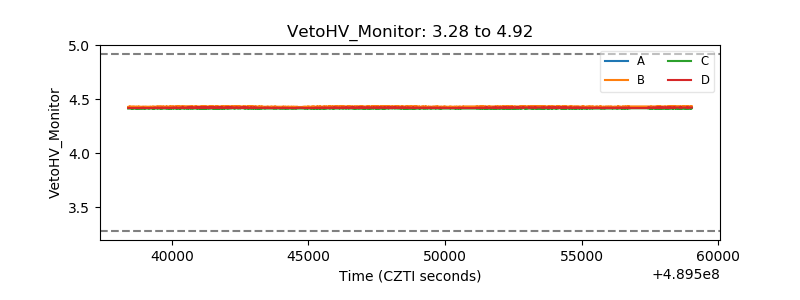 |
| Veto LLD | 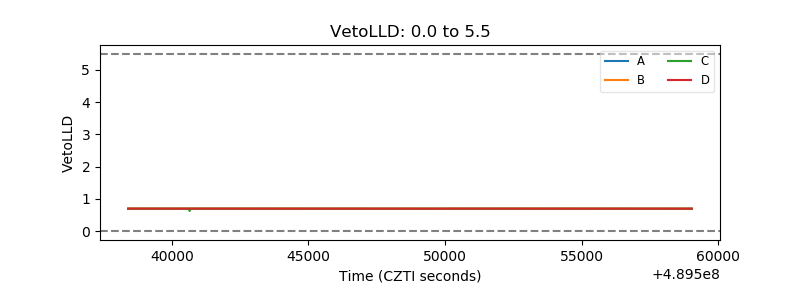 |
| Alpha Counter |  |
| _CPM_Rate | 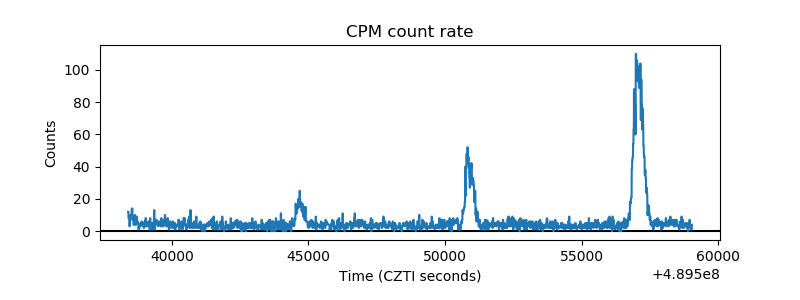 |
| CZT Counter | 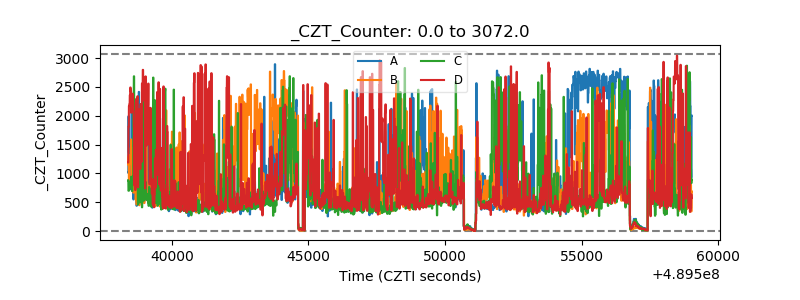 |
| +2.5 Volts monitor | 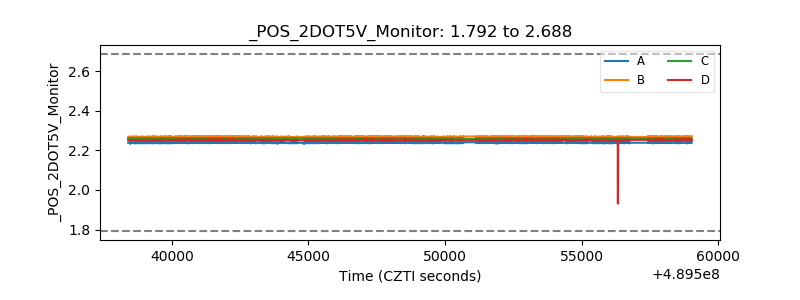 |
| +5 Volts monitor | 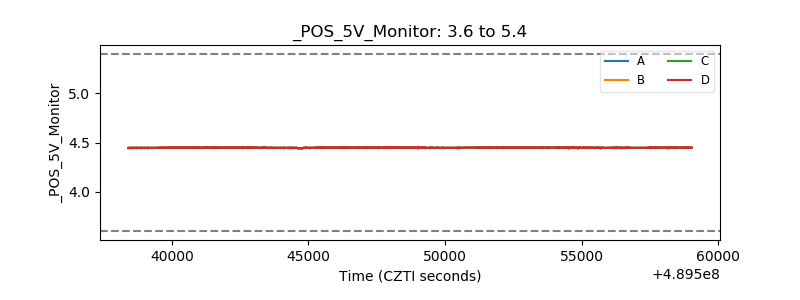 |
| _ROLL_ROT | 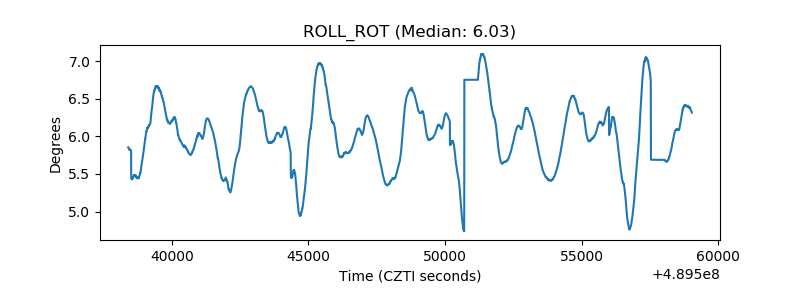 |
| _Roll_DEC | 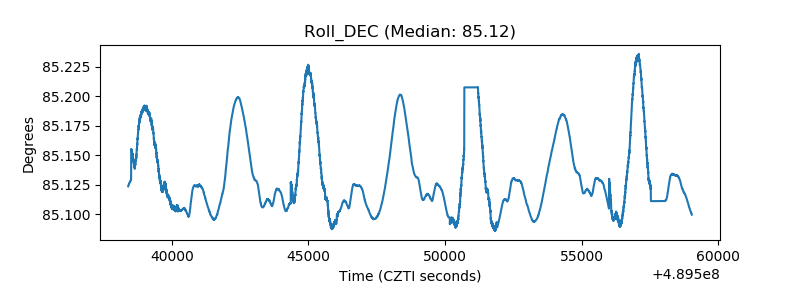 |
| _Roll_RA | 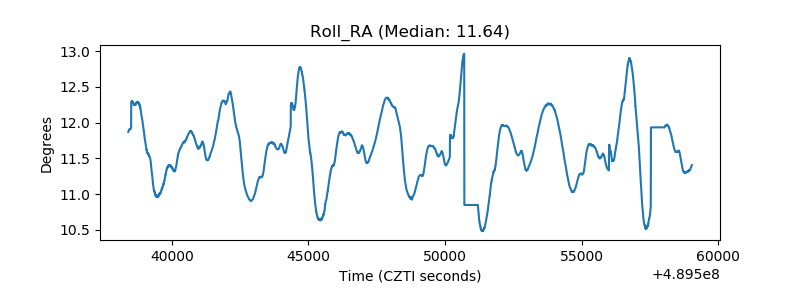 |
| Veto Counter | 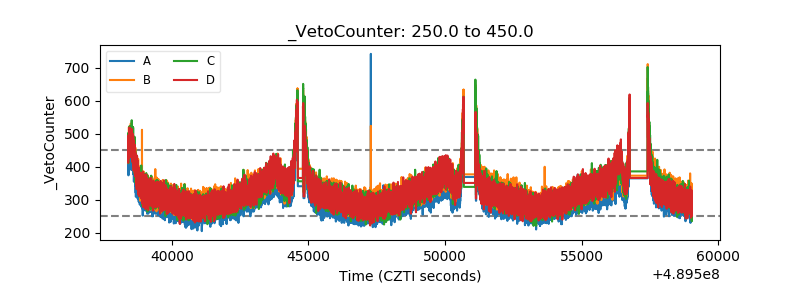 |