| Param | Original file | Final file |
|---|---|---|
| Filename | modeM0/AS1C09_011T08_9000006482_52870cztM0_level2.fits | modeM0/AS1C09_011T08_9000006482_52870cztM0_level2_quad_clean.evt |
| Size (bytes) | 874,016,640 | 73,082,880 |
| Size | 833.5 MB | 69.7 MB |
| Events in quadrant A | 13,951,848 | 140,077 |
| Events in quadrant B | 7,957,690 | 530,445 |
| Events in quadrant C | 3,849,167 | 580,827 |
| Events in quadrant D | 6,104,223 | 519,155 |
| Mode M0 | |||
|---|---|---|---|
| Quadrant | BADHDUFLAG | Total packets | Discarded packets |
| A | 0 | 45732 | 1 |
| B | 0 | 27999 | 1 |
| C | 0 | 16099 | 1 |
| D | 0 | 22670 | 1 |
| Mode M9 | |||
|---|---|---|---|
| Quadrant | BADHDUFLAG | Total packets | Discarded packets |
| A | 0 | 8 | 0 |
| B | 0 | 8 | 0 |
| C | 0 | 8 | 0 |
| D | 0 | 8 | 0 |
| Mode SS | |||
|---|---|---|---|
| Quadrant | BADHDUFLAG | Total packets | Discarded packets |
| A | 0 | 128 | 0 |
| B | 0 | 128 | 0 |
| C | 0 | 128 | 0 |
| D | 0 | 128 | 0 |
| Quadrant | Total seconds | Saturated seconds | Saturation percentage |
|---|---|---|---|
| A | 6333 | 5005 | 79.030475% |
| B | 6334 | 1578 | 24.913167% |
| C | 6334 | 241 | 3.804863% |
| D | 6334 | 847 | 13.372277% |
Noise dominated data is calculated using 1-second bins in cleaned event files. If a bin has >2000 counts, and if more than 50% of those come from <1% of pixels, then it is considered to be noise-dominated and hence unusable.
| Quadrant | # 1 sec bins | Bins with >0 counts | Bins with >2000 counts | High rate bins dominated by noise | Noise dominated (total time) | Noise dominated (detector-on time) | Marked lightcurve |
|---|---|---|---|---|---|---|---|
| A | 7143 | 6333 | 4435 | 4435 | 62.09% | 70.03% | 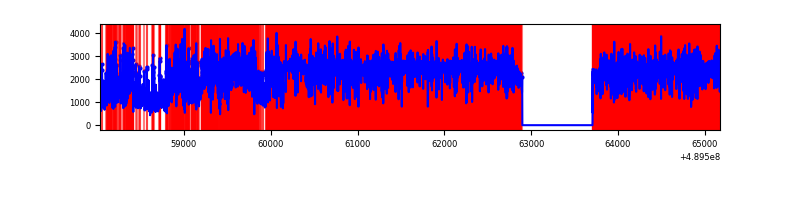 |
| B | 7144 | 6335 | 1164 | 1164 | 16.29% | 18.37% | 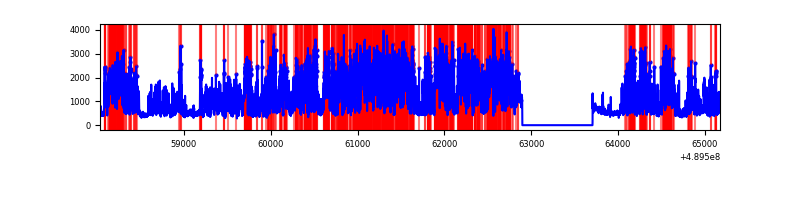 |
| C | 7144 | 6335 | 184 | 184 | 2.58% | 2.90% | 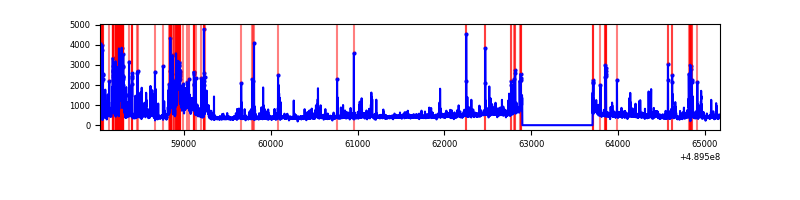 |
| D | 7144 | 6335 | 730 | 730 | 10.22% | 11.52% | 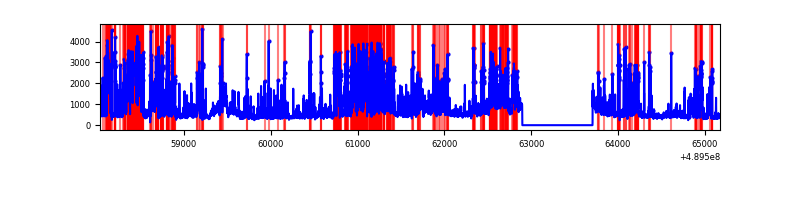 |
Top three noisy pixels from each quadrant. If the there are fewer than three noisy pixels in the level2.evt file, extra rows are filled as -1
| Pixel properties | Quadrant properties | ||||||
|---|---|---|---|---|---|---|---|
| Quadrant | DetID | PixID | Counts | Sigma | Mean | Median | Sigma |
| A | 9 | 191 | 11339493 | 105058.49 | 417 | 407 | 107.9 |
| A | 3 | 62 | 373184 | 3453.84 | 417 | 407 | 107.9 |
| A | 15 | 174 | 192477 | 1779.56 | 417 | 407 | 107.9 |
| B | 8 | 3 | 5058169 | 38418.76 | 616 | 595 | 131.6 |
| B | 5 | 185 | 114215 | 863.09 | 616 | 595 | 131.6 |
| B | 8 | 128 | 59571 | 448.0 | 616 | 595 | 131.6 |
| C | 2 | 12 | 650692 | 3640.8 | 638 | 630 | 178.5 |
| C | 7 | 80 | 221458 | 1236.79 | 638 | 630 | 178.5 |
| C | 13 | 3 | 204060 | 1139.35 | 638 | 630 | 178.5 |
| D | 8 | 176 | 1725277 | 9524.05 | 619 | 589 | 181.1 |
| D | 12 | 17 | 636905 | 3513.86 | 619 | 589 | 181.1 |
| D | 15 | 125 | 263805 | 1453.53 | 619 | 589 | 181.1 |
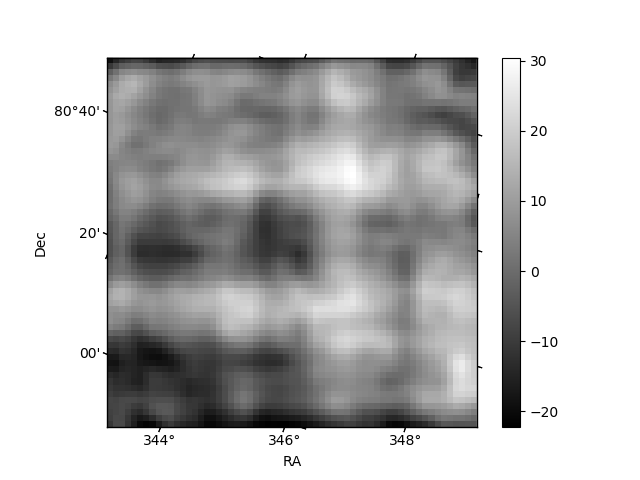
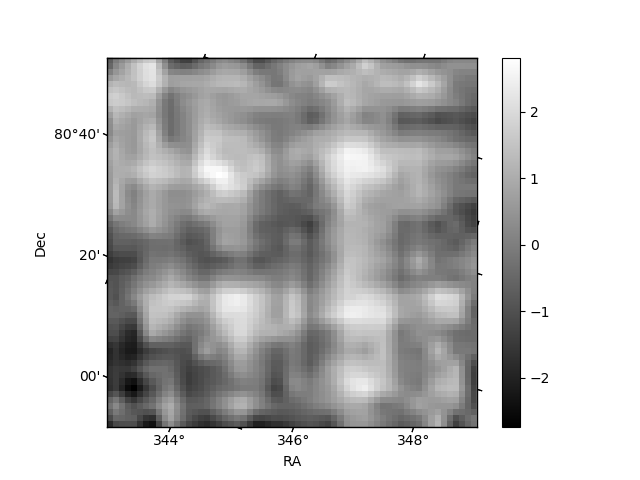
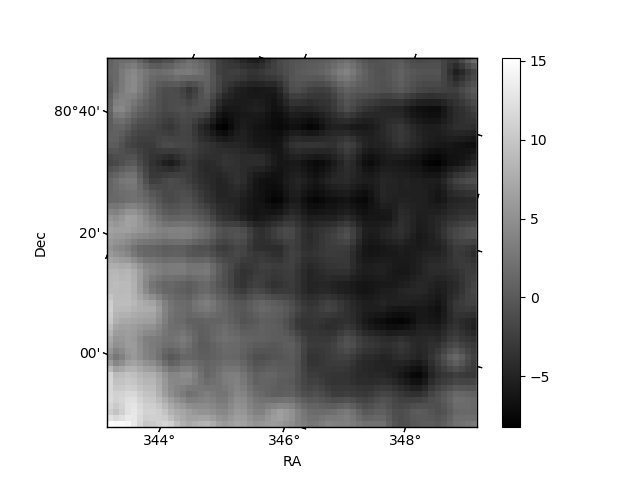
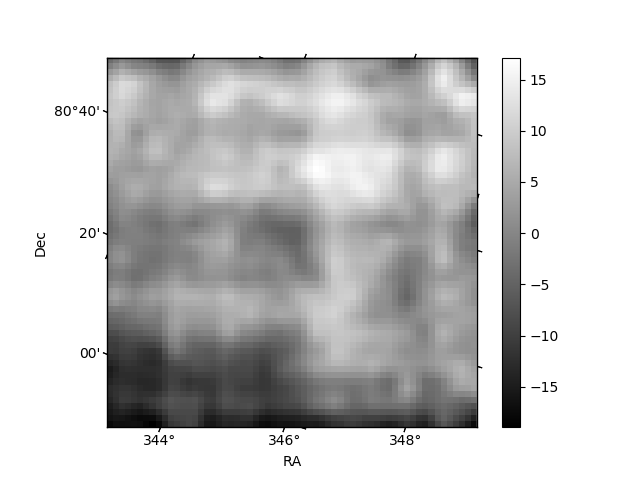
Histogram calculated using DETX and DETY for each event in the final _common_clean file
| Quadrant A | 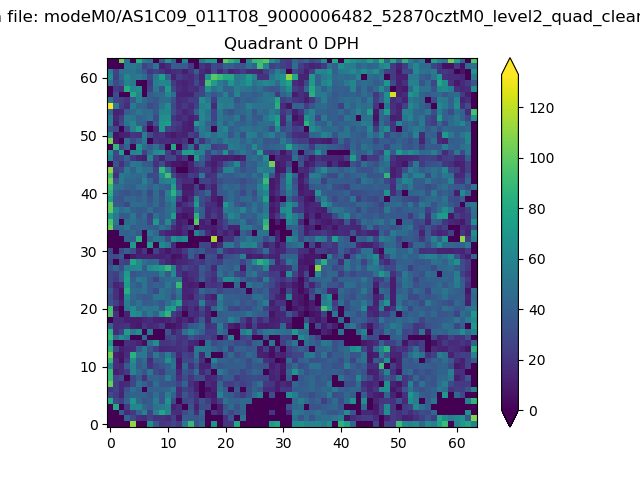 |
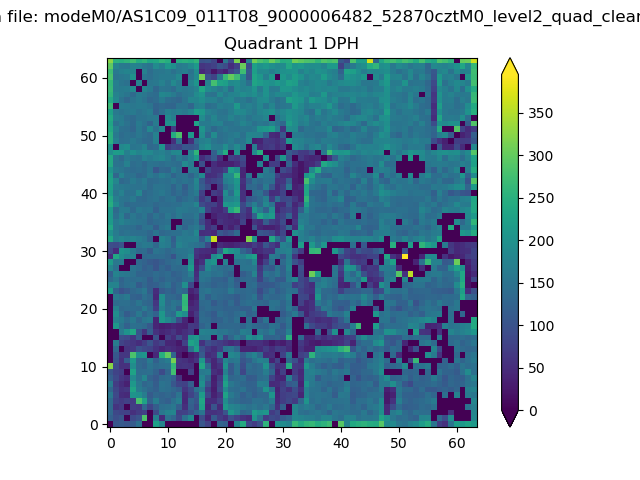 |
Quadrant B |
|---|---|---|---|
| Quadrant D | 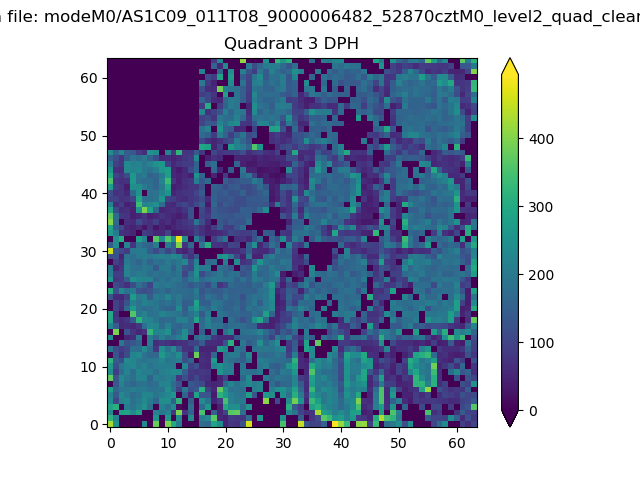 |
 |
Quadrant C |
| Plot type | Count rate plots | Images |
|---|---|---|
| Comparison with Poisson distribution Blue bars denote a histogram of data divided into 1 sec bins. Red curve is a Poisson curve with rate = median count rate of data. |
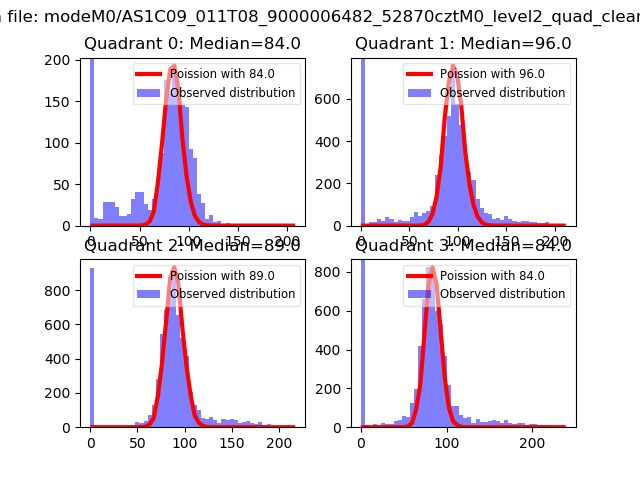 |
 |
| Quadrant-wise count rates Data is divided into 100 sec bins |
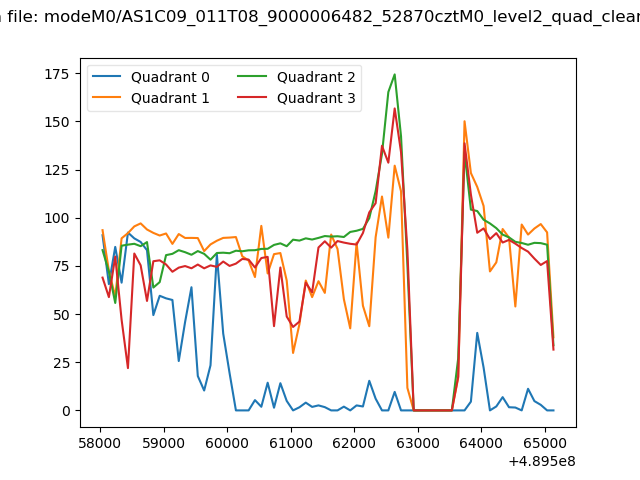 |
|
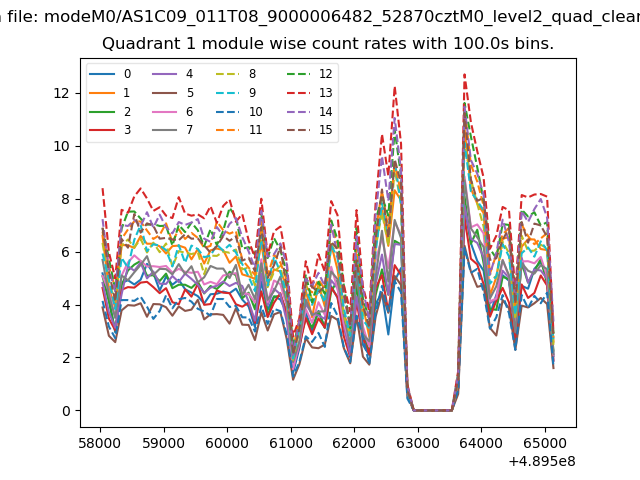
| Module-wise count rates for Quadrant A Data is divided into 100 sec bins |
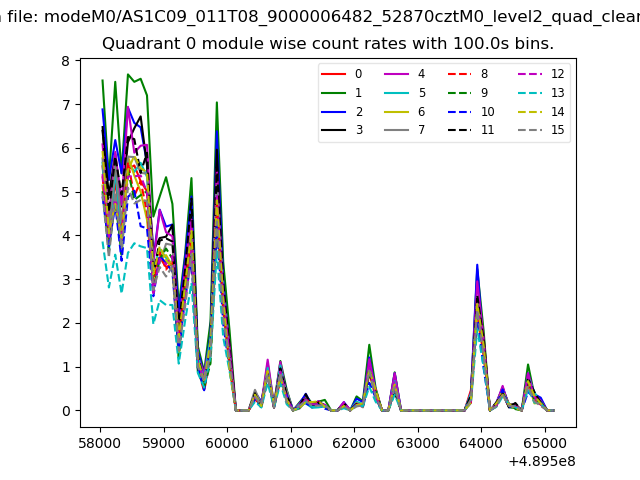 |
 |
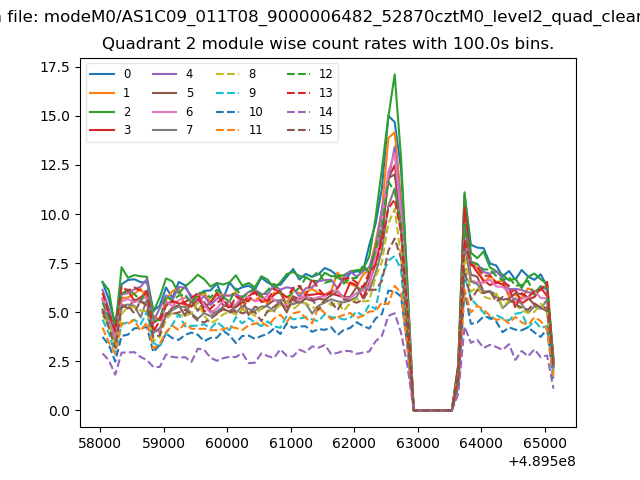
| Module-wise count rates for Quadrant B Data is divided into 100 sec bins |
 |
 |
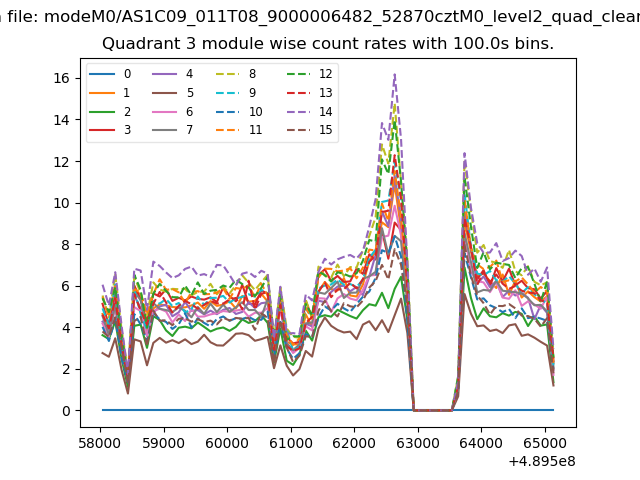
| Module-wise count rates for Quadrant C Data is divided into 100 sec bins |
 |
 |
| Module-wise count rates for Quadrant D Data is divided into 100 sec bins |
 |
 |
| Parameter | Plot |
|---|---|
| CZT HV Monitor | 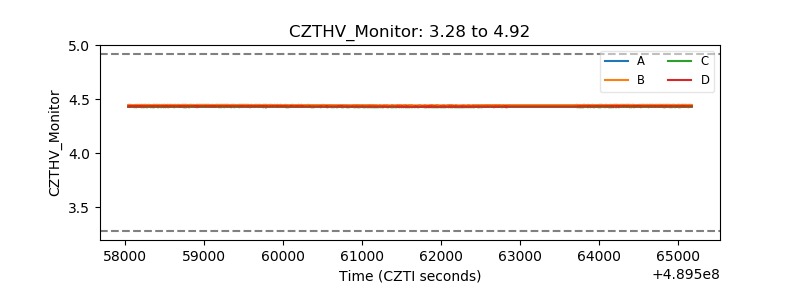 |
| D_VDD | 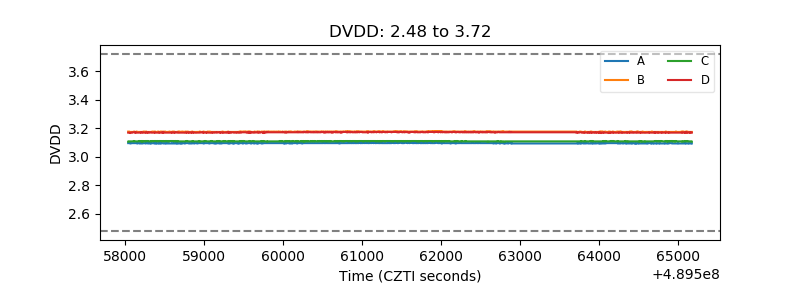 |
| Temperature 1 | 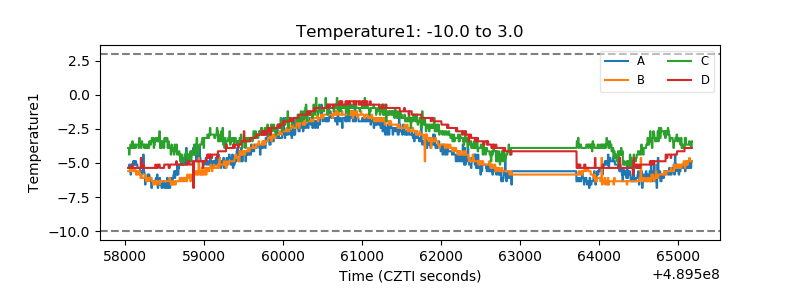 |
| Veto HV Monitor | 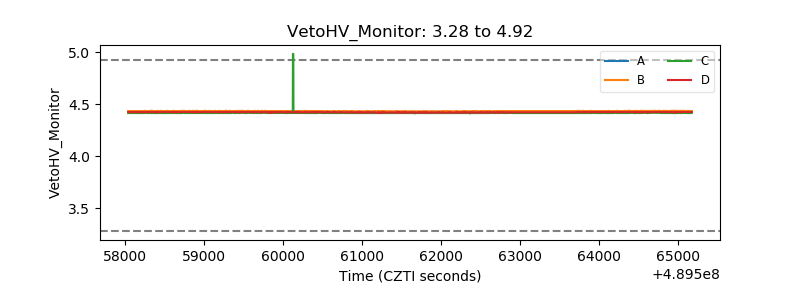 |
| Veto LLD | 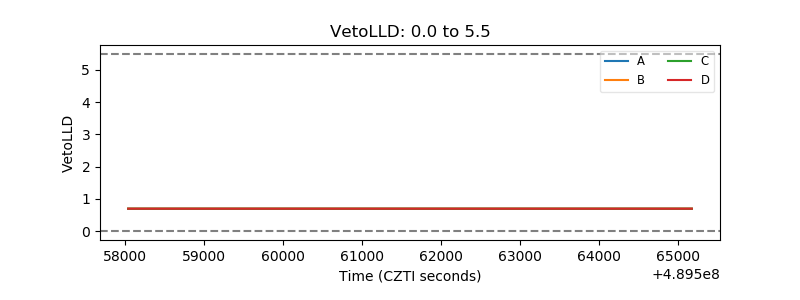 |
| Alpha Counter | 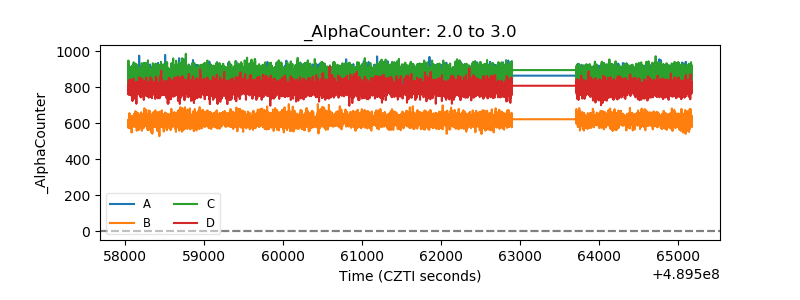 |
| _CPM_Rate | 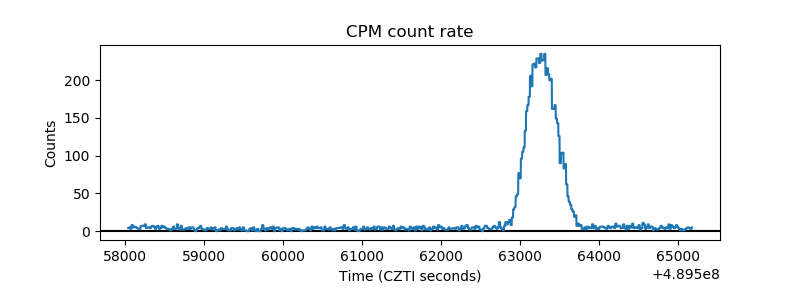 |
| CZT Counter | 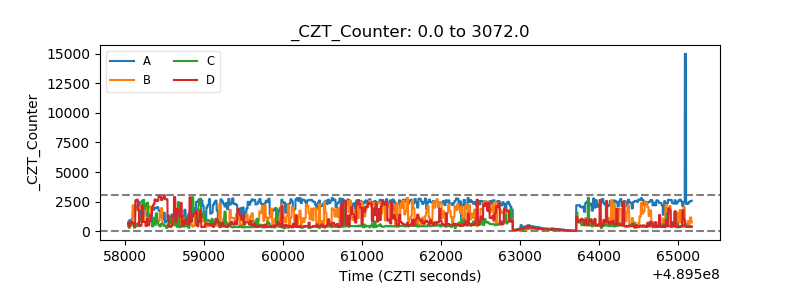 |
| +2.5 Volts monitor |  |
| +5 Volts monitor |  |
| _ROLL_ROT | 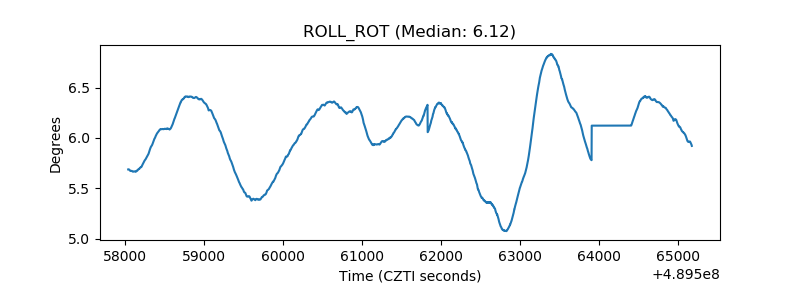 |
| _Roll_DEC | 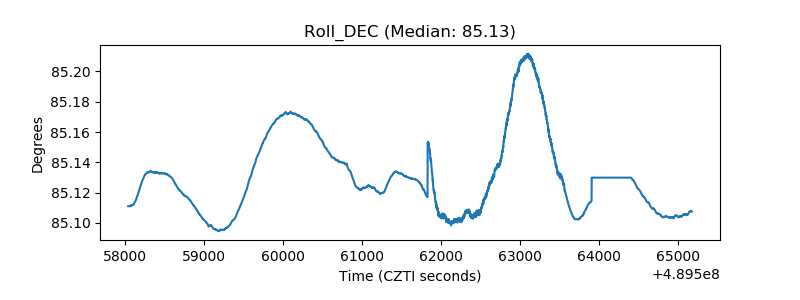 |
| _Roll_RA | 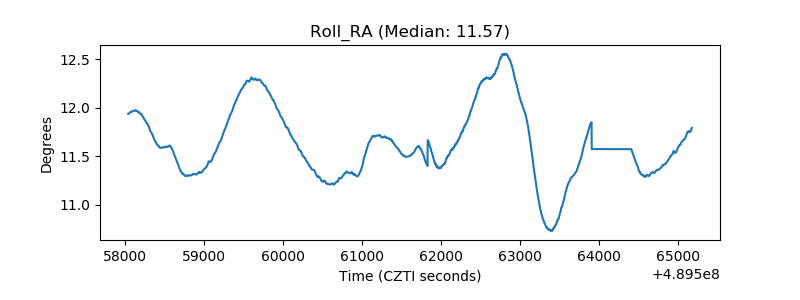 |
| Veto Counter | 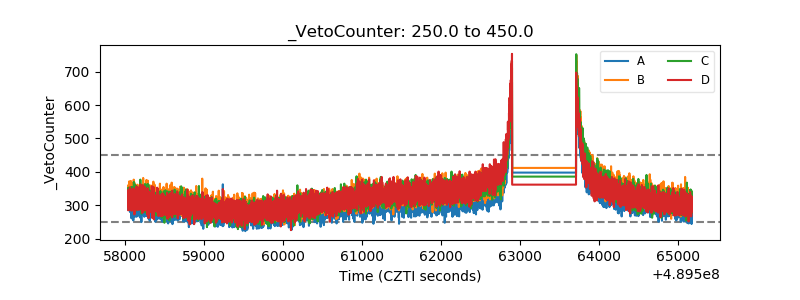 |