| Param | Original file | Final file |
|---|---|---|
| Filename | modeM0/AS1C09_011T08_9000006482_52872cztM0_level2.fits | modeM0/AS1C09_011T08_9000006482_52872cztM0_level2_quad_clean.evt |
| Size (bytes) | 925,513,920 | 66,000,960 |
| Size | 882.6 MB | 62.9 MB |
| Events in quadrant A | 14,531,605 | 16,946 |
| Events in quadrant B | 7,028,056 | 545,344 |
| Events in quadrant C | 8,076,068 | 417,740 |
| Events in quadrant D | 4,159,947 | 599,644 |
| Mode M0 | |||
|---|---|---|---|
| Quadrant | BADHDUFLAG | Total packets | Discarded packets |
| A | 0 | 47159 | 3 |
| B | 0 | 25014 | 1 |
| C | 0 | 28226 | 1 |
| D | 0 | 16647 | 1 |
| Mode M9 | |||
|---|---|---|---|
| Quadrant | BADHDUFLAG | Total packets | Discarded packets |
| A | 0 | 10 | 0 |
| B | 0 | 10 | 0 |
| C | 0 | 10 | 0 |
| D | 0 | 10 | 0 |
| Mode SS | |||
|---|---|---|---|
| Quadrant | BADHDUFLAG | Total packets | Discarded packets |
| A | 0 | 122 | 0 |
| B | 0 | 122 | 0 |
| C | 0 | 122 | 0 |
| D | 0 | 122 | 0 |
| Quadrant | Total seconds | Saturated seconds | Saturation percentage |
|---|---|---|---|
| A | 5993 | 5874 | 98.014350% |
| B | 5993 | 1290 | 21.525113% |
| C | 5993 | 2086 | 34.807275% |
| D | 5993 | 181 | 3.020190% |
Noise dominated data is calculated using 1-second bins in cleaned event files. If a bin has >2000 counts, and if more than 50% of those come from <1% of pixels, then it is considered to be noise-dominated and hence unusable.
| Quadrant | # 1 sec bins | Bins with >0 counts | Bins with >2000 counts | High rate bins dominated by noise | Noise dominated (total time) | Noise dominated (detector-on time) | Marked lightcurve |
|---|---|---|---|---|---|---|---|
| A | 6982 | 5992 | 5385 | 5385 | 77.13% | 89.87% | 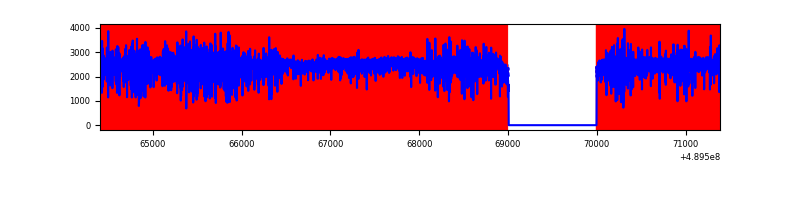 |
| B | 6983 | 5994 | 1016 | 1016 | 14.55% | 16.95% | 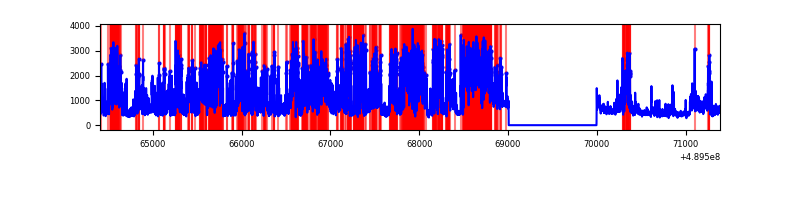 |
| C | 6983 | 5994 | 1917 | 1917 | 27.45% | 31.98% | 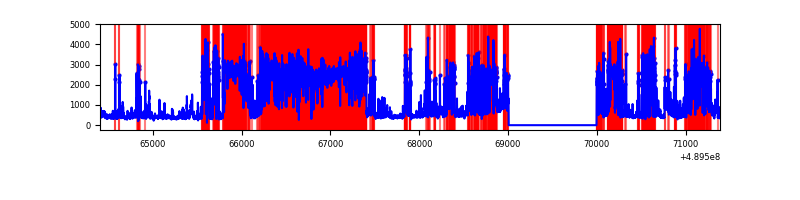 |
| D | 6983 | 5994 | 157 | 157 | 2.25% | 2.62% |  |
Top three noisy pixels from each quadrant. If the there are fewer than three noisy pixels in the level2.evt file, extra rows are filled as -1
| Pixel properties | Quadrant properties | ||||||
|---|---|---|---|---|---|---|---|
| Quadrant | DetID | PixID | Counts | Sigma | Mean | Median | Sigma |
| A | 9 | 191 | 12978977 | 165544.69 | 291 | 284 | 78.4 |
| A | 15 | 174 | 80809 | 1027.11 | 291 | 284 | 78.4 |
| A | 0 | 8 | 76969 | 978.13 | 291 | 284 | 78.4 |
| B | 8 | 3 | 4007508 | 31221.13 | 595 | 576 | 128.3 |
| B | 4 | 81 | 218554 | 1698.44 | 595 | 576 | 128.3 |
| B | 8 | 128 | 124355 | 964.46 | 595 | 576 | 128.3 |
| C | 2 | 12 | 4899545 | 34526.81 | 495 | 490 | 141.9 |
| C | 4 | 5 | 530867 | 3737.91 | 495 | 490 | 141.9 |
| C | 7 | 80 | 326312 | 2296.28 | 495 | 490 | 141.9 |
| D | 8 | 176 | 545602 | 2848.05 | 638 | 610 | 191.4 |
| D | 2 | 120 | 284690 | 1484.56 | 638 | 610 | 191.4 |
| D | 2 | 153 | 191950 | 999.92 | 638 | 610 | 191.4 |
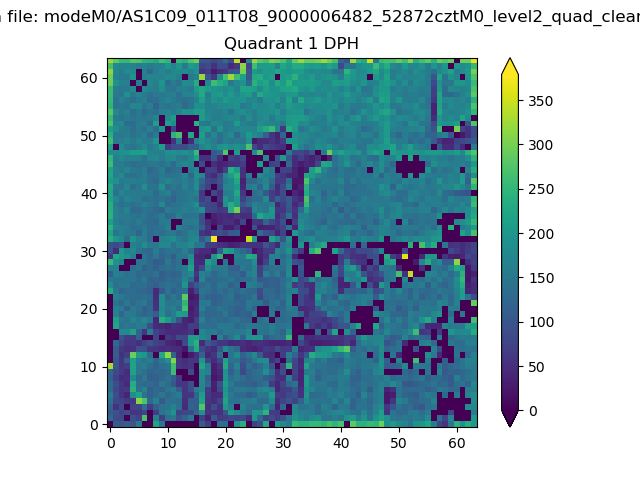
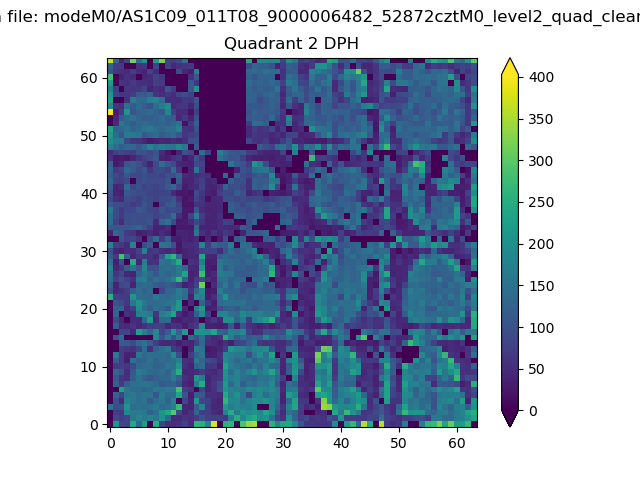
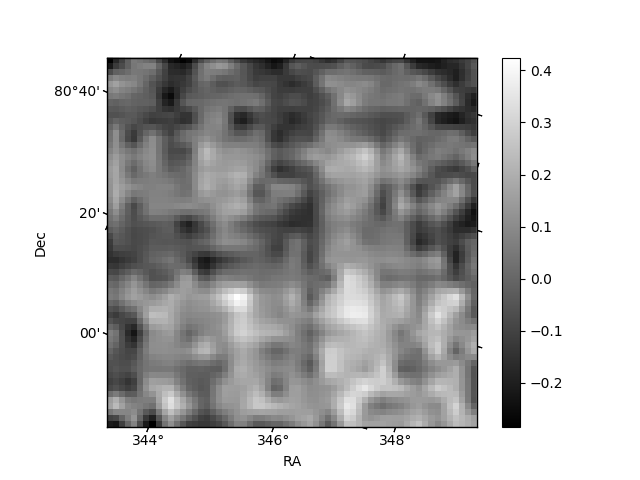
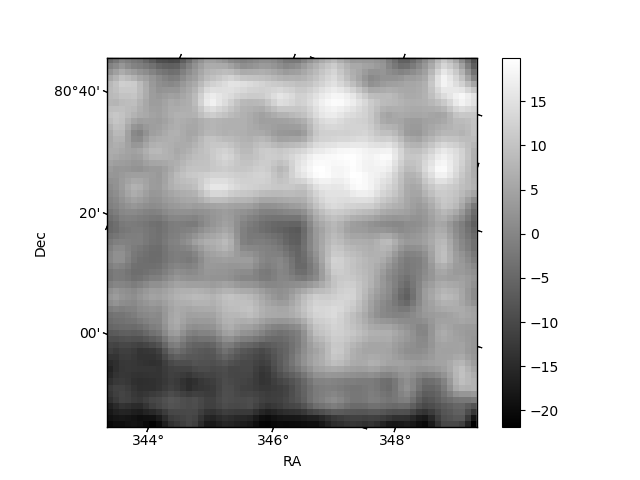
Histogram calculated using DETX and DETY for each event in the final _common_clean file
| Quadrant A | 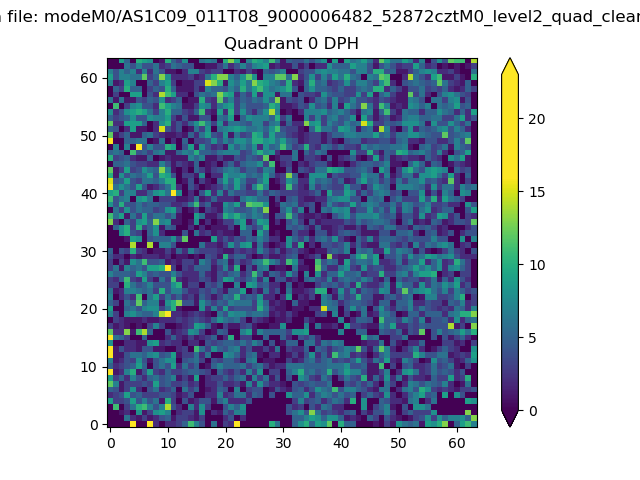 |
 |
Quadrant B |
|---|---|---|---|
| Quadrant D | 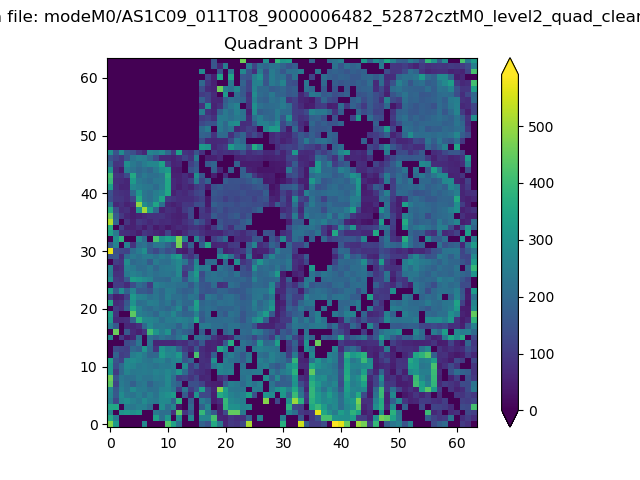 |
 |
Quadrant C |
| Plot type | Count rate plots | Images |
|---|---|---|
| Comparison with Poisson distribution Blue bars denote a histogram of data divided into 1 sec bins. Red curve is a Poisson curve with rate = median count rate of data. |
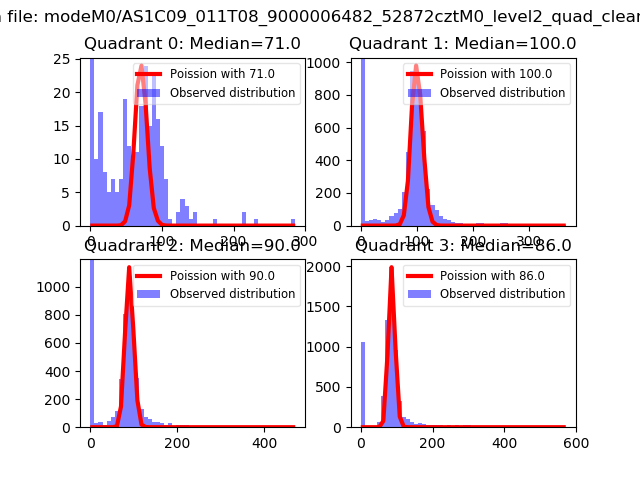 |
 |
| Quadrant-wise count rates Data is divided into 100 sec bins |
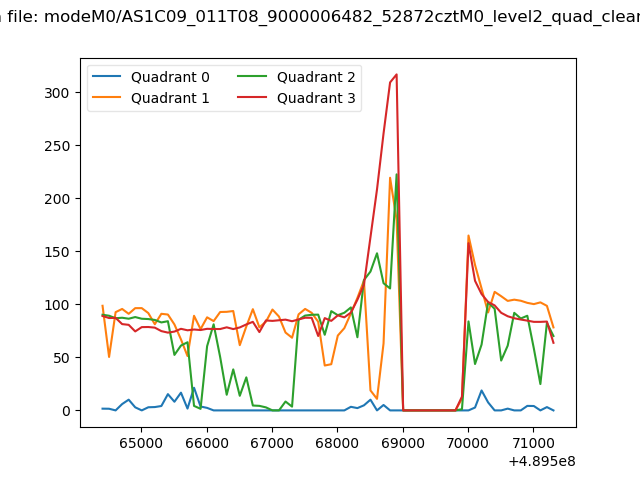 |
|
| Module-wise count rates for Quadrant A Data is divided into 100 sec bins |
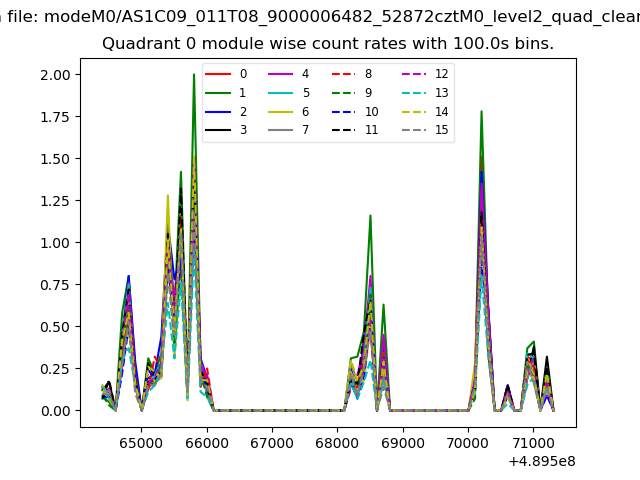 |
 |
| Module-wise count rates for Quadrant B Data is divided into 100 sec bins |
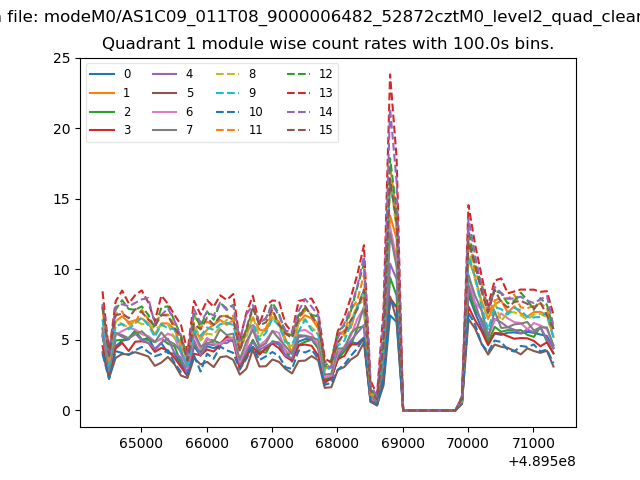 |
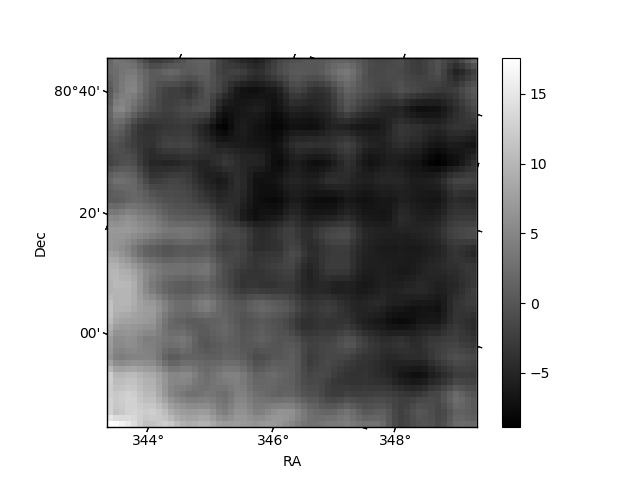 |
| Module-wise count rates for Quadrant C Data is divided into 100 sec bins |
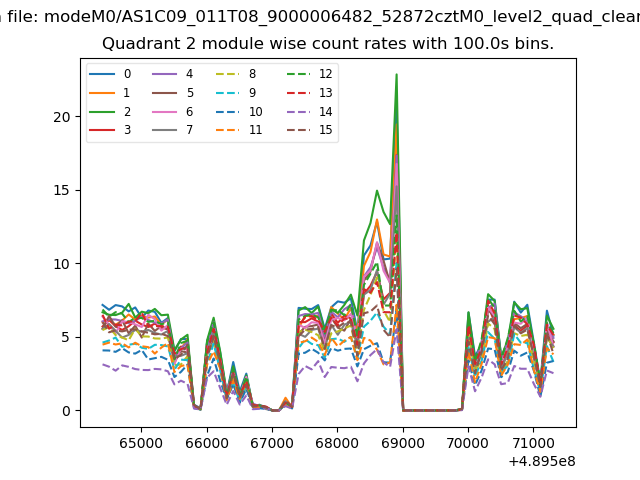 |
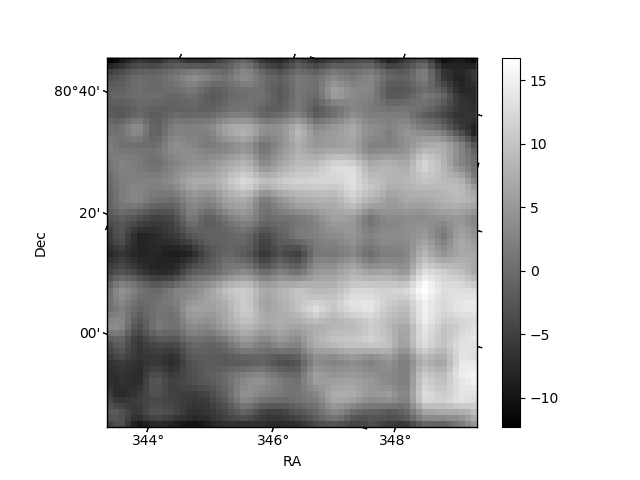 |
| Module-wise count rates for Quadrant D Data is divided into 100 sec bins |
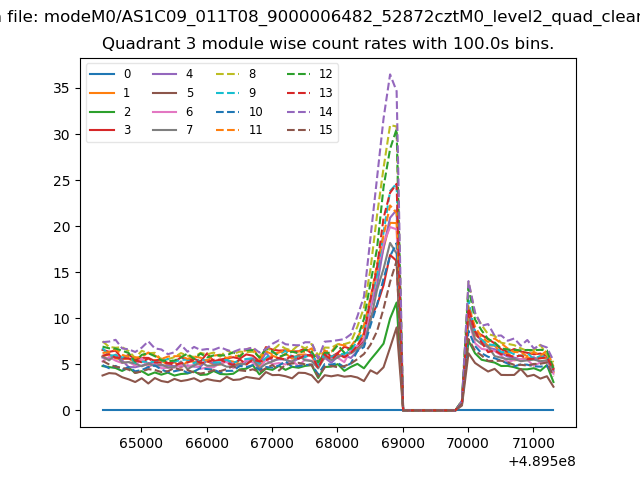 |
 |
| Parameter | Plot |
|---|---|
| CZT HV Monitor | 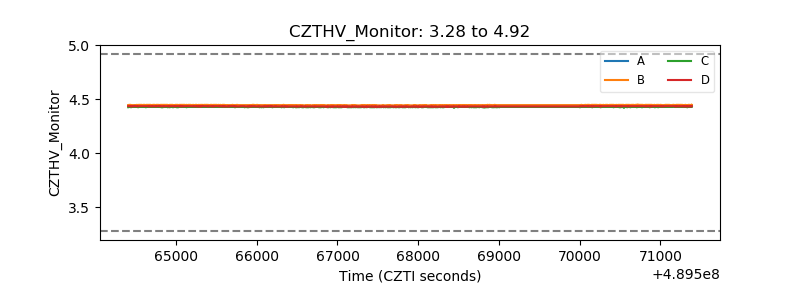 |
| D_VDD | 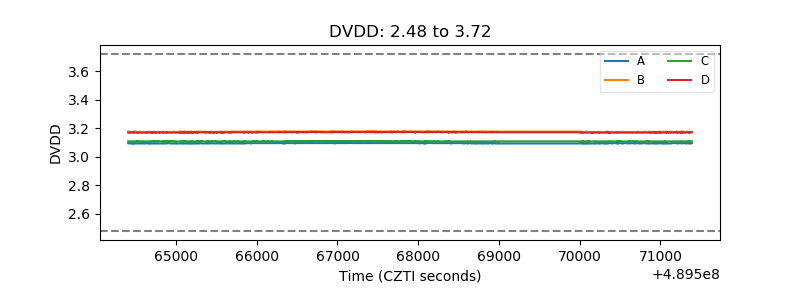 |
| Temperature 1 | 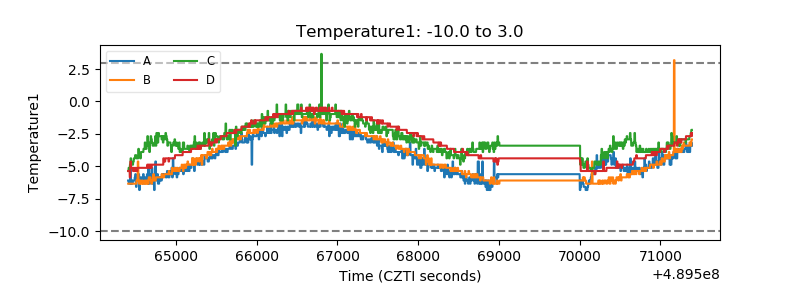 |
| Veto HV Monitor |  |
| Veto LLD | 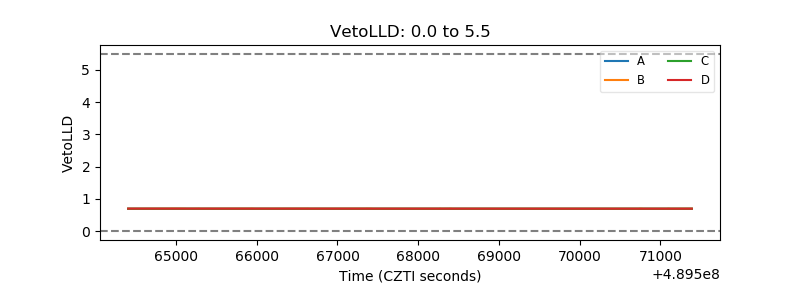 |
| Alpha Counter |  |
| _CPM_Rate | 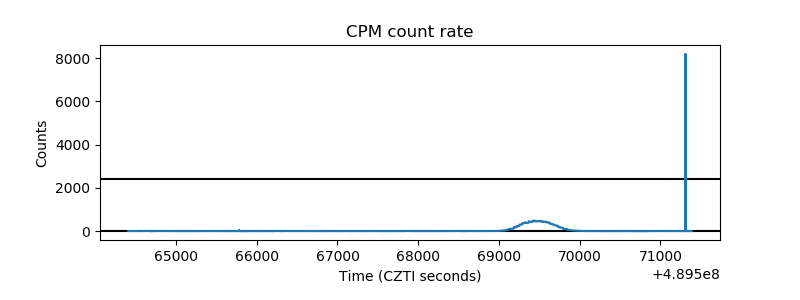 |
| CZT Counter | 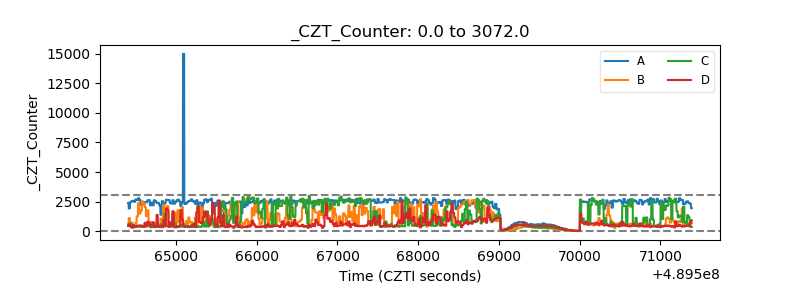 |
| +2.5 Volts monitor | 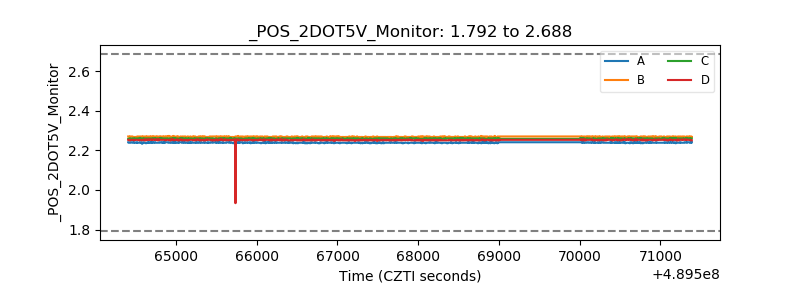 |
| +5 Volts monitor | 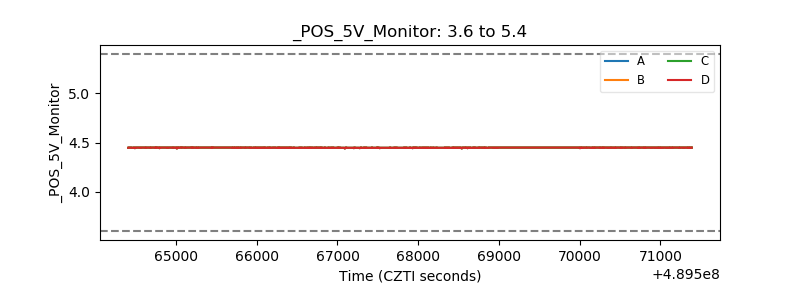 |
| _ROLL_ROT | 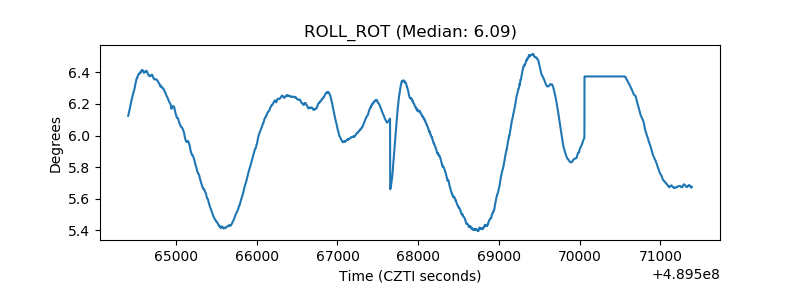 |
| _Roll_DEC | 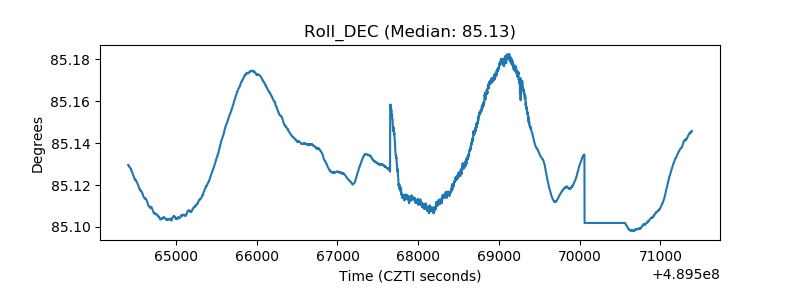 |
| _Roll_RA | 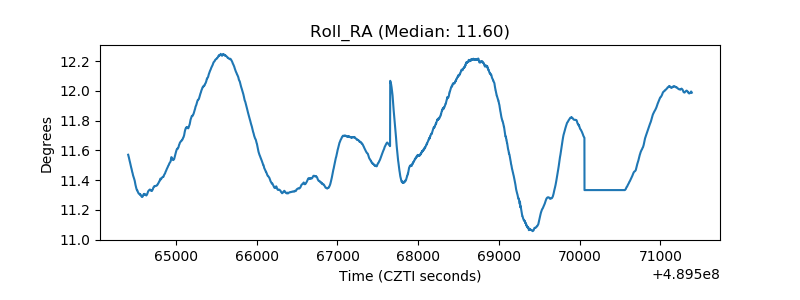 |
| Veto Counter | 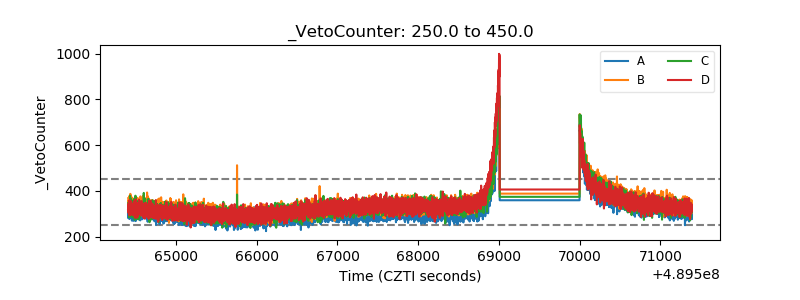 |