| Param | Original file | Final file |
|---|---|---|
| Filename | modeM0/AS1C09_011T08_9000006482_52873cztM0_level2.fits | modeM0/AS1C09_011T08_9000006482_52873cztM0_level2_quad_clean.evt |
| Size (bytes) | 912,669,120 | 62,400,960 |
| Size | 870.4 MB | 59.5 MB |
| Events in quadrant A | 14,470,122 | 27,887 |
| Events in quadrant B | 9,305,150 | 393,197 |
| Events in quadrant C | 4,642,607 | 528,969 |
| Events in quadrant D | 4,902,783 | 520,849 |
| Mode M0 | |||
|---|---|---|---|
| Quadrant | BADHDUFLAG | Total packets | Discarded packets |
| A | 0 | 47035 | 5 |
| B | 0 | 31760 | 1 |
| C | 0 | 18088 | 1 |
| D | 0 | 18724 | 1 |
| Mode M9 | |||
|---|---|---|---|
| Quadrant | BADHDUFLAG | Total packets | Discarded packets |
| A | 0 | 11 | 0 |
| B | 0 | 11 | 0 |
| C | 0 | 11 | 0 |
| D | 0 | 11 | 0 |
| Mode SS | |||
|---|---|---|---|
| Quadrant | BADHDUFLAG | Total packets | Discarded packets |
| A | 0 | 122 | 0 |
| B | 0 | 122 | 0 |
| C | 0 | 122 | 0 |
| D | 0 | 122 | 0 |
| Quadrant | Total seconds | Saturated seconds | Saturation percentage |
|---|---|---|---|
| A | 5987 | 5797 | 96.826457% |
| B | 5987 | 2554 | 42.659095% |
| C | 5987 | 474 | 7.917154% |
| D | 5988 | 366 | 6.112224% |
Noise dominated data is calculated using 1-second bins in cleaned event files. If a bin has >2000 counts, and if more than 50% of those come from <1% of pixels, then it is considered to be noise-dominated and hence unusable.
| Quadrant | # 1 sec bins | Bins with >0 counts | Bins with >2000 counts | High rate bins dominated by noise | Noise dominated (total time) | Noise dominated (detector-on time) | Marked lightcurve |
|---|---|---|---|---|---|---|---|
| A | 7087 | 5987 | 5381 | 5381 | 75.93% | 89.88% | 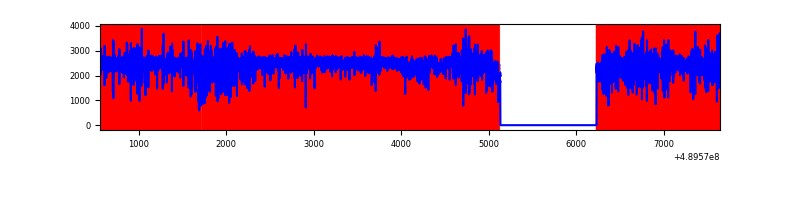 |
| B | 7087 | 5987 | 2048 | 2048 | 28.90% | 34.21% | 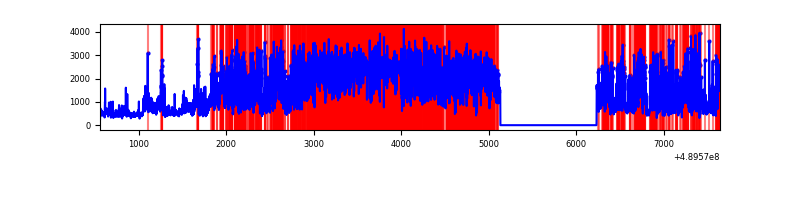 |
| C | 7087 | 5988 | 445 | 445 | 6.28% | 7.43% | 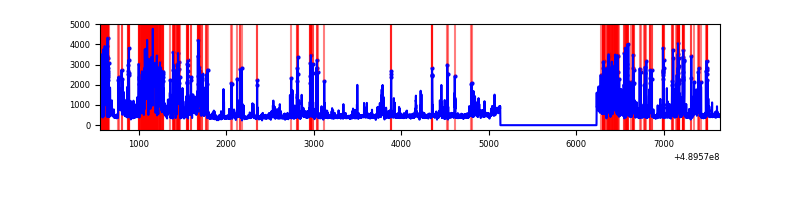 |
| D | 7088 | 5988 | 345 | 345 | 4.87% | 5.76% | 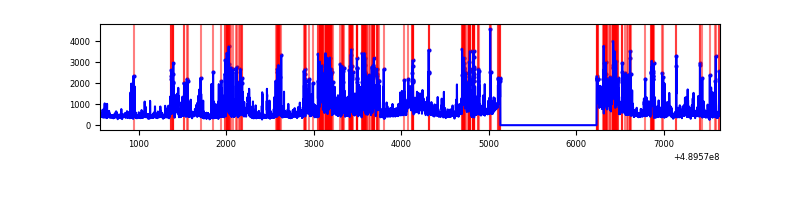 |
Top three noisy pixels from each quadrant. If the there are fewer than three noisy pixels in the level2.evt file, extra rows are filled as -1
| Pixel properties | Quadrant properties | ||||||
|---|---|---|---|---|---|---|---|
| Quadrant | DetID | PixID | Counts | Sigma | Mean | Median | Sigma |
| A | 9 | 191 | 13146358 | 186314.54 | 268 | 261 | 70.6 |
| A | 14 | 32 | 73848 | 1042.92 | 268 | 261 | 70.6 |
| A | 0 | 8 | 62700 | 884.92 | 268 | 261 | 70.6 |
| B | 8 | 3 | 6004583 | 53610.35 | 529 | 514 | 112.0 |
| B | 7 | 0 | 529855 | 4726.49 | 529 | 514 | 112.0 |
| B | 10 | 254 | 308158 | 2746.95 | 529 | 514 | 112.0 |
| C | 7 | 80 | 1077899 | 6577.32 | 592 | 586 | 163.8 |
| C | 2 | 12 | 364629 | 2222.59 | 592 | 586 | 163.8 |
| C | 13 | 3 | 310707 | 1893.38 | 592 | 586 | 163.8 |
| D | 15 | 125 | 723368 | 4166.81 | 604 | 577 | 173.5 |
| D | 8 | 48 | 638812 | 3679.35 | 604 | 577 | 173.5 |
| D | 3 | 224 | 252352 | 1451.46 | 604 | 577 | 173.5 |
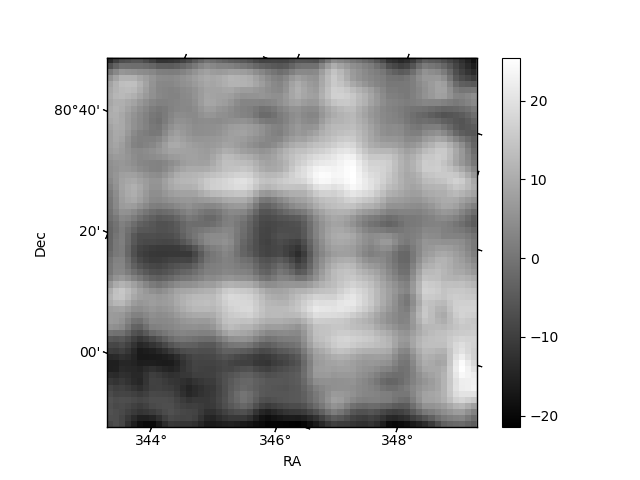
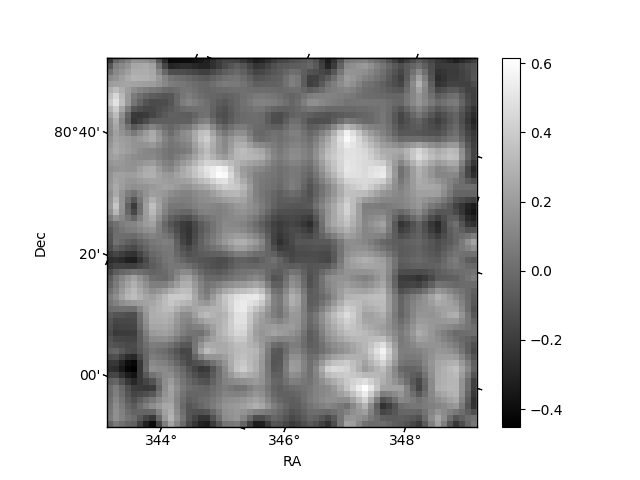
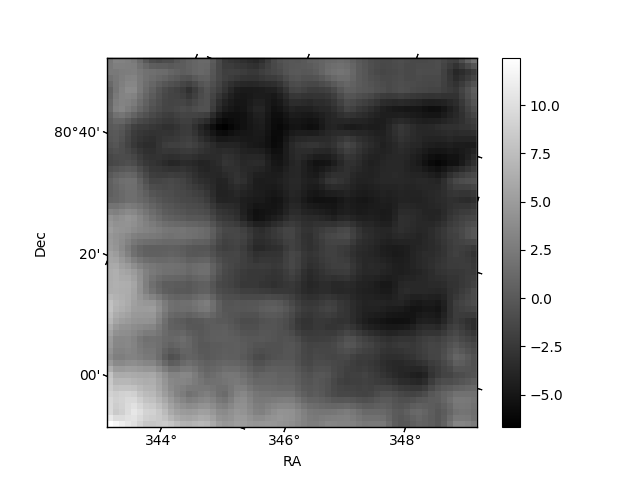
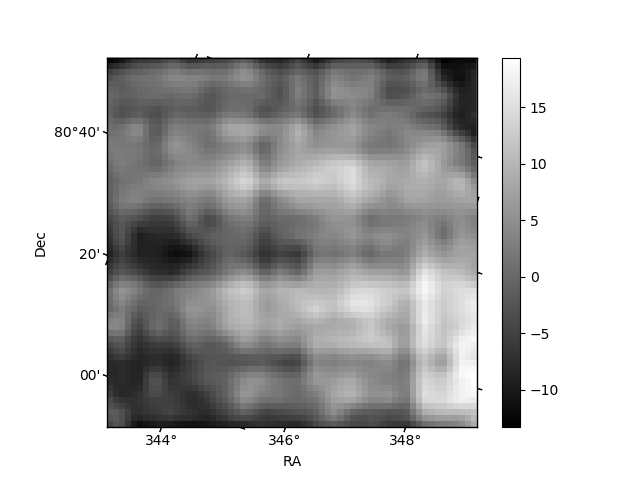
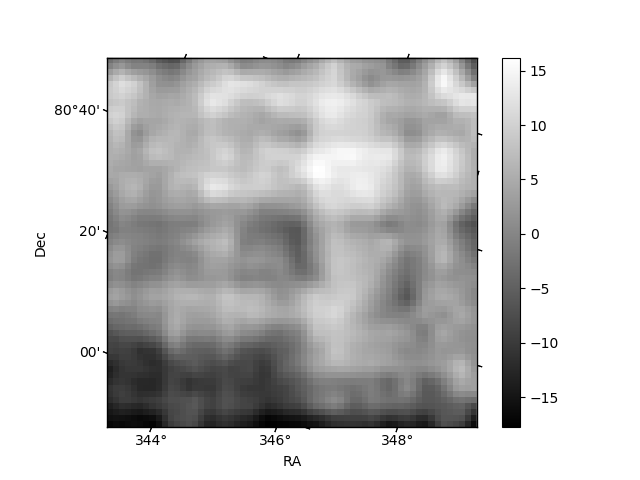
Histogram calculated using DETX and DETY for each event in the final _common_clean file
| Quadrant A | 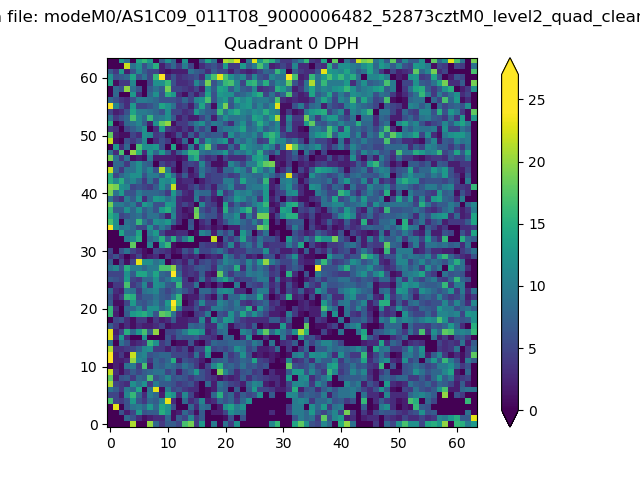 |
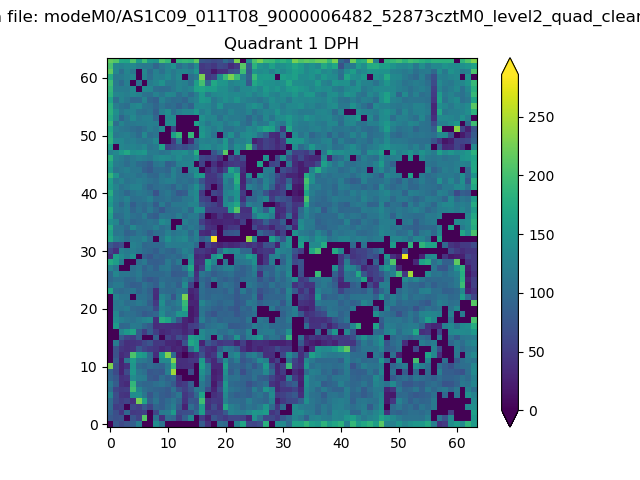 |
Quadrant B |
|---|---|---|---|
| Quadrant D | 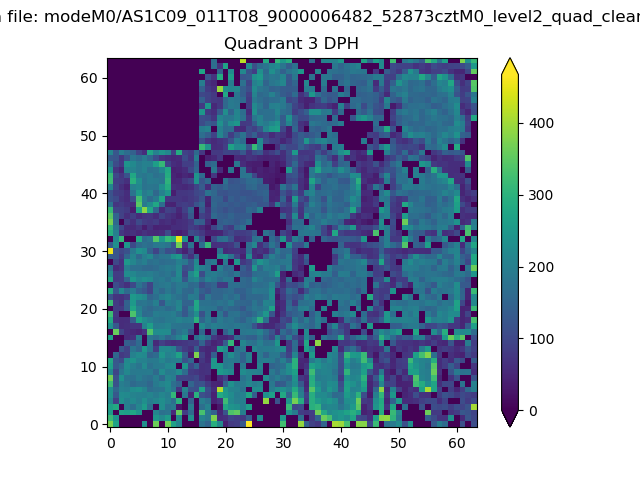 |
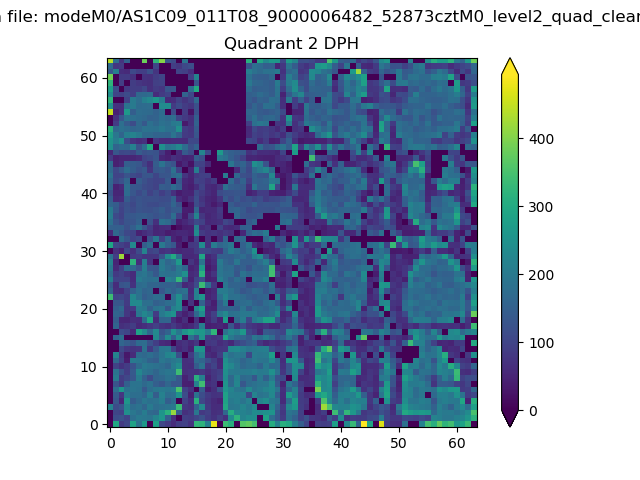 |
Quadrant C |
| Plot type | Count rate plots | Images |
|---|---|---|
| Comparison with Poisson distribution Blue bars denote a histogram of data divided into 1 sec bins. Red curve is a Poisson curve with rate = median count rate of data. |
 |
 |
| Quadrant-wise count rates Data is divided into 100 sec bins |
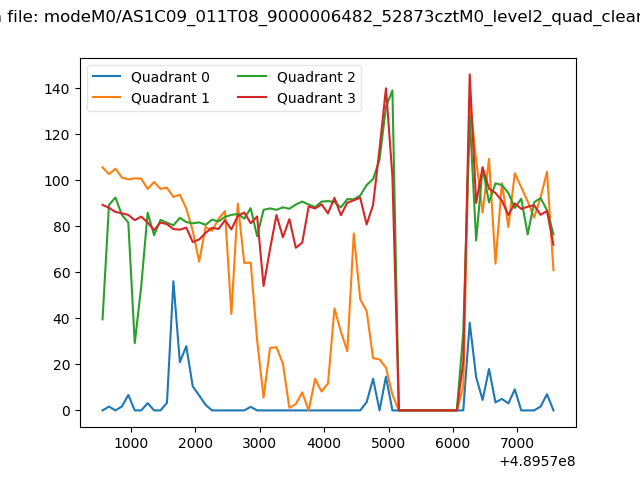 |
|
| Module-wise count rates for Quadrant A Data is divided into 100 sec bins |
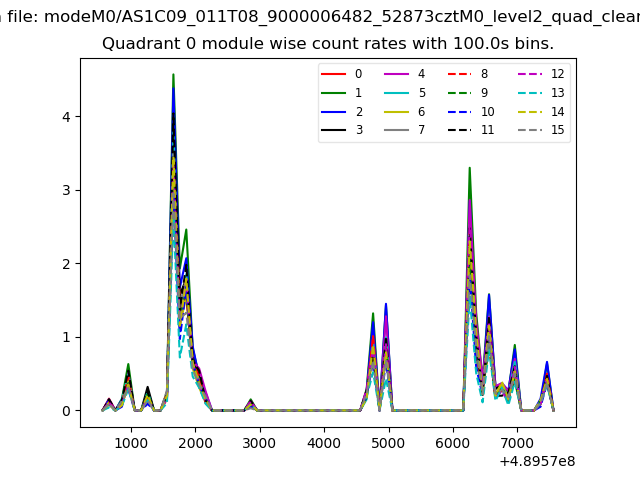 |
 |
| Module-wise count rates for Quadrant B Data is divided into 100 sec bins |
 |
 |
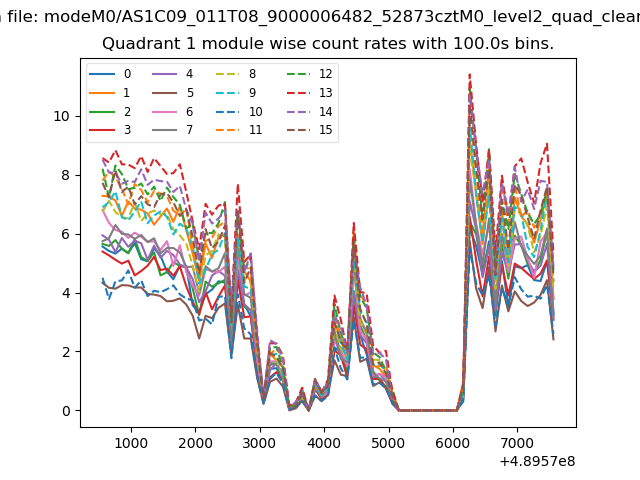
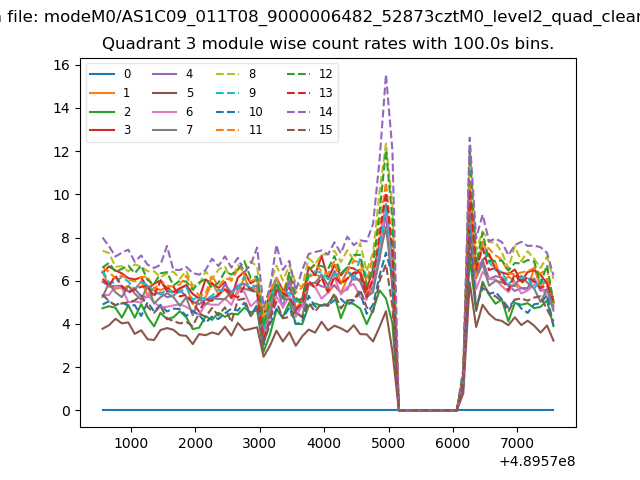
| Module-wise count rates for Quadrant C Data is divided into 100 sec bins |
 |
 |
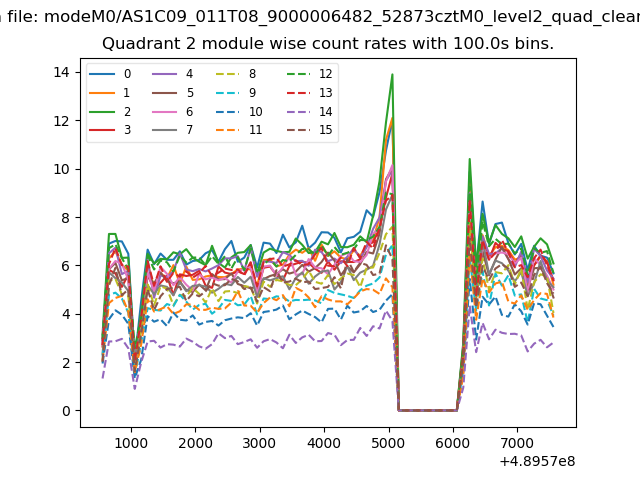
| Module-wise count rates for Quadrant D Data is divided into 100 sec bins |
 |
 |
| Parameter | Plot |
|---|---|
| CZT HV Monitor | 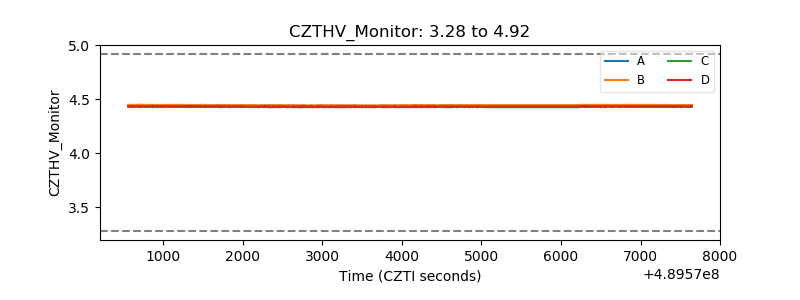 |
| D_VDD | 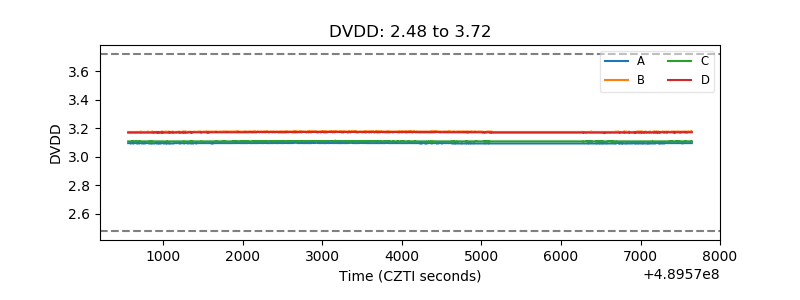 |
| Temperature 1 | 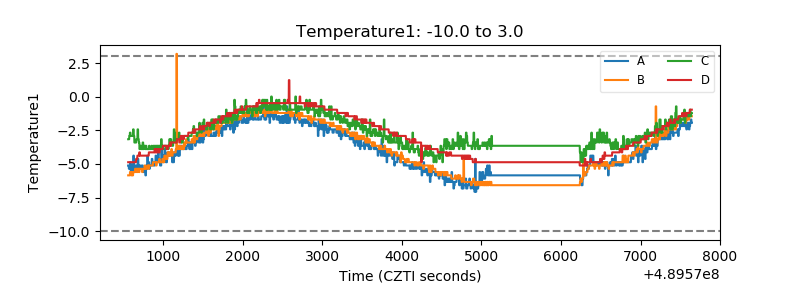 |
| Veto HV Monitor | 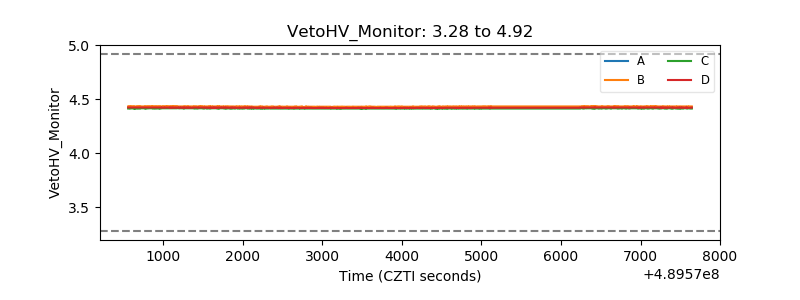 |
| Veto LLD | 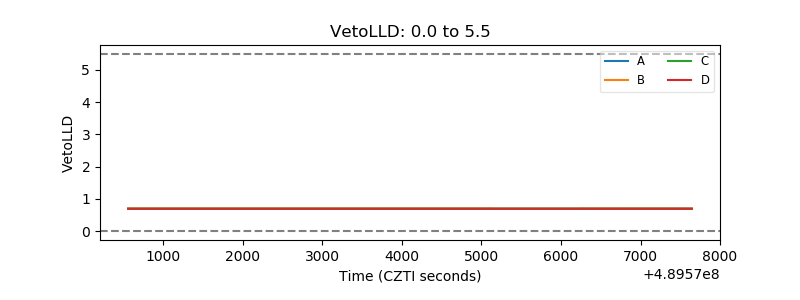 |
| Alpha Counter | 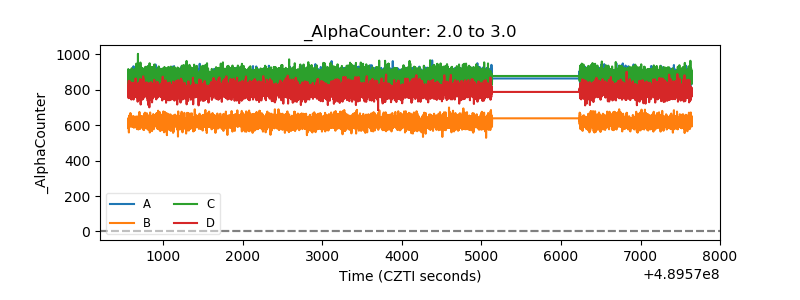 |
| _CPM_Rate |  |
| CZT Counter | 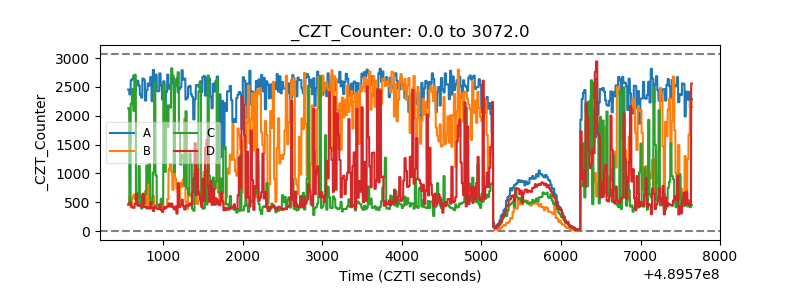 |
| +2.5 Volts monitor |  |
| +5 Volts monitor |  |
| _ROLL_ROT | 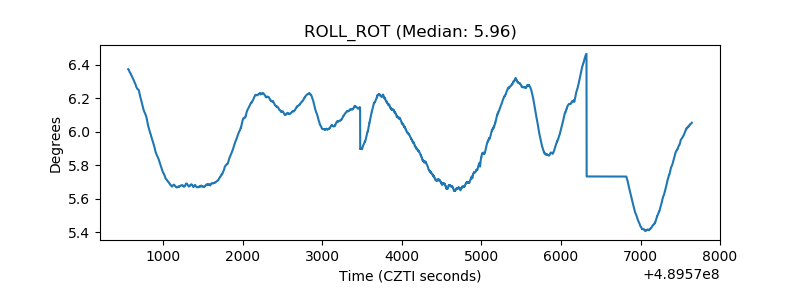 |
| _Roll_DEC | 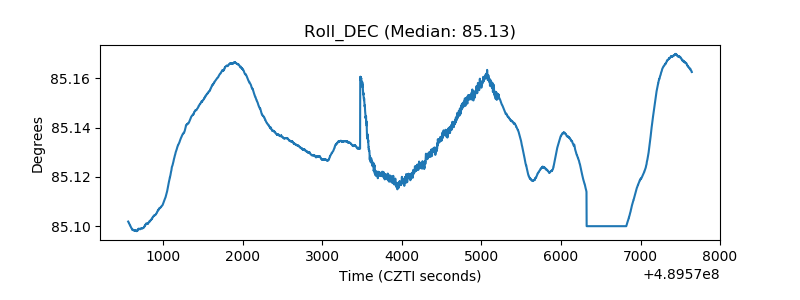 |
| _Roll_RA | 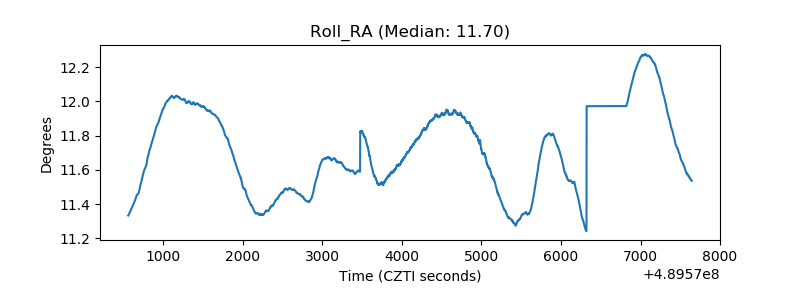 |
| Veto Counter | 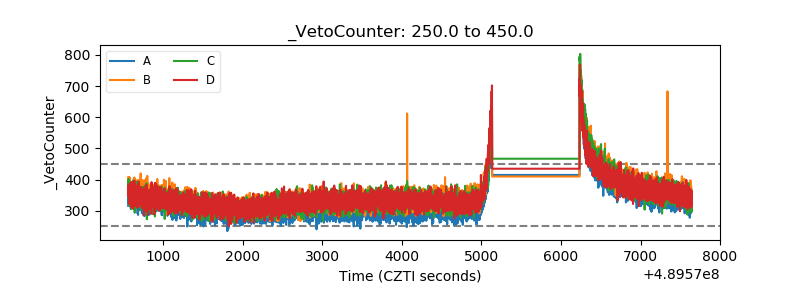 |