| Param | Original file | Final file |
|---|---|---|
| Filename | modeM0/AS1C09_011T08_9000006482_52874cztM0_level2.fits | modeM0/AS1C09_011T08_9000006482_52874cztM0_level2_quad_clean.evt |
| Size (bytes) | 869,788,800 | 63,123,840 |
| Size | 829.5 MB | 60.2 MB |
| Events in quadrant A | 14,182,503 | 13,446 |
| Events in quadrant B | 7,228,670 | 512,727 |
| Events in quadrant C | 5,895,625 | 464,761 |
| Events in quadrant D | 4,435,770 | 510,126 |
| Mode M0 | |||
|---|---|---|---|
| Quadrant | BADHDUFLAG | Total packets | Discarded packets |
| A | 0 | 45991 | 1 |
| B | 0 | 25485 | 1 |
| C | 0 | 21604 | 1 |
| D | 0 | 17186 | 2 |
| Mode M9 | |||
|---|---|---|---|
| Quadrant | BADHDUFLAG | Total packets | Discarded packets |
| A | 0 | 11 | 0 |
| B | 0 | 11 | 0 |
| C | 0 | 11 | 0 |
| D | 0 | 11 | 0 |
| Mode SS | |||
|---|---|---|---|
| Quadrant | BADHDUFLAG | Total packets | Discarded packets |
| A | 0 | 120 | 0 |
| B | 0 | 120 | 0 |
| C | 0 | 120 | 0 |
| D | 0 | 120 | 0 |
| Quadrant | Total seconds | Saturated seconds | Saturation percentage |
|---|---|---|---|
| A | 5863 | 5779 | 98.567286% |
| B | 5864 | 1376 | 23.465211% |
| C | 5864 | 1087 | 18.536835% |
| D | 5863 | 265 | 4.519870% |
Noise dominated data is calculated using 1-second bins in cleaned event files. If a bin has >2000 counts, and if more than 50% of those come from <1% of pixels, then it is considered to be noise-dominated and hence unusable.
| Quadrant | # 1 sec bins | Bins with >0 counts | Bins with >2000 counts | High rate bins dominated by noise | Noise dominated (total time) | Noise dominated (detector-on time) | Marked lightcurve |
|---|---|---|---|---|---|---|---|
| A | 7017 | 5862 | 5397 | 5397 | 76.91% | 92.07% | 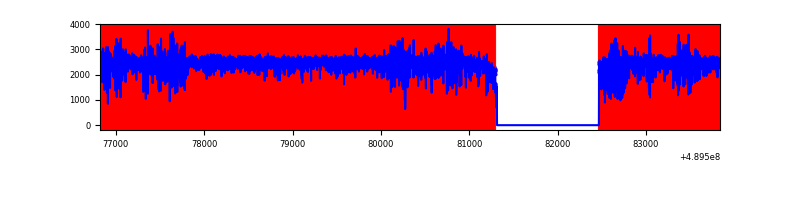 |
| B | 7019 | 5864 | 1061 | 1061 | 15.12% | 18.09% | 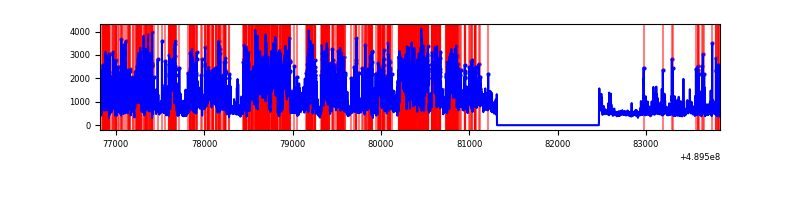 |
| C | 7019 | 5865 | 900 | 900 | 12.82% | 15.35% | 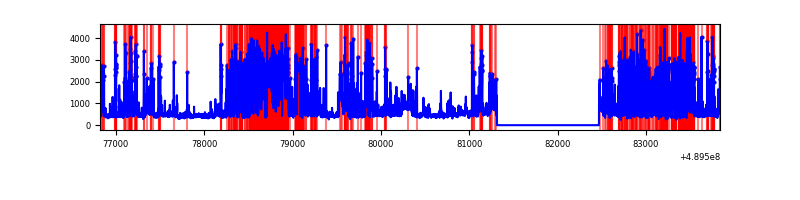 |
| D | 7018 | 5864 | 227 | 227 | 3.23% | 3.87% | 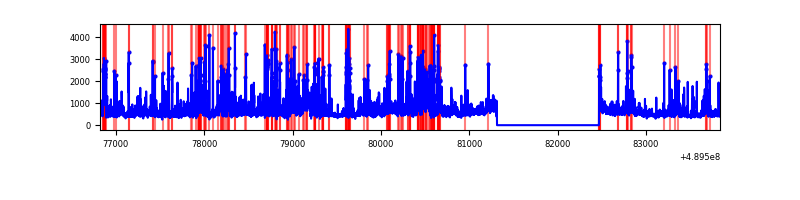 |
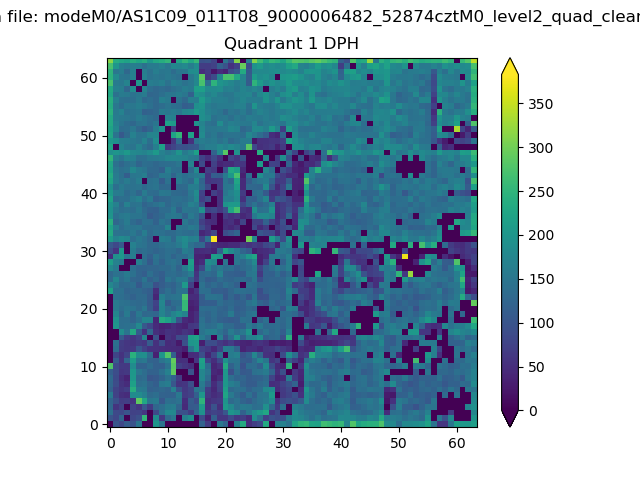
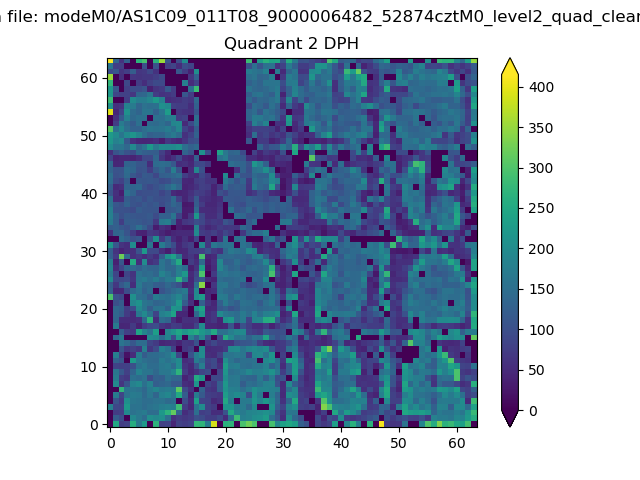
Top three noisy pixels from each quadrant. If the there are fewer than three noisy pixels in the level2.evt file, extra rows are filled as -1
| Pixel properties | Quadrant properties | ||||||
|---|---|---|---|---|---|---|---|
| Quadrant | DetID | PixID | Counts | Sigma | Mean | Median | Sigma |
| A | 9 | 191 | 12956012 | 205545.62 | 246 | 240 | 63.0 |
| A | 3 | 62 | 49359 | 779.28 | 246 | 240 | 63.0 |
| A | 0 | 8 | 48944 | 772.7 | 246 | 240 | 63.0 |
| B | 8 | 3 | 4065962 | 33413.05 | 575 | 556 | 121.7 |
| B | 7 | 0 | 162959 | 1334.77 | 575 | 556 | 121.7 |
| B | 5 | 185 | 158362 | 1296.99 | 575 | 556 | 121.7 |
| C | 2 | 12 | 1731901 | 11516.76 | 547 | 541 | 150.3 |
| C | 15 | 224 | 1062073 | 7061.16 | 547 | 541 | 150.3 |
| C | 7 | 80 | 399320 | 2652.62 | 547 | 541 | 150.3 |
| D | 8 | 176 | 767204 | 4478.72 | 600 | 574 | 171.2 |
| D | 12 | 191 | 379987 | 2216.56 | 600 | 574 | 171.2 |
| D | 8 | 48 | 329404 | 1921.05 | 600 | 574 | 171.2 |
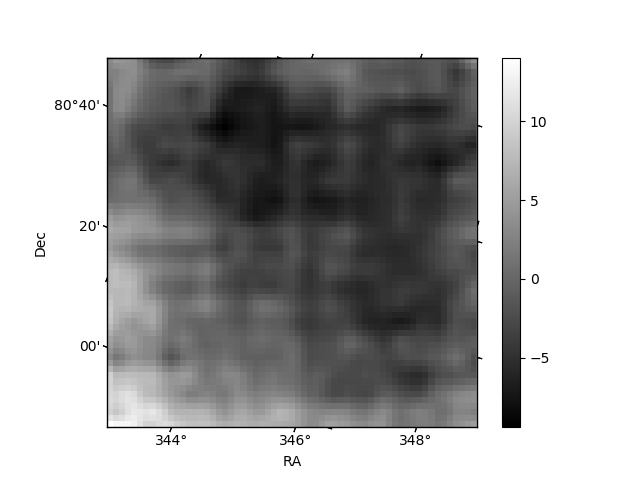
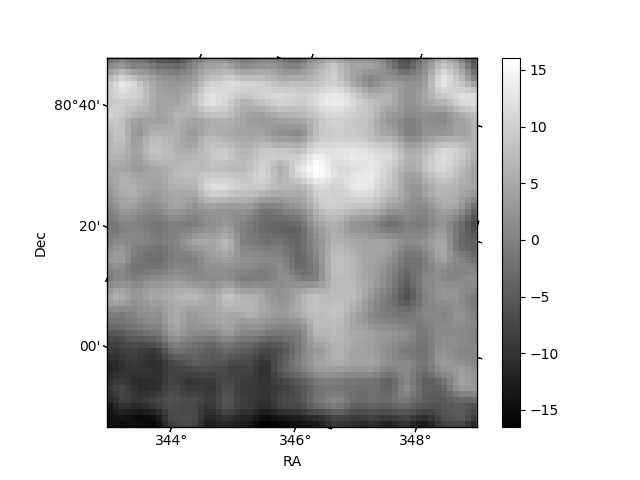
Histogram calculated using DETX and DETY for each event in the final _common_clean file
| Quadrant A | 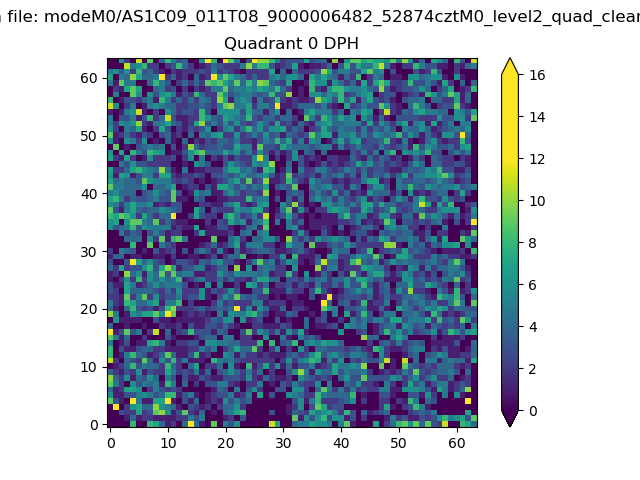 |
 |
Quadrant B |
|---|---|---|---|
| Quadrant D | 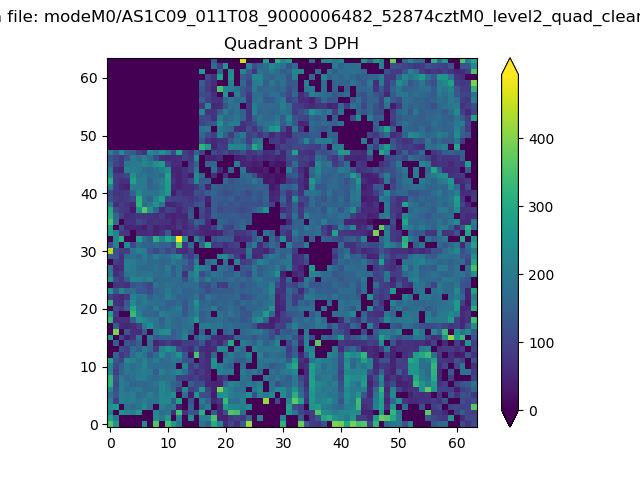 |
 |
Quadrant C |
| Plot type | Count rate plots | Images |
|---|---|---|
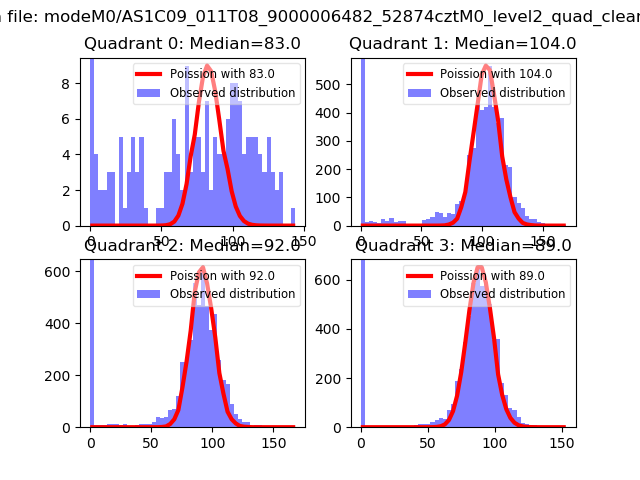
| Comparison with Poisson distribution Blue bars denote a histogram of data divided into 1 sec bins. Red curve is a Poisson curve with rate = median count rate of data. |
 |
 |
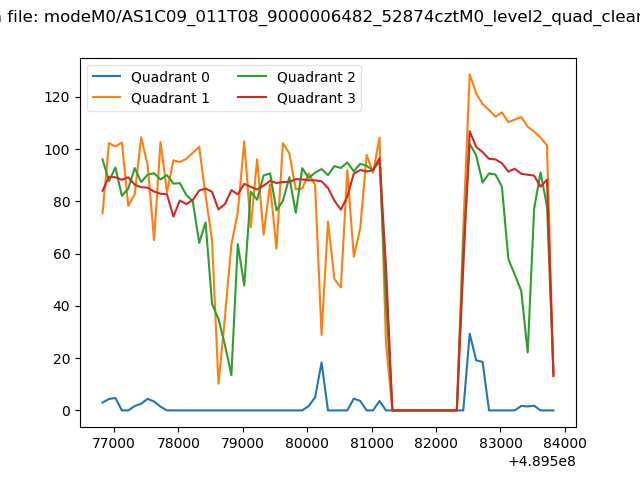
| Quadrant-wise count rates Data is divided into 100 sec bins |
 |
|
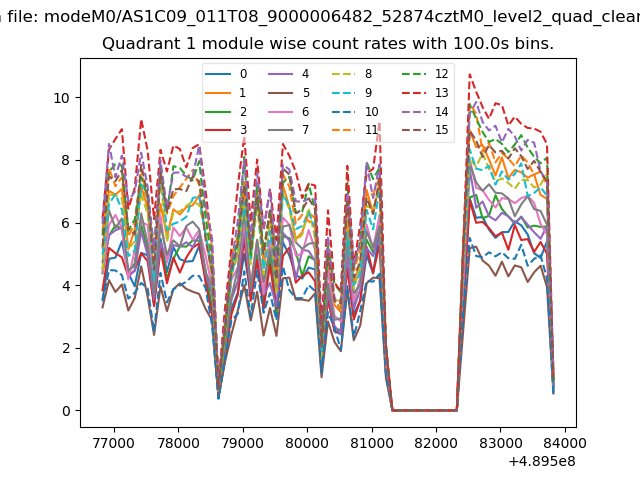
| Module-wise count rates for Quadrant A Data is divided into 100 sec bins |
 |
 |
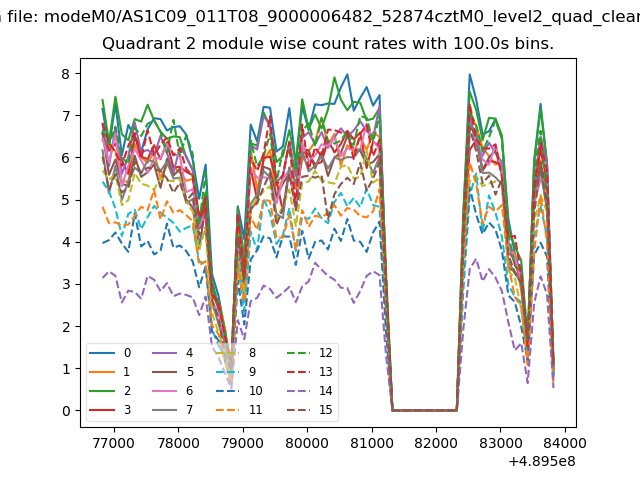
| Module-wise count rates for Quadrant B Data is divided into 100 sec bins |
 |
 |
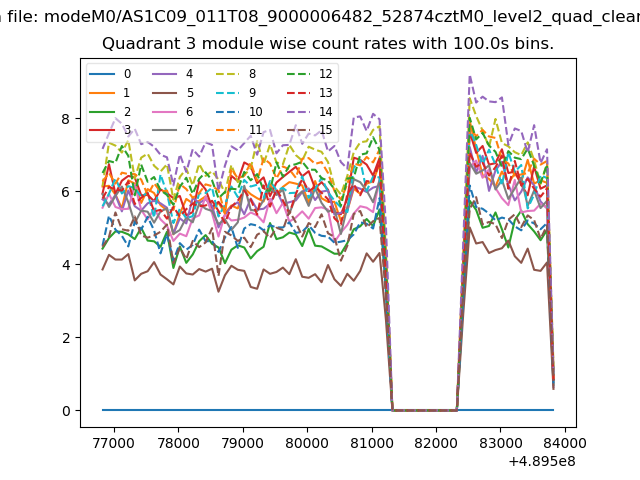
| Module-wise count rates for Quadrant C Data is divided into 100 sec bins |
 |
 |
| Module-wise count rates for Quadrant D Data is divided into 100 sec bins |
 |
 |
| Parameter | Plot |
|---|---|
| CZT HV Monitor | 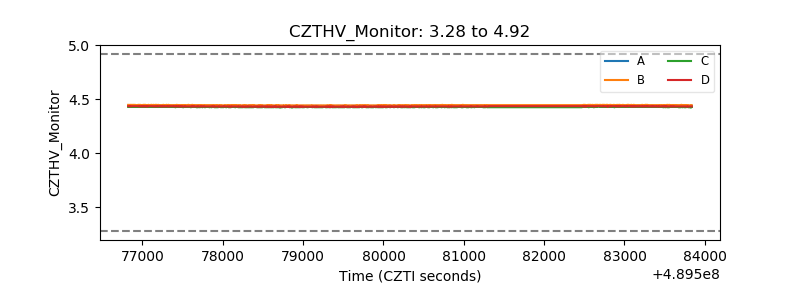 |
| D_VDD | 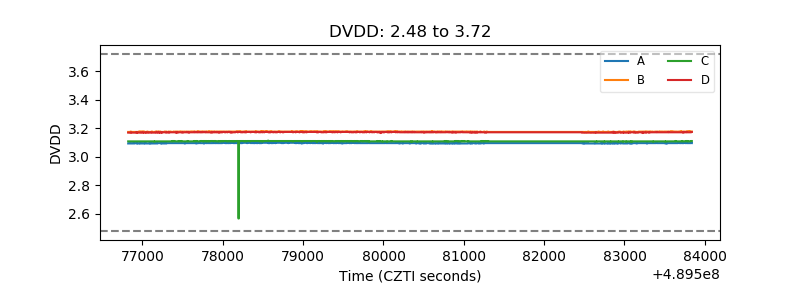 |
| Temperature 1 | 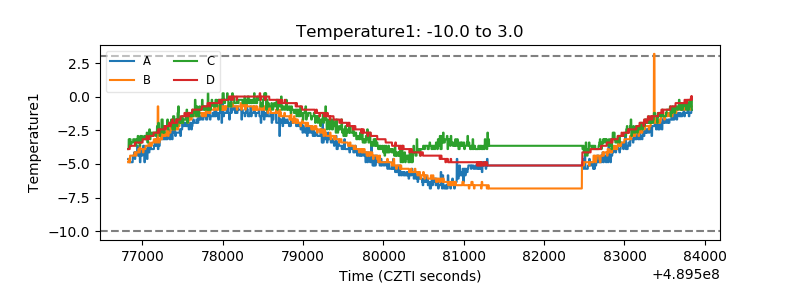 |
| Veto HV Monitor | 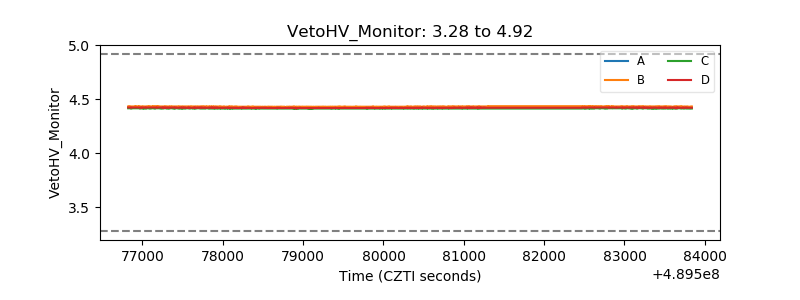 |
| Veto LLD | 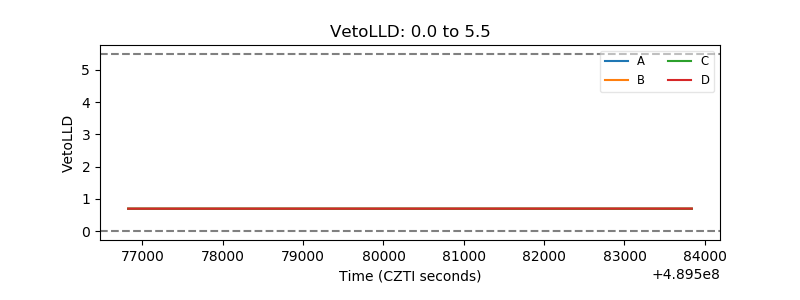 |
| Alpha Counter | 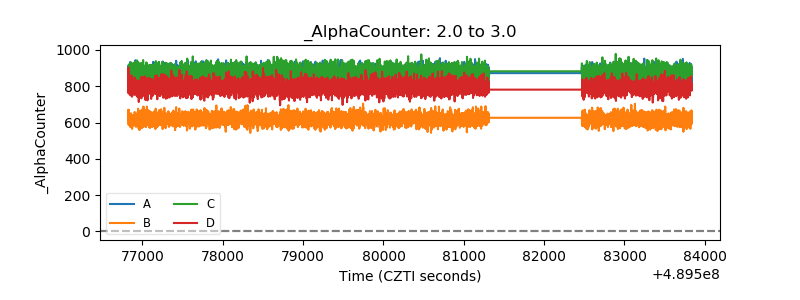 |
| _CPM_Rate | 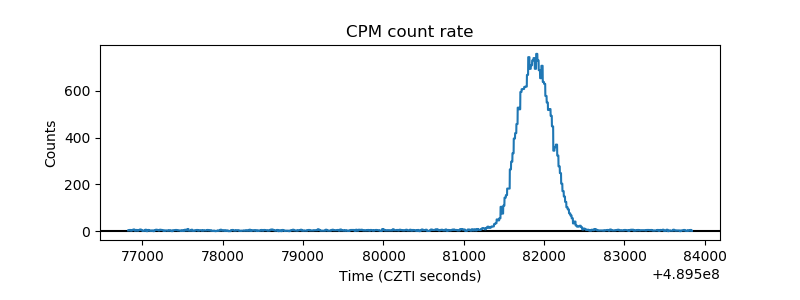 |
| CZT Counter | 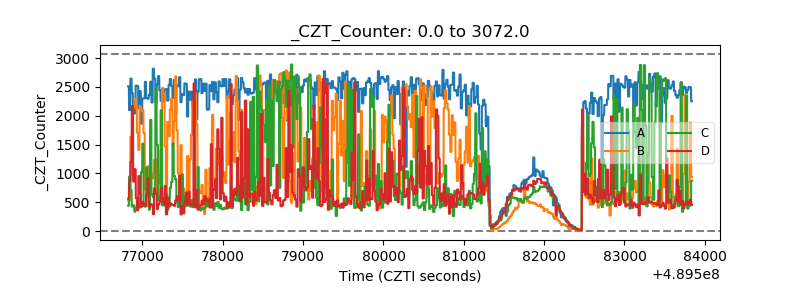 |
| +2.5 Volts monitor |  |
| +5 Volts monitor | 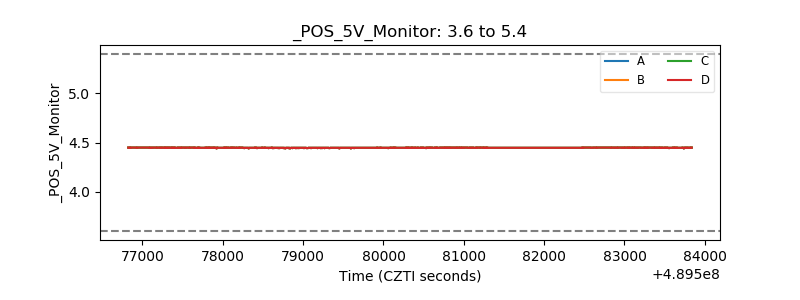 |
| _ROLL_ROT | 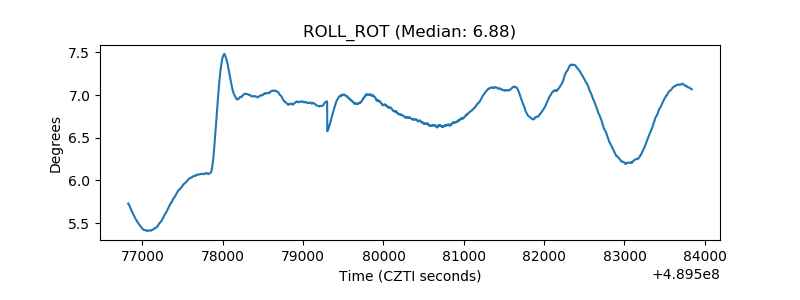 |
| _Roll_DEC | 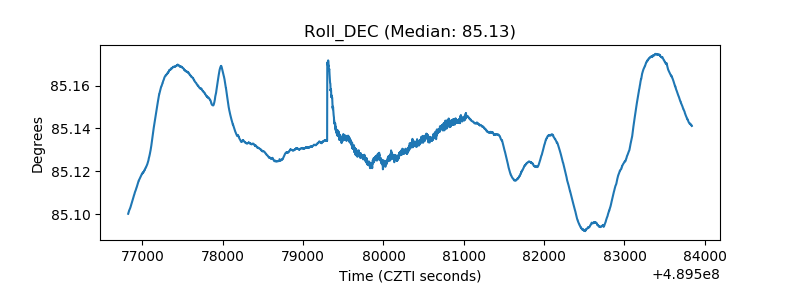 |
| _Roll_RA | 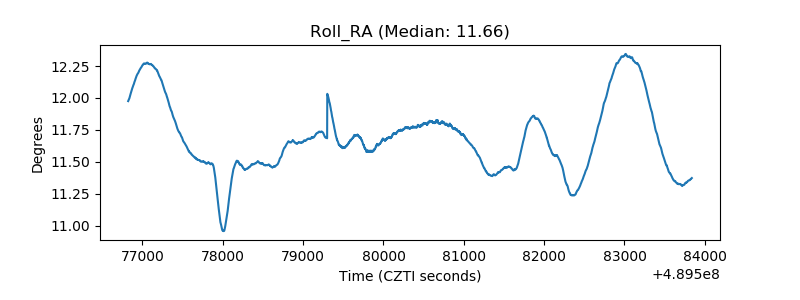 |
| Veto Counter | 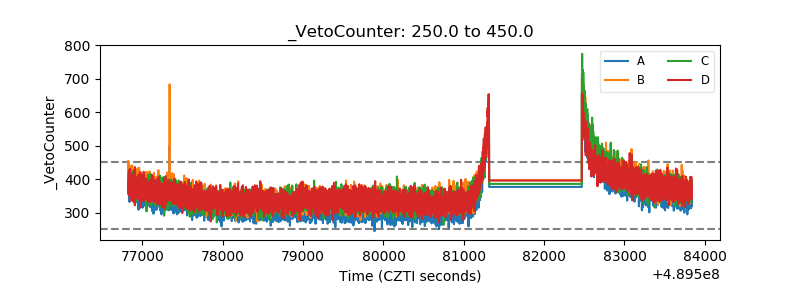 |