| Param | Original file | Final file |
|---|---|---|
| Filename | modeM0/AS1C09_011T08_9000006482_52875cztM0_level2.fits | modeM0/AS1C09_011T08_9000006482_52875cztM0_level2_quad_clean.evt |
| Size (bytes) | 1,027,146,240 | 68,074,560 |
| Size | 979.6 MB | 64.9 MB |
| Events in quadrant A | 15,566,693 | 42,976 |
| Events in quadrant B | 9,948,929 | 463,509 |
| Events in quadrant C | 7,085,353 | 516,932 |
| Events in quadrant D | 4,913,846 | 580,002 |
| Mode M0 | |||
|---|---|---|---|
| Quadrant | BADHDUFLAG | Total packets | Discarded packets |
| A | 0 | 50528 | 1 |
| B | 0 | 34046 | 1 |
| C | 0 | 25623 | 1 |
| D | 0 | 19052 | 1 |
| Mode M9 | |||
|---|---|---|---|
| Quadrant | BADHDUFLAG | Total packets | Discarded packets |
| A | 0 | 11 | 0 |
| B | 0 | 11 | 0 |
| C | 0 | 11 | 0 |
| D | 0 | 11 | 0 |
| Mode SS | |||
|---|---|---|---|
| Quadrant | BADHDUFLAG | Total packets | Discarded packets |
| A | 0 | 134 | 0 |
| B | 0 | 134 | 0 |
| C | 0 | 134 | 0 |
| D | 0 | 134 | 0 |
| Quadrant | Total seconds | Saturated seconds | Saturation percentage |
|---|---|---|---|
| A | 6556 | 6206 | 94.661379% |
| B | 6556 | 2611 | 39.826113% |
| C | 6555 | 1303 | 19.877956% |
| D | 6555 | 313 | 4.774981% |
Noise dominated data is calculated using 1-second bins in cleaned event files. If a bin has >2000 counts, and if more than 50% of those come from <1% of pixels, then it is considered to be noise-dominated and hence unusable.
| Quadrant | # 1 sec bins | Bins with >0 counts | Bins with >2000 counts | High rate bins dominated by noise | Noise dominated (total time) | Noise dominated (detector-on time) | Marked lightcurve |
|---|---|---|---|---|---|---|---|
| A | 7700 | 6555 | 5837 | 5837 | 75.81% | 89.05% | 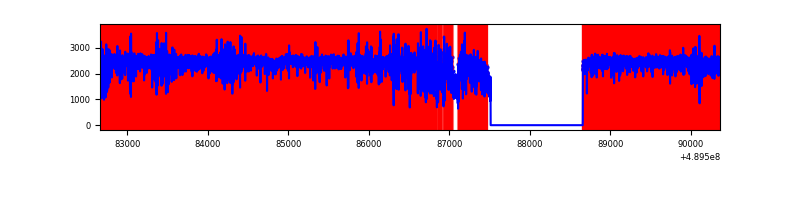 |
| B | 7701 | 6557 | 2127 | 2127 | 27.62% | 32.44% | 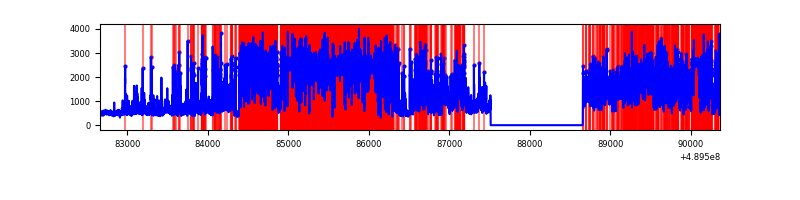 |
| C | 7699 | 6554 | 1095 | 1095 | 14.22% | 16.71% | 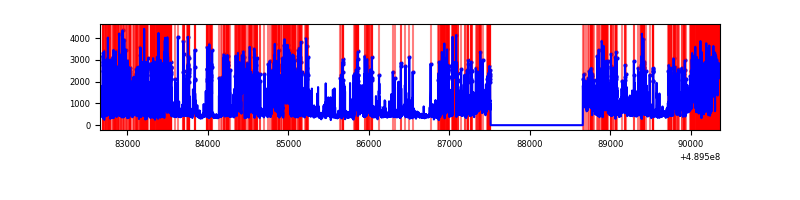 |
| D | 7700 | 6556 | 243 | 243 | 3.16% | 3.71% | 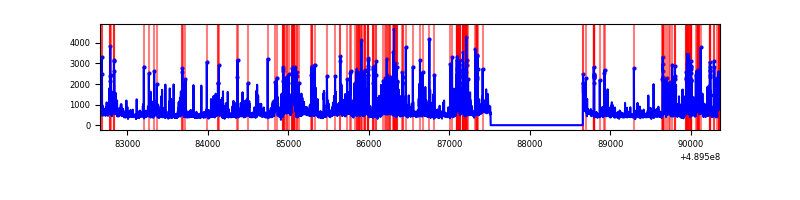 |
Top three noisy pixels from each quadrant. If the there are fewer than three noisy pixels in the level2.evt file, extra rows are filled as -1
| Pixel properties | Quadrant properties | ||||||
|---|---|---|---|---|---|---|---|
| Quadrant | DetID | PixID | Counts | Sigma | Mean | Median | Sigma |
| A | 9 | 191 | 14018465 | 178204.74 | 306 | 297 | 78.7 |
| A | 0 | 8 | 76512 | 968.88 | 306 | 297 | 78.7 |
| A | 15 | 174 | 70669 | 894.6 | 306 | 297 | 78.7 |
| B | 8 | 3 | 6836348 | 54408.62 | 599 | 581 | 125.6 |
| B | 5 | 185 | 171175 | 1357.83 | 599 | 581 | 125.6 |
| B | 4 | 81 | 120723 | 956.26 | 599 | 581 | 125.6 |
| C | 2 | 12 | 1961122 | 11454.23 | 615 | 608 | 171.2 |
| C | 7 | 80 | 854138 | 4986.72 | 615 | 608 | 171.2 |
| C | 15 | 224 | 703065 | 4104.08 | 615 | 608 | 171.2 |
| D | 8 | 176 | 528754 | 2711.08 | 682 | 651 | 194.8 |
| D | 2 | 249 | 394228 | 2020.48 | 682 | 651 | 194.8 |
| D | 2 | 153 | 207169 | 1060.19 | 682 | 651 | 194.8 |
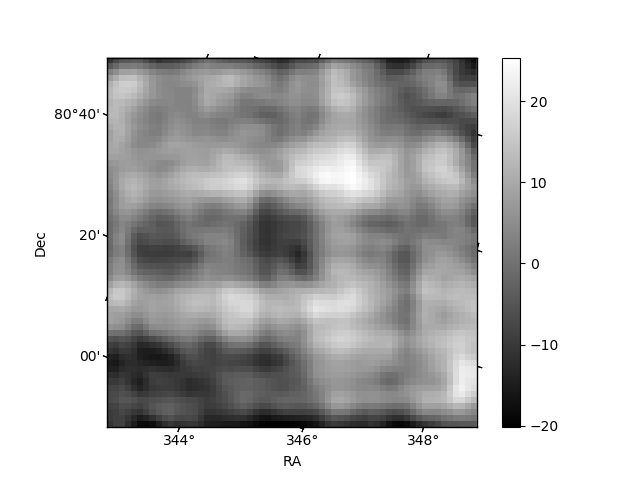
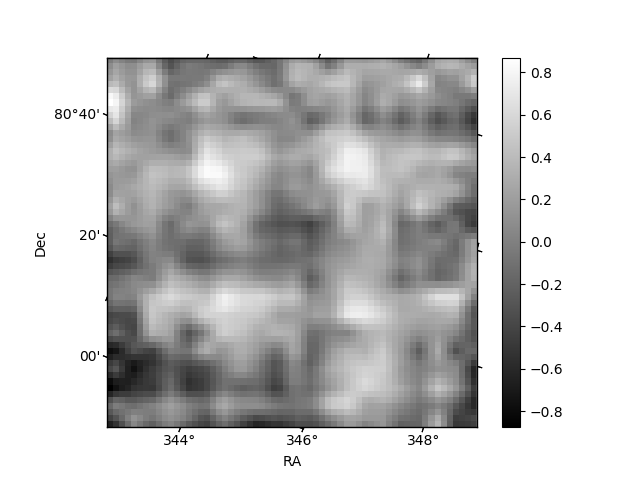
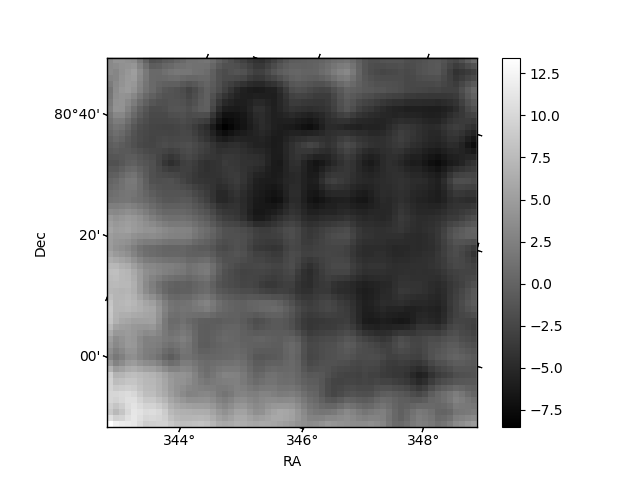
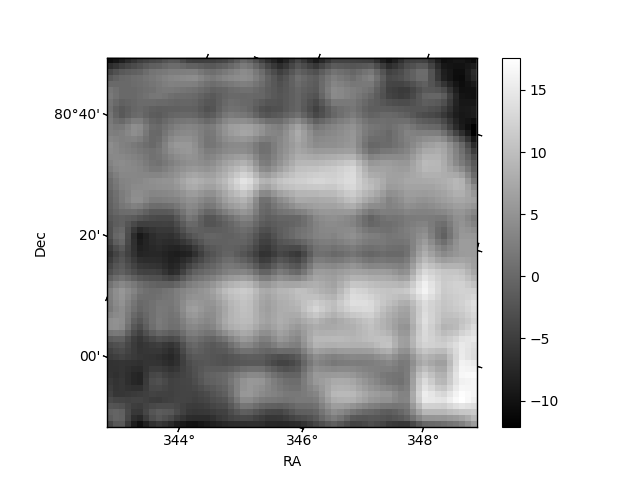
Histogram calculated using DETX and DETY for each event in the final _common_clean file
| Quadrant A | 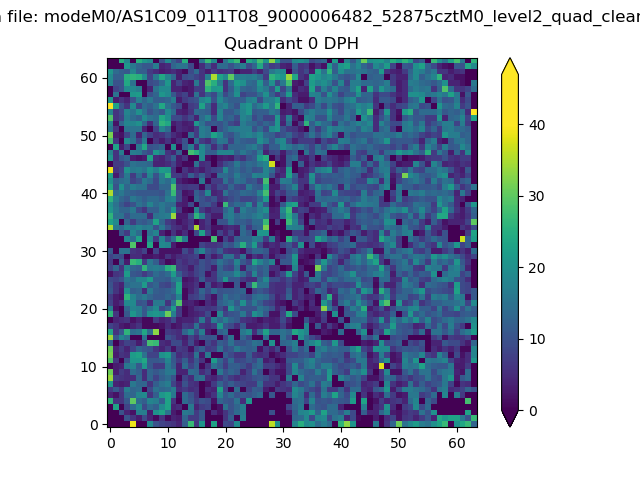 |
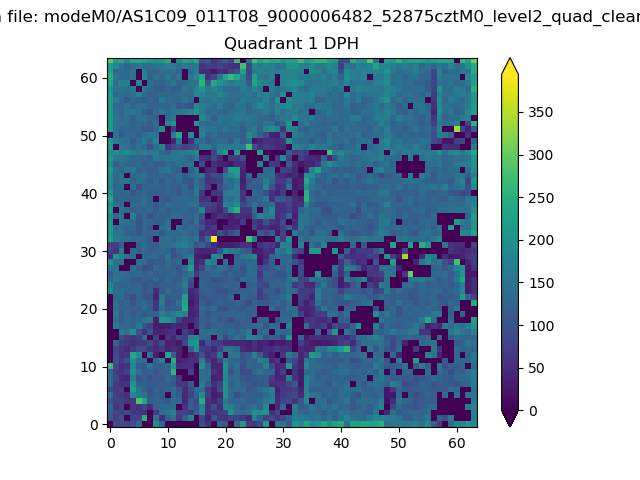 |
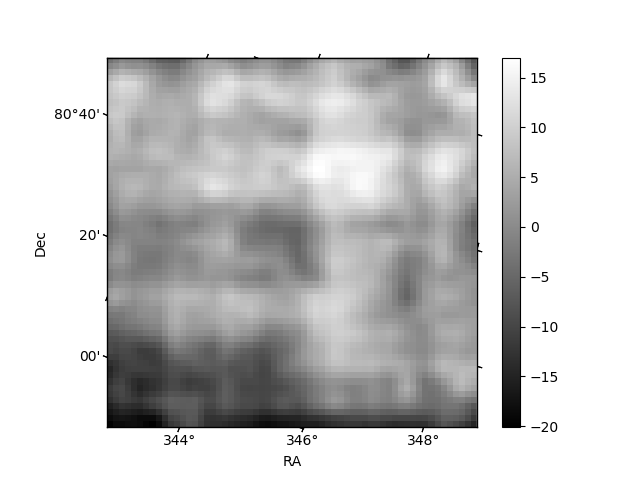
Quadrant B |
|---|---|---|---|
| Quadrant D | 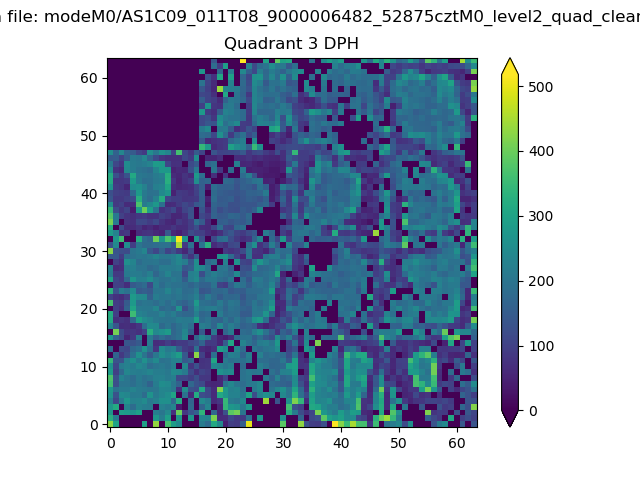 |
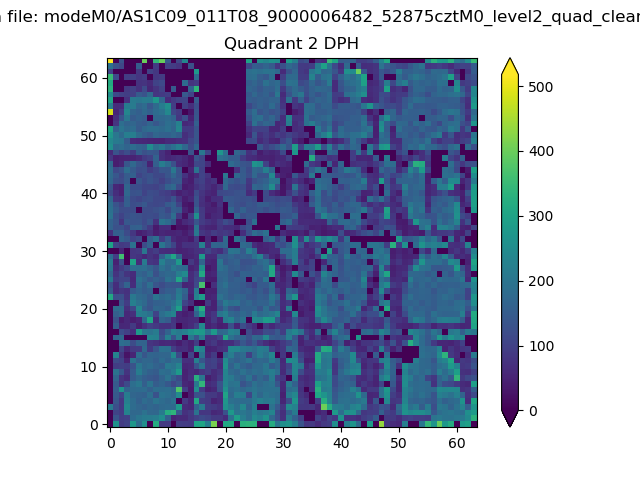 |
Quadrant C |
| Plot type | Count rate plots | Images |
|---|---|---|
| Comparison with Poisson distribution Blue bars denote a histogram of data divided into 1 sec bins. Red curve is a Poisson curve with rate = median count rate of data. |
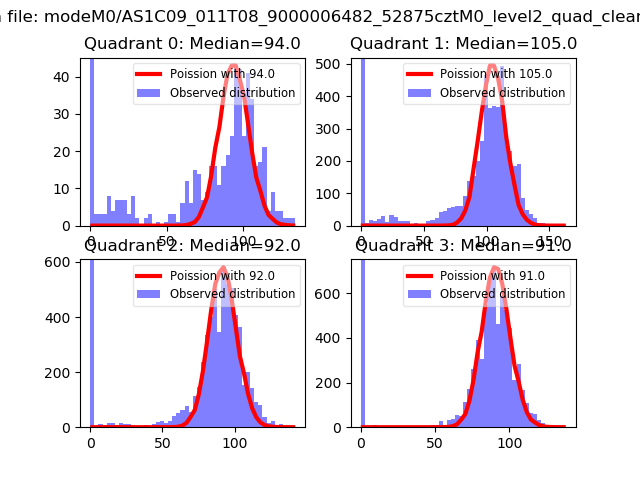 |
 |
| Quadrant-wise count rates Data is divided into 100 sec bins |
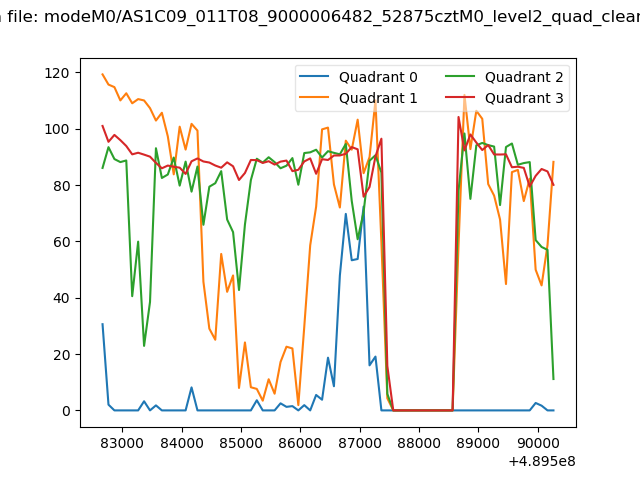 |
|
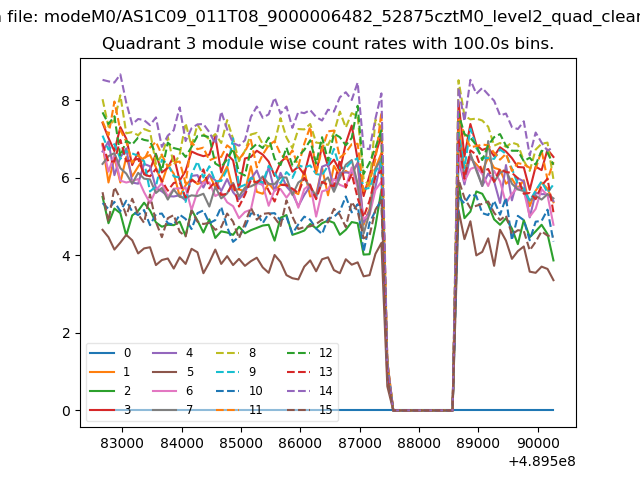
| Module-wise count rates for Quadrant A Data is divided into 100 sec bins |
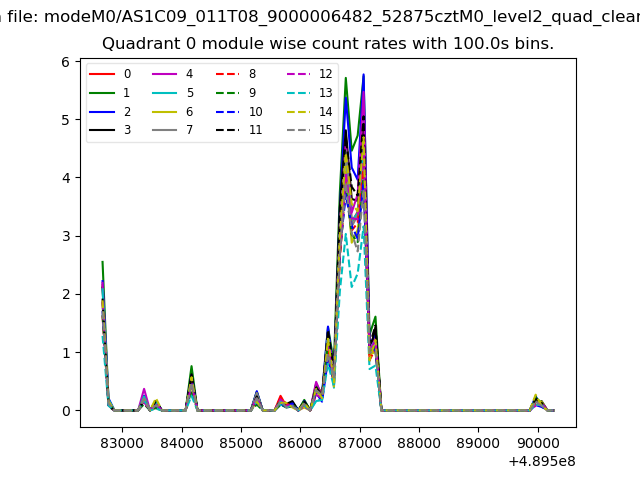 |
 |
| Module-wise count rates for Quadrant B Data is divided into 100 sec bins |
 |
 |
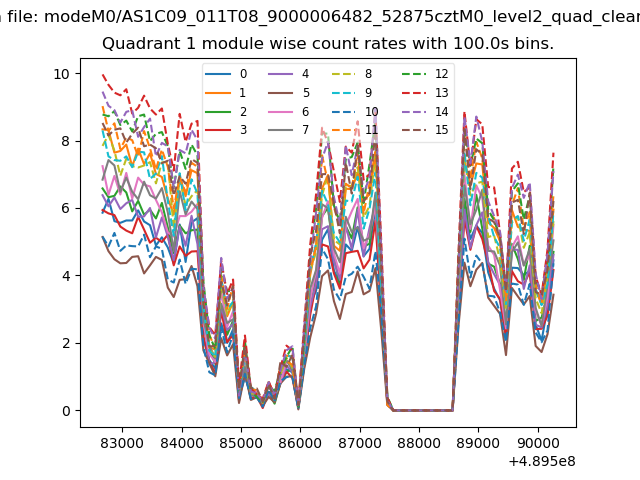
| Module-wise count rates for Quadrant C Data is divided into 100 sec bins |
 |
 |
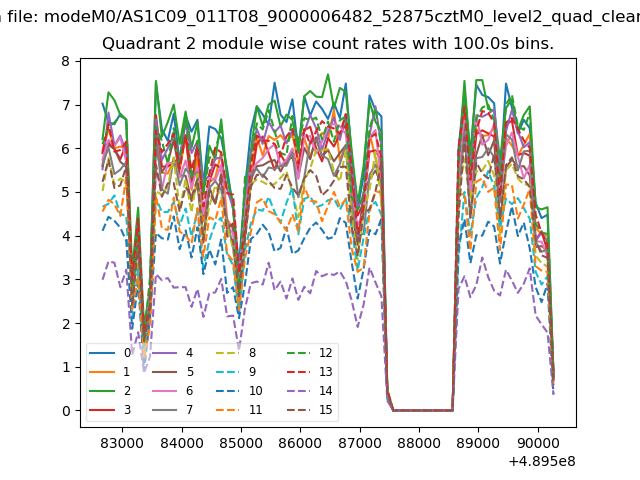
| Module-wise count rates for Quadrant D Data is divided into 100 sec bins |
 |
 |
| Parameter | Plot |
|---|---|
| CZT HV Monitor | 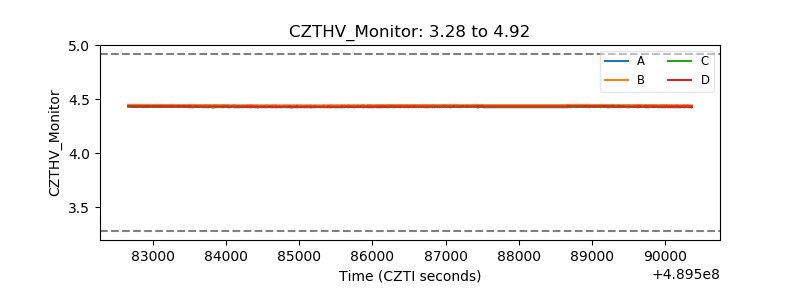 |
| D_VDD | 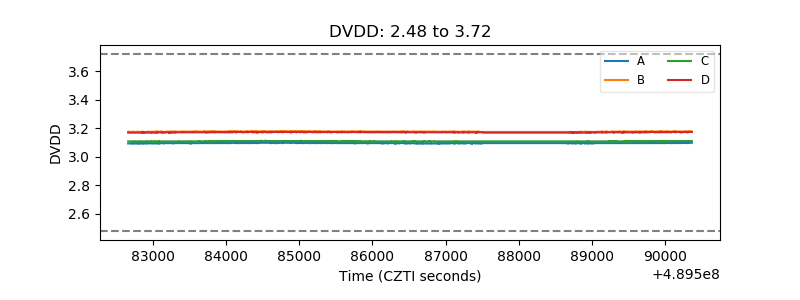 |
| Temperature 1 | 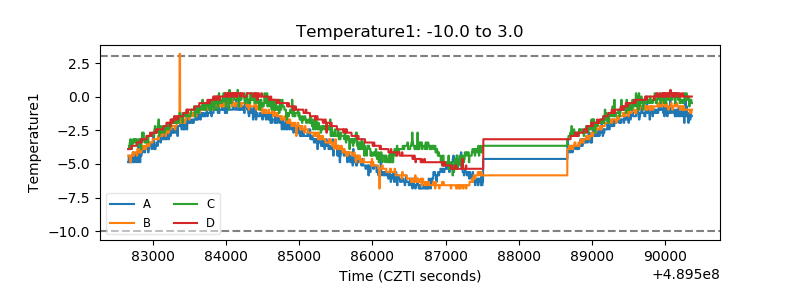 |
| Veto HV Monitor | 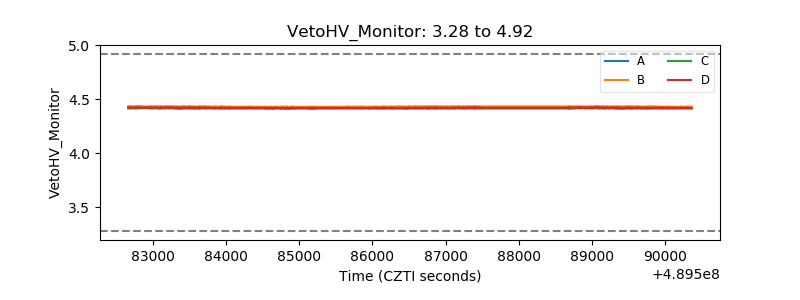 |
| Veto LLD | 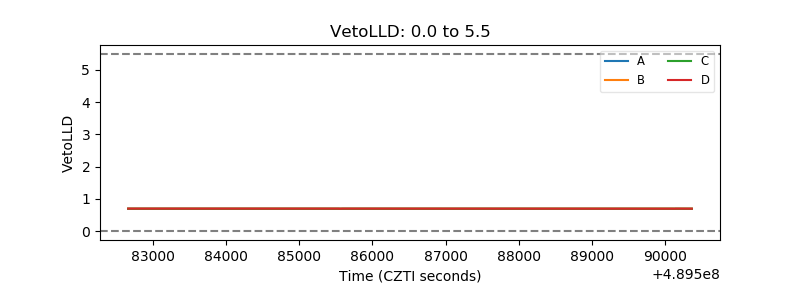 |
| Alpha Counter | 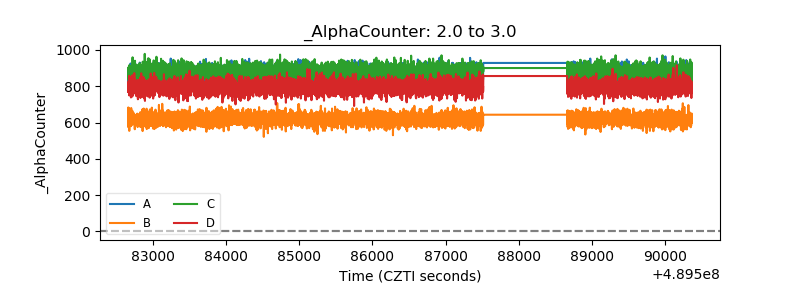 |
| _CPM_Rate |  |
| CZT Counter | 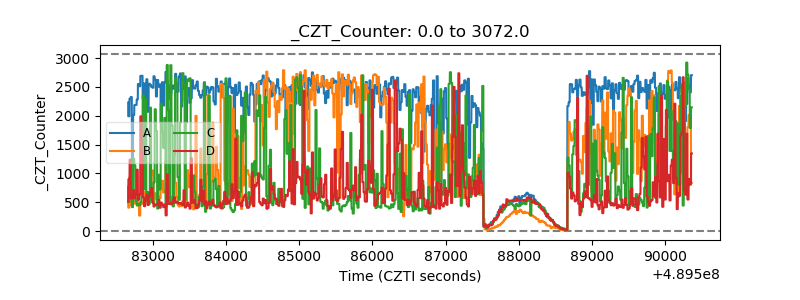 |
| +2.5 Volts monitor |  |
| +5 Volts monitor |  |
| _ROLL_ROT | 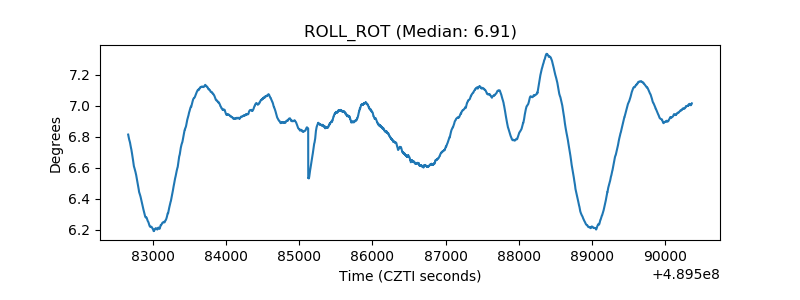 |
| _Roll_DEC | 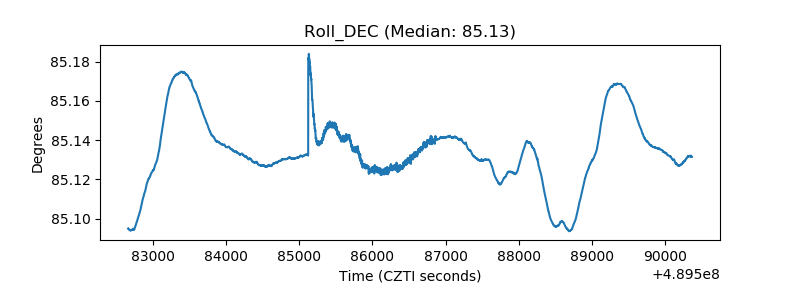 |
| _Roll_RA | 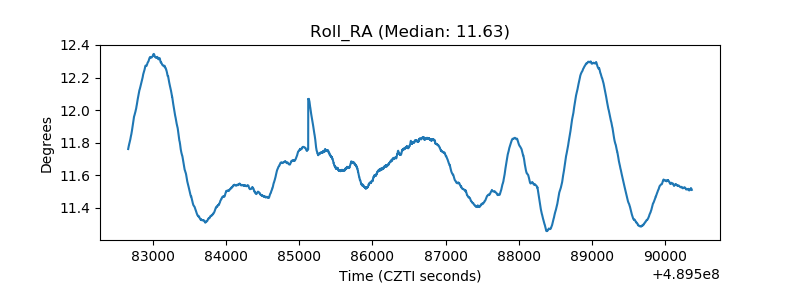 |
| Veto Counter | 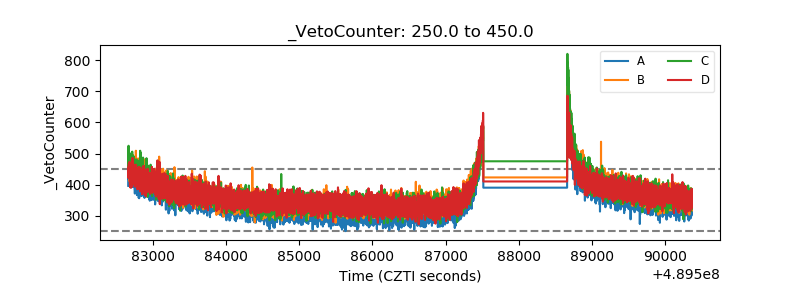 |